Made with
ConceptDraw
DIAGRAM 18

Total Quality Management with ConceptDraw

Total Quality Management (TQM) system is the management method where the confidence in quality of all organization processes is placed foremost. The given method is widely used in production, in educational system, in government organizations and so on. As it follows from the name this method is constructed on three main concepts:

  • Total- implies the application of the method to all processes in system without exception.
  • Quality- implies the definition of quality standards and yearning for reaching of these standards.
  • Management – implies creation of management system with all attributes of similar systems such as planning, organization, staff, etc.

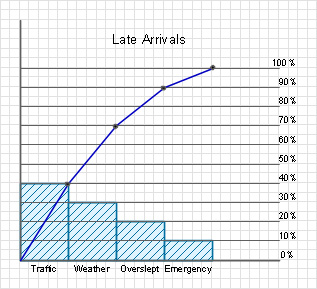
Accordingly to ISO standard, TQM is the management approach for organizations, concentrated on the quality, based on the participation of all organization members and directed to receipt of long- term profit in the form of clients and customers satisfaction, and benefits for all members of an organization and society in general.

Thus, TQM demands application to all processes in a system and implies an exclusion of defects and wastes in such processes.

Any management method demands definite tools for getting the primary information about processes which should be managed, for study and analysis of this information and for further optimization of these processes. Among TQM tools there are Pareto diagrams and Ishikawa diagrams (fishbone), which will be reviewed further and block schemes of processes which were reviewed in separate articles.

Pareto diagrams were named after their creator Vilfredo Pareto. Already in 19th century he came to a conclusion that 80% are concluded in 20% of processes which implies the definition of such processes first of all and the exposure of defects and deficiencies.

To create a Pareto diagram it is necessary to collect the information about the rise of defects in the studied process of the considered system and present these reasons in the form of columns of the diagram with a value which corresponds to frequency of the defect appearance because of this reason. That is, the more often the reason calls the defect in the process the bigger is the column on the diagram. The percentage spacing of the defect by reasons can be used. Further the time interval for review of the defect and reasons is defined. Reasons are formed up from left to right in order of diminution of frequency of a defect appearance by this reason. After this it is created the cumulative curve of the improvement of process parameters at the removal of each of the denoted reasons by way of summation of reasons values.

Naturally, it is impossible to completely get rid of many reasons of defects appearance, but it is possible to reduce their influence of the process by taking appropriate steps. After this the new Pareto diagram is created for comparative analysis and for checking of effectiveness of taken actions.

The best results the usage of Pareto diagram gives in combination with Ishikawa diagram, which allows to reveal the reasons of defects appearance.

Ishikawa diagram (cause-effect relation diagram, “fishbone”) is a scheme which represents factors (reasons) which influence on quality coefficient of the final result of the concerned process. The main factors are 4M:

  • Men
  • Methods
  • Materials
  • Machines

These main factors are subdivided into smaller. The degree of the detailed elaboration is defined only by factors significance and planner’s tasks. With the help of Ishikawa diagram it is possible to show visually all factors which influence on the quality coefficient, sort them out and show their interrelation.

Total Quality Management with ConceptDraw *

The diagram really resembles a fishbone due to the method of its creation. Firstly the “main bone” – the problem or defect is defined. Further “middle bones” –main factors which cause the problem are defined. After this middle bones are supplemented with smaller factors. By means of an expert way it is defined the influence on the problem of each main factor which is indicated on the diagram. It is also possible to define an influence of each smaller factor in the big factor. The more effective method of definition of all reasons which influence on the result of the process is the method of brainstorming for which it is worthwhile to use the corresponding software.

In the result of construction of such diagram it is appeared a clear and visual picture of reasons and their meaning in the forming of existing result of the considered process.


TEN RELATED HOW TO's:
Apart from a well-known quality management, there is also such term as a Total quality management that consists of some particular organization-wide efforts that are taken in order to install and to make permanent some definite climate in which an organization can continuously improve its ability to deliver only high-quality products/services to its customers. Total quality management techniques are known to be drawing on the previously developed ones used within the quality control. Total quality management enjoyed widespread attention during the early 1990s before being overshadowed by Lean manufacturing, ISO 9000 and Six Sigma.Total Quality Management *
Picture: Total Quality Management
Related Solution:
Is it possible to develop a diagram as quickly as the ideas come to you? The innovative ConceptDraw Arrows10 Technology included in ConceptDraw DIAGRAM is a powerful drawing tool that changes the way diagrams are produced. While making the drawing process easier and faster.How to draw a Cross-Functional Flowchart *
Picture: How to draw a Cross-Functional Flowchart
Related Solution:
Fast visualization of structured data is main capability of the ConceptDraw DIAGRAM. With numerous vector stencils and standard flowchart symbols from object libraries and the RapidDraw technology this program stands as the best professional flowchart software for drawing with type of flowchart symbols. ConceptDraw DIAGRAM also known as best flowchart maker.Easy Flowchart Program and Standard Flowchart Symbols *
Picture: Easy Flowchart Program and Standard Flowchart Symbols
Related Solution:
Also included are standardized hr flowchart symbols, meaning your diagrams will be relevant and understood by all business associates.HR Flowchart Symbols
Picture: HR Flowchart Symbols
Related Solution:
ConceptDraw RapidDraw technology is a simple point-and-click design that helps create professional, presentation-ready business process diagrams quickly and efficiently.Business Process Management
Picture: Business Process Management
Organizing and Selecting Social Media Response Messages. Interactive Flowcharts can change the way one creates and organizes their social media response process.What is Interactive Flowcharts *
Picture: What is Interactive Flowcharts
Related Solution:
How do Fishbone diagrams solve manufacturing problems? Fishbone diagrams are successfully used in various fields of industries and manufacturing to analyze the set of possible causes and their effects. Fishbone diagram provides a process to clearly define the “Effect” and then puts you to thinking about the possible causes, based on the categories of common problems in manufacturing. ConceptDraw DIAGRAM application extended with Fishbone Diagrams solution lets you construct Fishbone diagrams and represent globally recognized standards for manufacturing 6 Ms and 8 Ms.How Do Fishbone Diagrams Solve Manufacturing Problems
Picture: How Do Fishbone Diagrams Solve Manufacturing Problems
Related Solution:
Any business process consists from a number of tasks carrying out the certain business goal. It is useful to diagram business processes to ensure that they are as foolproof, logical and sequential as possible. This business process diagram describes a typical booking process flow by the example of a cab booking process. It can be used as a roadmap for any booking system implementation. Diagramming a business process allows you to look at the entire project and take into account all types of possible scenarios. Business process diagram helps you investigate and clarify the process thoroughly so that you can find out how it can be improved. Business process diagram supports team communications by ensuring that each process element is clear and everyone in the team is on the same page. Sometimes your company brings you less profit than you expect it to be, and it’s difficult to reveal the causes. Maybe it’s time to learn new technologies, because business diagram are easily developed by means of special software, so you won’t make any extra effort. In return, you will increase your productivity and get more done in a less time.Business Diagram Software *
Picture: Business Diagram Software
Related Solutions:
ConceptDraw DIAGRAM enhanced with Seven Basic Tools of Quality solution from the Quality area of ConceptDraw Solution Park is an ideal software for fast and easy drawing professional looking quality diagrams, including a Fishbone diagram.Seven Basic Tools of Quality - Fishbone Diagram *
Picture: Seven Basic Tools of Quality - Fishbone Diagram
Related Solution:
Garrett IA diagrams are used at development of Internet-resources, in particulars at projecting of interactions of web-resource elements. The diagram of information architecture of the web resource which is constructed correctly with necessary details presents to developers the resource in comprehensible and visual way.Garrett IA Diagrams with ConceptDraw DIAGRAM  *
Picture: Garrett IA Diagrams with ConceptDraw DIAGRAM
ConceptDraw
DIAGRAM 18