A Study of the Business Value
of Total Quality Management
To ensure that the quality of your services and products are good enough for people to like them and so to become your customers, you might find it interesting to get to known about a study of the business value of total quality management as well as about ConceptDraw DIAGRAM software — a professional tool used for making the smart looking drawings, such as the Total Quality Management (TQM) Diagrams.
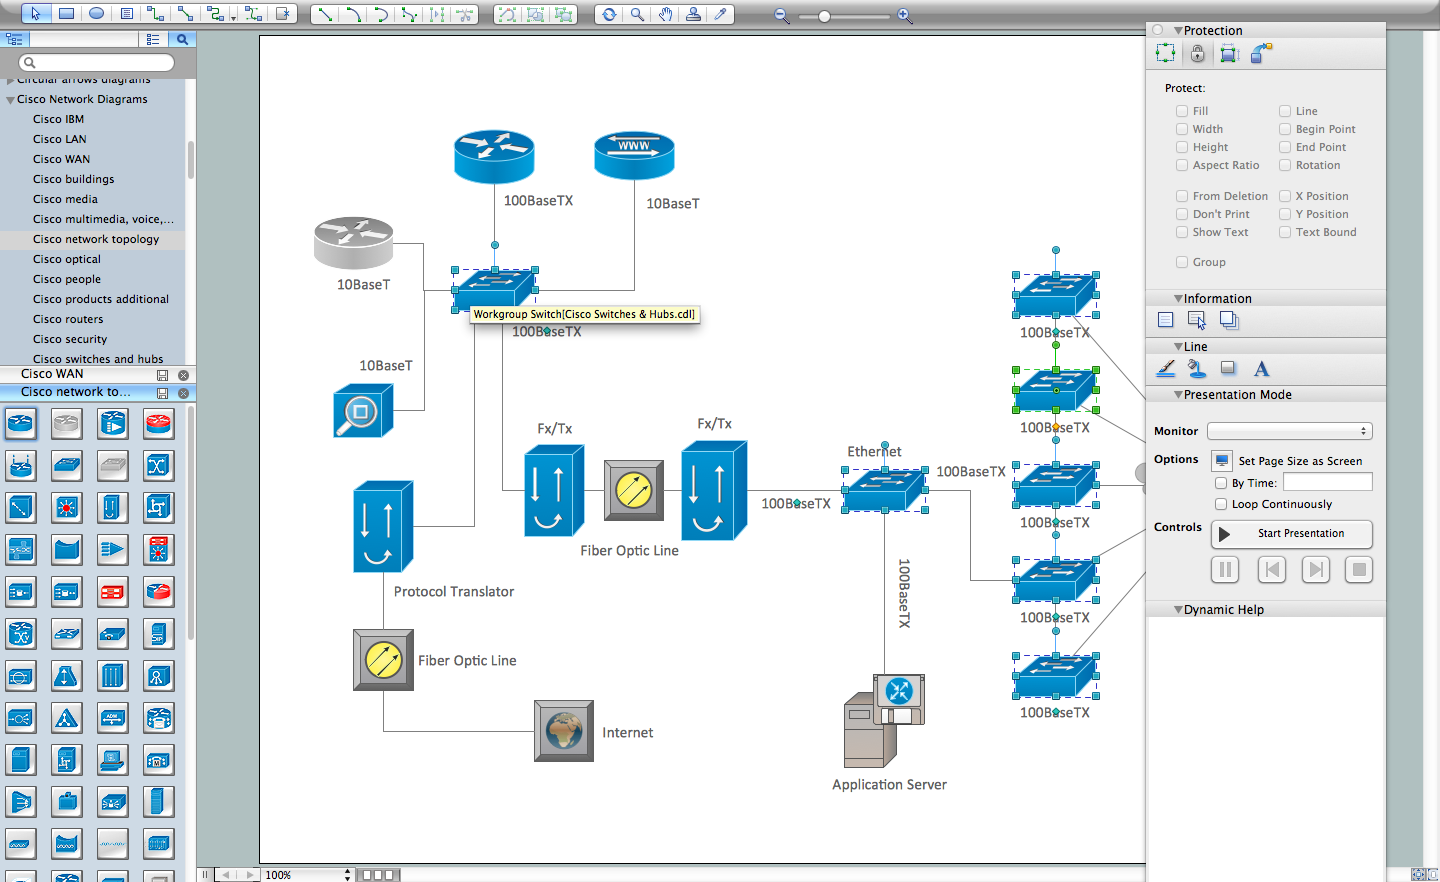
 Diagrams")
Pic.1 Total Quality Management (TQM) Diagrams in ConceptDraw software
TQM is an abbreviation for the term of total quality management, which is known to be consisting of the organization-wide efforts in order to install and so to make permanent some particular climate so any organization can continuously improve its ability to deliver the high-quality products as well as services to its customers. There are no widely agreed-upon approaches nowadays within this study and so TQM efforts are known to be usually drawn being based on the previously developed tools as well as numerous techniques within the quality control term.
The major concepts in the total quality management effort are known to be undertaken by the Navy and include the quality to be defined by the customers' requirements as long as it is a main objective — to satisfy the clients. Top management is known to be directly responsibility for its quality improvement and the increased quality can be expected to come from the systematic analysis as well as from the improvement of the numerous work processes. The quality improvement is simply a continuous effort of the organization.
Such techniques and tools as the PDCA cycle for driving the issues to resolution are known to be widely used within the study of total quality management. The ad hoc cross-functional teams are usually in charge for addressing the immediate process issues and the standing cross-functional teams are expected to be responsible for the improvement of the processes over the long term. The active management participation through steering committees is also a part of the TQM, as well as the well-known Seven Basic Tools of Quality, widely used for analysing the quality-related issues. More information about the Seven Basic Tools of Quality you can always find in the other articles on this site, using the “Search” option in the top right corner of this page.
It is known that there is no generally accepted definition of the several notable organizations have attempted to define it. These include the description in the Department of Defense of Total Quality Management as a strategy for improving performance at all the levels as well as in all areas of responsibility. Combining the fundamental management techniques, the existing improvement efforts and the specialized technical tools under a disciplined structure, which is simply focused on the continuous improvement of all the processes. The improved performance is known to be directed in order to satisfy such broad goals as quality, cost, mission and schedule. The user’s satisfaction is one of the main objectives nowadays. The effort of Total Quality Management helps to build on the work of Dr. J. M. Juran, Dr. W. E. Deming and others, benefiting from both public and private sector experience with the process improvement on the constant basis.
A company practices and management philosophy aim to harness the material and the human resources of an organization in the most effective of the possible ways for achieving the objectives of the organization.
Any management approach of any organisation is known to be centred on quality, which is based on the participation of all the members of such company, aiming at long term success through benefits and customer satisfaction to all members of such organisation as well as society in general.
A term of Total Quality Management was first used in order to describe a management approach to quality improvement. Since that time, Total Quality Management has taken on many different meanings. To put it simply, it is a management approach to a long-term success through the customers’ satisfaction. Any Total Quality Management is based on all the members of a particular organization who are known to be participating in improving processes, services, culture and products which they work to produce. There are many different methods for implementing such approach, which are found in the teachings of such quality leaders as W. Edwards Deming, Philip B. Crosby, Armand V. Feigenbaum, Joseph M. Juran and Kaoru Ishikawa.
Total Quality Management is a well-known philosophy for managing a company in a particular way, enabling it to meet the stakeholder’s needs and his expectations both effectively and efficiently, with no compromise on the ethical values. In the USA, the Baldrige Award, which was created by the Public Law 100-107, recognizes all the American businesses, health care organizations, government, education institutions or non-profit organizations which are known to be the role models for the organizational performance excellence. Such organizations are being judged on the criteria from such categories, as leadership, customers, strategy, workforce, measurement, knowledge management, analysis, operations and results.
In order to evaluate each of those organizations, it is important to answer such questions as “How does the management of a particular company obtain all the available information on their customers’ satisfaction relative to the satisfaction with the competitors of this organization?”. It is also always important to make a record of how such management select, align, integrate and collect the data as well as information for tracking all the operations on the daily basis.
Managing your workforce as well as all of its needs is one of the basic tasks of any management of any organization. Their needs have to be satisfied on time in order to ensure the continuity, preventing the workforce reductions and minimizing their impact.
During the 1990s, there were the standards bodies in such European countries as France, Belgium, Germany, the United Kingdom and Turkey attempted to standardize Total Quality Management. Since then, many of the standards have been withdrawn, so they all nowadays are effectively superseded by ISO 9000.
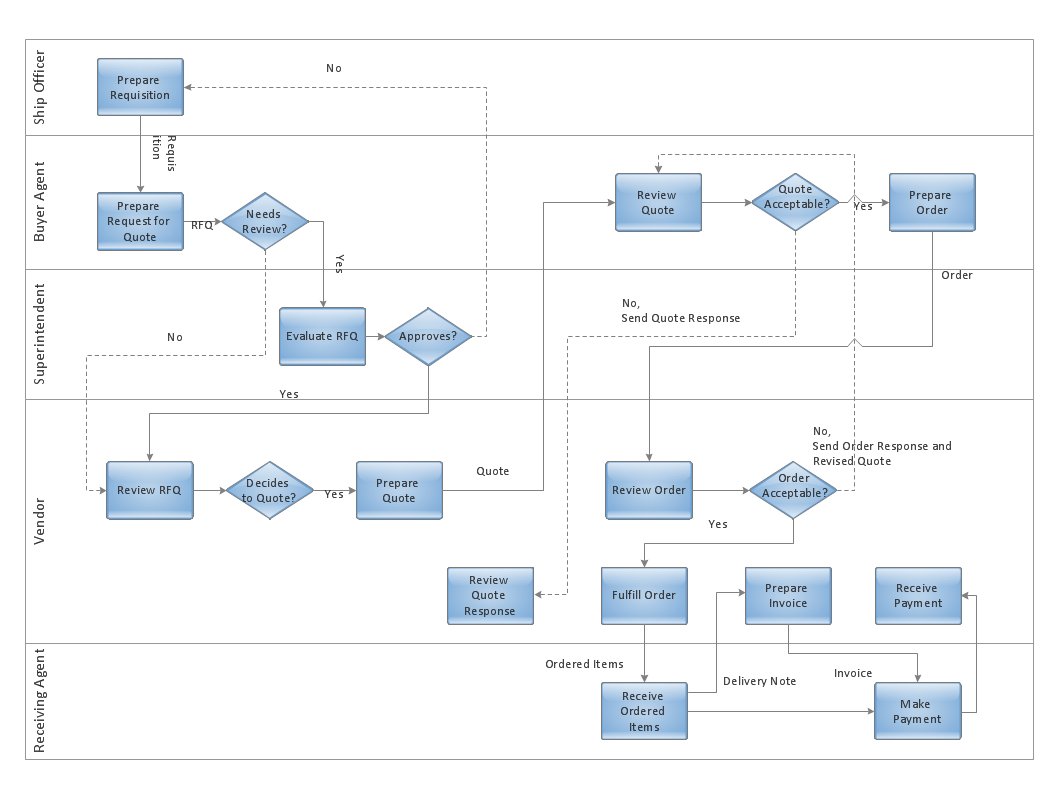
Pic.2 TQM diagram: Business process
This diagram was created in ConceptDraw DIAGRAM using the TQM library from the Total Quality Management (TQM) Diagrams solution.
Using ConceptDraw DIAGRAM connectors to create TQM flowchart is an intuitive and time-saving solution. This example shows a business process diagram that can be then analyzed for ways to improve the process effectiveness and diagnose quality issues that require resolution.
See also Samples: