
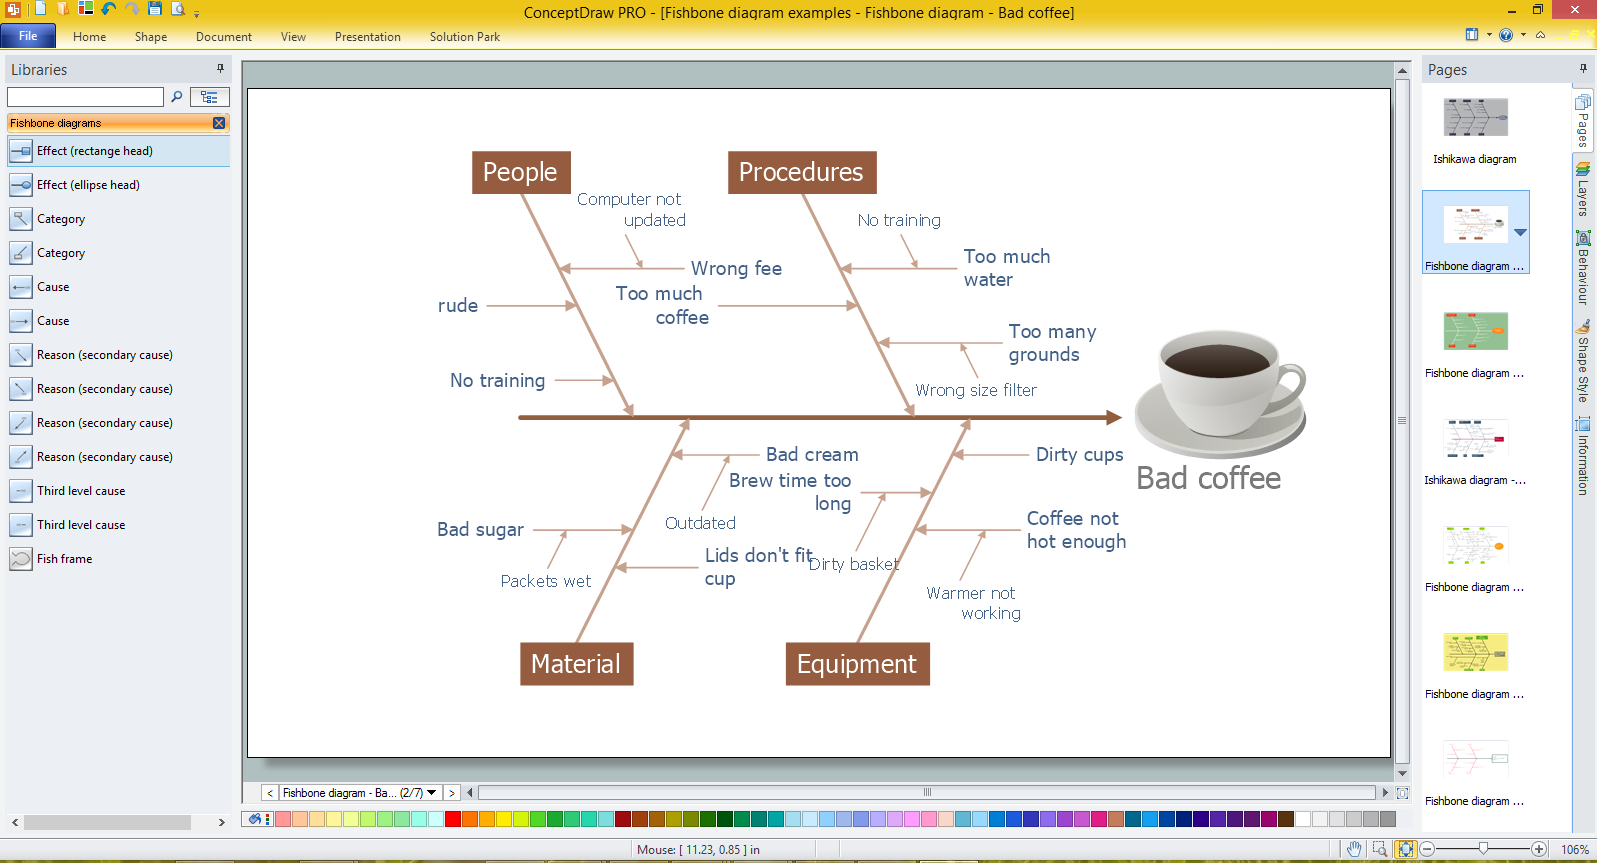
Example 1. Cause and Effect Analysis - Fishbone Diagrams for Problem Solving
Fishbone Diagrams Solution offers the Fishbone Diagrams library with a lot of predesigned vector objects indispensable to solve problems using the Cause and Effect Fishbone diagram.
This solution includes also variety of predesigned templates and samples, any of them can be used as a perfect base for cause and effect analysis. All this collection is available at ConceptDraw STORE.

Example 2. Fishbone Diagram - Templates and Samples
All samples and templates offered by Fishbone Diagrams Solution are professional looking, colorful and attractive, they are available for changing and further successful using as is or at the changed and supplemented view.
Example 3. Fishbone Diagram for Problem Solving in ConceptDraw DIAGRAM /p>
The samples you see on this page were created in ConceptDraw DIAGRAM using the tools of the Fishbone Diagrams Solution. An experienced user spent 10 minutes creating each of these samples.
Use the Fishbone Diagrams Solution for ConceptDraw DIAGRAM Solution Park for effective cause and effect analysis and for drawing your own Fishbone Diagrams for problem solving.
All source documents are vector graphic documents. They are available for reviewing, modifying, or converting to a variety of formats (PDF file, MS PowerPoint, MS Visio, and many other graphic formats) from the ConceptDraw STORE. The Fishbone Diagrams Solution is available for all ConceptDraw DIAGRAM or later users.
TEN RELATED HOW TO's:
You can see that when you rotate a group, connectors change their angle, keeping their position inside of the grouped objects. If you decide to ungroup the objects, the connectors will adjust to keep lines parallel to the edges of the sheet.
The magic of ConceptDraw Arrows10’s rotating group containing connectors, makes complex diagramming simple and easy.
The way to connect objects has never been easier.
Picture: ConceptDraw Arrows10 Technology
Any hierarchical structure of any company can be represented as a triangle or a pyramid. You can create a pyramid diagram and pyramid chart of any complexity using special libraries included in ConceptDraw DIAGRAM. Actually, any knowledge or chain of facts can also be depicted as a pyramid.
A wide range of graph and chart are utilized in marketing to maintain documentation and various visual issues, that deal with marketing information and data. The marketing value pyramid can be created to illustrate how the value of company, or product is based on its competitiveness. To design this diagram we used ConceptDraw DIAGRAM drawing tools in conjunction with Pyramid solution for Solution Park.
Picture: Pyramid Diagram and Pyramid Chart
Related Solutions:
ConceptDraw DIAGRAM software supplied with HR Flowcharts Solution can effectively help in labour-intensive process of human resource development.
Picture: Human Resource Development
Related Solution:
These libraries of vector objects depict the Site Accessories and Parking and Roads elements. They are needed to draw architectural and landscape plans that show the architectural elements around buildings: parking spaces, hiking and biking trails, drainage systems, lights, and vehicle access control elements. These libraries are included into ConcepDraw solution for Site Planning. Site Accessories and Parking, Roads libraries contain near 40 vector images that will help depict an a surrounding territory at building plans.
These libraries of vector objects depict the Site Accessories and Parking and Roads elements. They are needed to draw architectural and landscape plans that show the architectural elements around buildings: parking spaces, hiking and biking trails, drainage systems, lights, and vehicle access control elements. These libraries are included into ConcepDraw solution for Site Planning. Site Accessories and Parking, Roads libraries contain near 40 vector images that will help depict an a surrounding territory at building plans.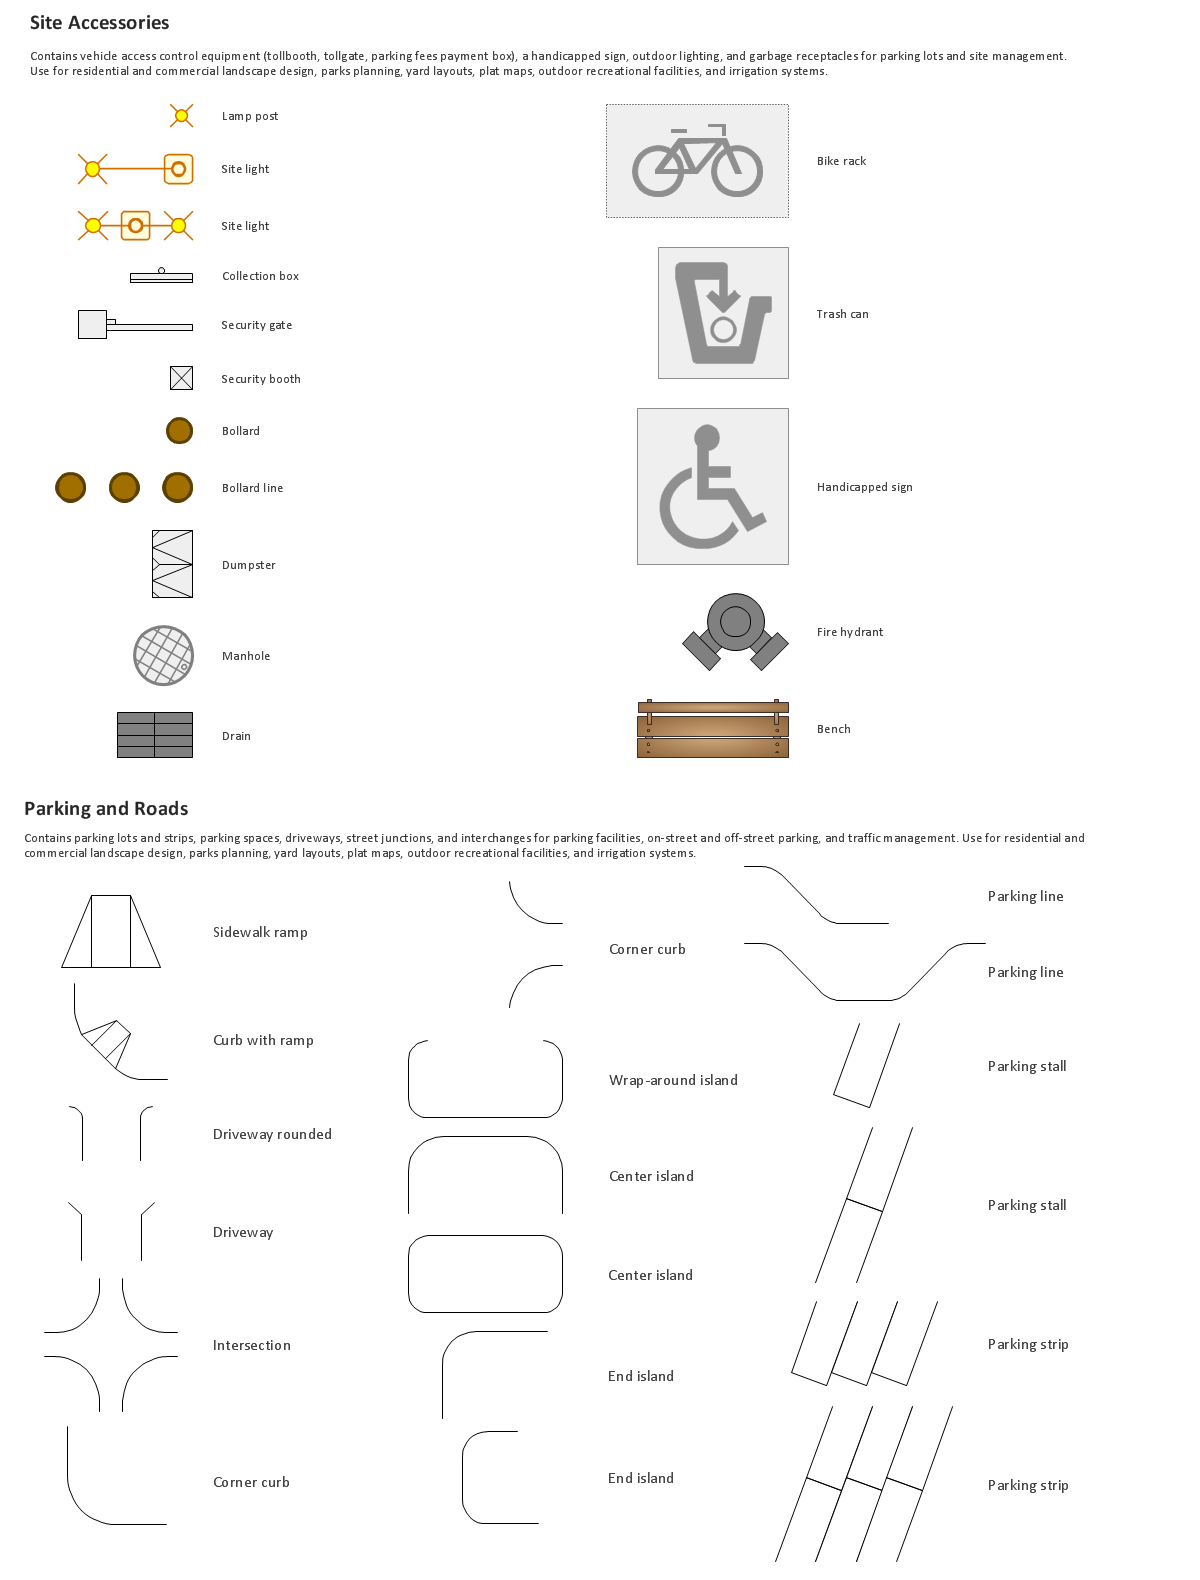
Picture: Building Drawing. Design Element Site Plan
Related Solution:
The strategic balance is a combination of factors that can both positively and negatively affect the activity of the company. To know the factors that influence the organization success, managers should use SWOT matrix template that will define the potential inner strengths and weaknesses and potential external opportunities and threats. This matrix does not contain a ready solution, but allows to streamline all the available information.
This is a handy template of a SWOT matrix. It can serves as a visual guide for management students. To simplify the task, on the left and on the right we have added hints with examples of external and internal factors. This template one can found among numerous templates of SWOT and TOWS matrices that are included in the the eponymous solution by ConceptDraw Solution Park.
Picture: SWOT Matrix Template
ConceptDraw DIAGRAM diagramming and vector drawing software enhanced with powerful HR Flowcharts Solution perfectly suits for Human Resource Management.
Picture: Human Resource Management
Related Solution:
To design line and scatter charts use ConceptDraw DIAGRAM diagramming and vector drawing software extended with Line Graphs solution from Graphs and Charts area of ConceptDraw DIAGRAM Solution Park. (Line chart, scatter chart, 2d chart).
Picture: Line Graph Charting Software
Related Solution:
The recruitment process often requires design and use of various HR flowcharts, diagrams, attractive illustrations.
Picture: Recruitment
Related Solution:
Nowdays business people’s figures are most favourite vector illustrations among presenters and designers. It is easy to make them and use, but they can make your graphics look really good looking & eye catching.
Just check ConceptDraw business perople figusers pictures, you will see all kinds of silhouetes: Staff, Employed workers, Persons and Groups symbols.
Best popular vector pictures are: men, dancing people, business man.
Use human contours wise and it will help you to tell main idea of your design message.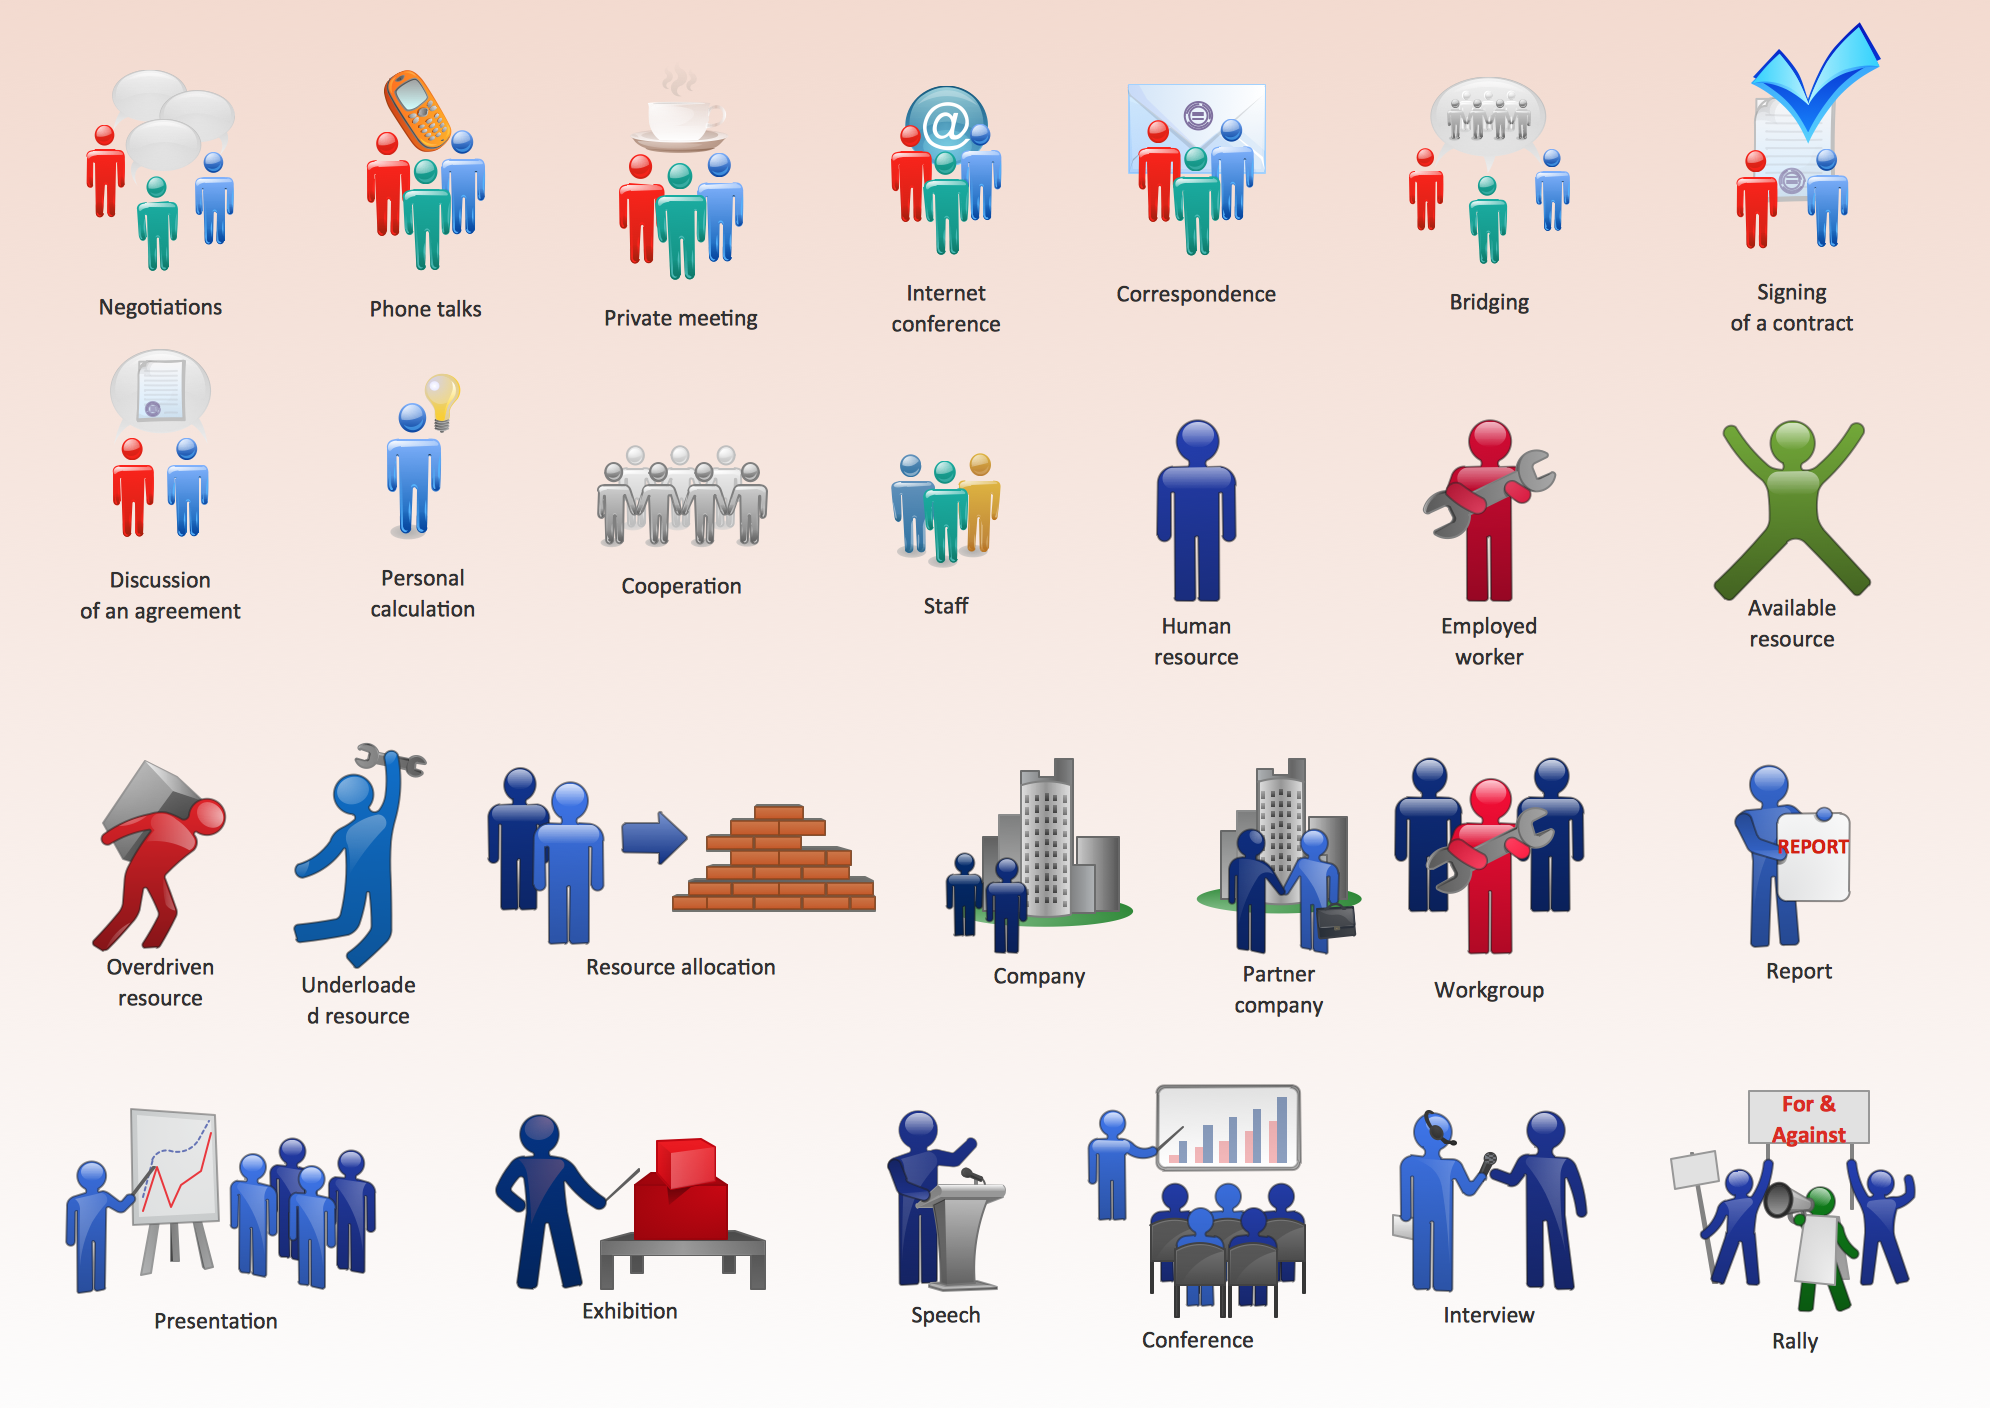
Picture: Business People Figures
Related Solution:
Bar charts represent data in different categories or groups.
Create bar graphs for visual solving your scientific problems and data comparison using the ConceptDraw DIAGRAM diagramming and vector drawing software extended with the Bar Graphs Solution from the Graphs and Charts area of ConceptDraw Solition Park.
Picture: Bar Diagrams for Problem Solving.Create space science bar charts with Bar Graphs Solution
Related Solution:

