Made with
ConceptDraw
DIAGRAM 18

S Video Connection

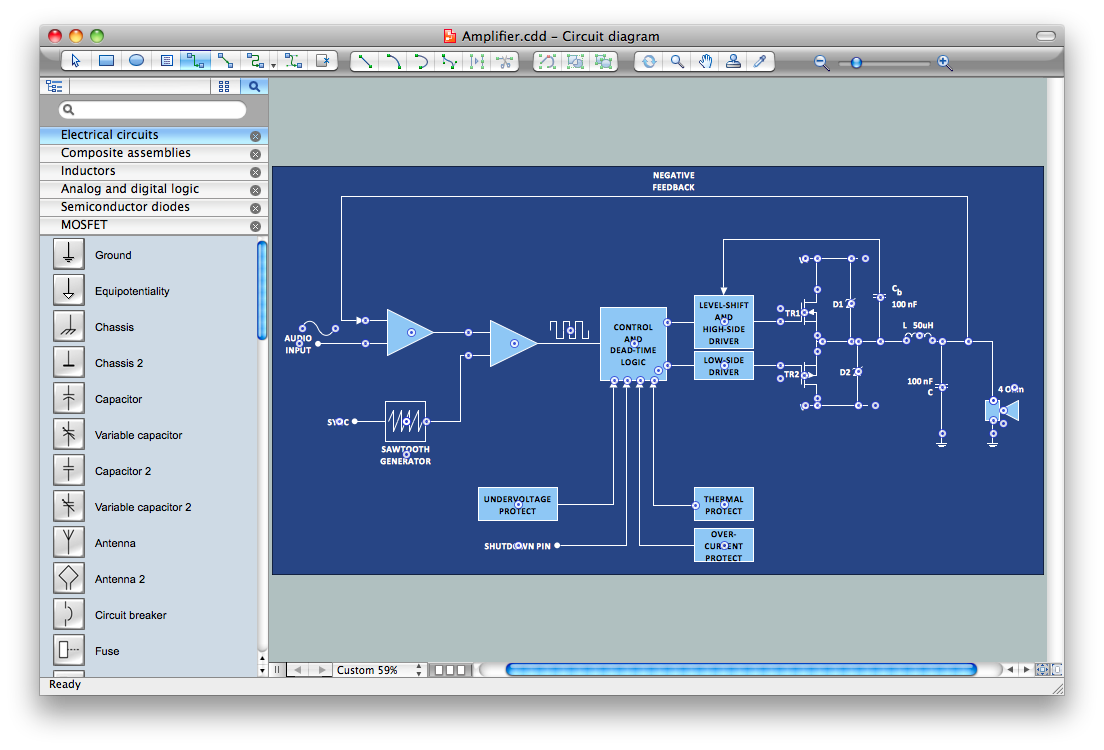
To demonstrate and to explain the S-Video connections, the ConceptDraw DIAGRAM diagramming and drawing software can help, as well as another product of CS Odessa — the ConceptDraw STORE and the Audio and Video Connectors Solution in particular.

Audio and Video Connectors Solution in ConceptDraw STORE

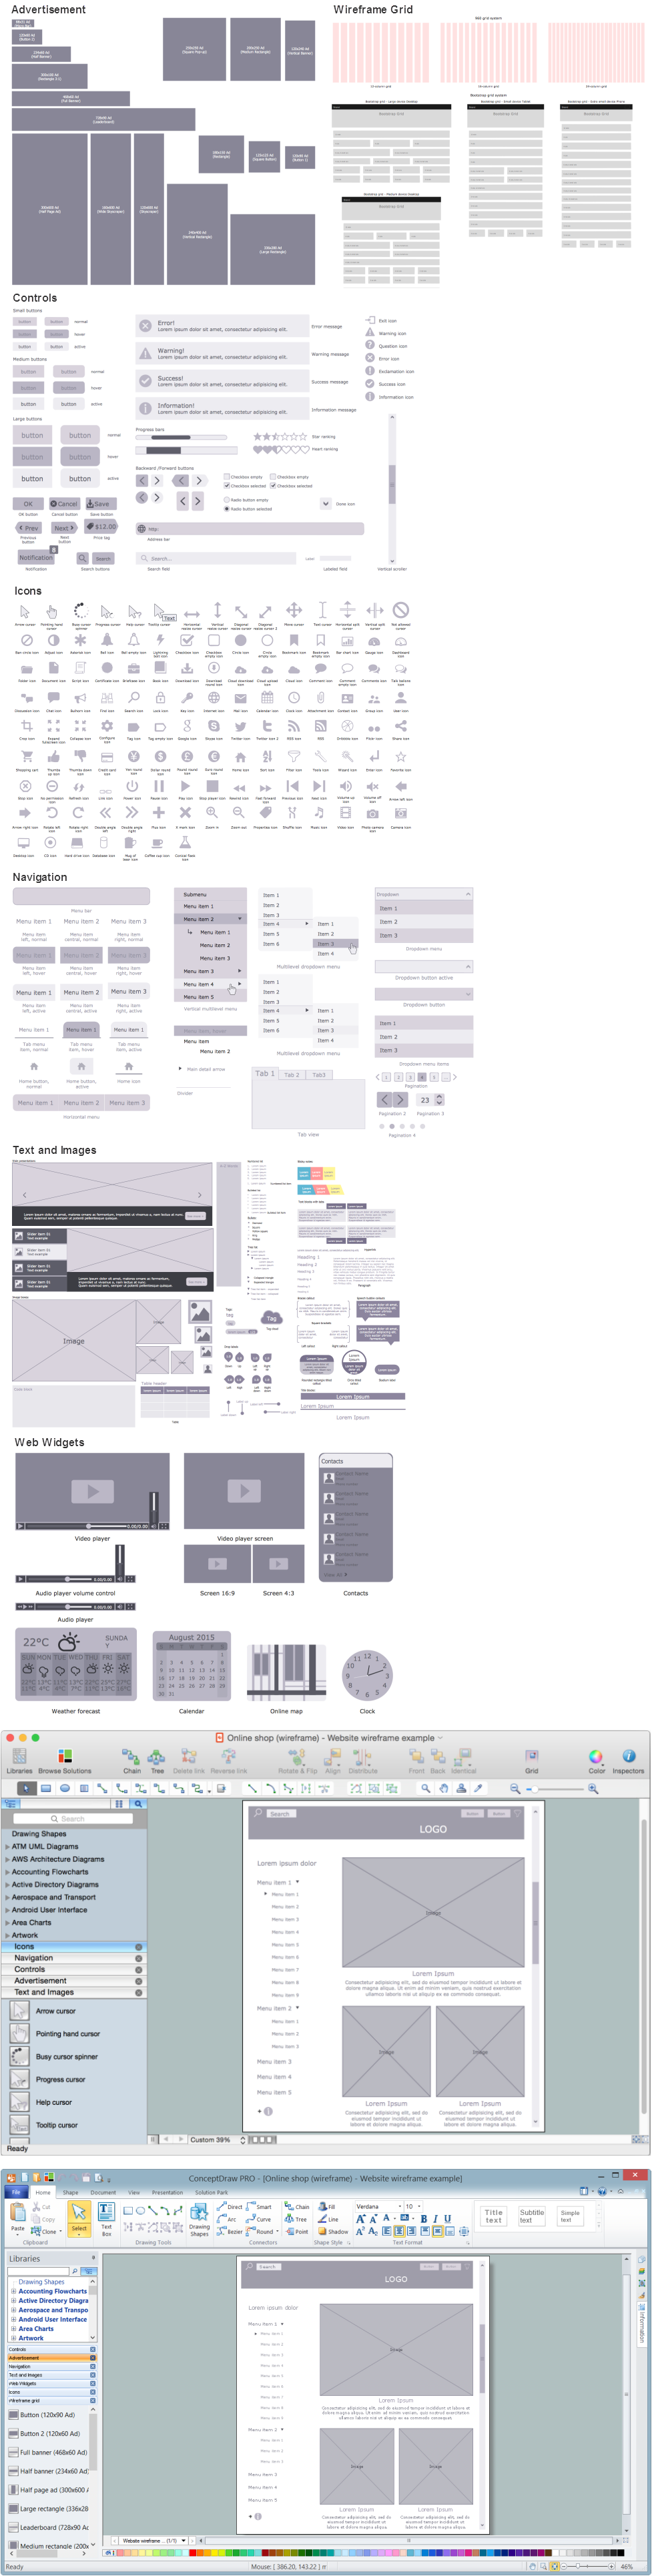
Example 1. Audio and Video Connectors Solution in ConceptDraw STORE

The “S-Video” term can be also known as “Y/C” or “separate video”, being a signaling standard for standard definition video (usually 576i or 480i). By separating both coloring and black-and-white signals, any “S-Video” can achieve much better image quality to compare to the composite video. Nevertheless, any “S-Video” is well-known for having a lower color resolution to compare to the component ones.

There is a standard analog which the television signals go through. It is known to be going through a few processing steps on its way to being broadcast. Each of the mentioned can discard the information, lowering the quality of the final images.

The image should be originally captured in RGB form. After, it gets processed into three signals — the “YPbPr” ones: the first one is called “Y”. It may be created from all three original signals that are based on a formula that produces the needed brightness of the image called “luma”. The mentioned signal is known to be closely matching a traditional black-and-white television signal. The so-called “Y/C” method of encoding was a key that could have led to the backward compatibility. Once such “Y” signal is produced, it is subtracted from the blue signal to produce “Pb”. It also gets subtracted from the red signal in order to produce Pr.

If there is a need in recovering the original RGB information for display, the signals can be mixed with the Y for producing the original red and blue, and then the sum of the mentioned can get mixed with the Y in order to recover the green.

Any signal that has three components is not as easy to broadcast if to compare it to the original three-signal RGB. That is why the additional processing is always required. The first step is to combine the Pr and Pb in order to form another, the “C” signal. It is a usual procedure to achieve the chrominance.

Both amplitude and phase of the signal are what the two original signals represent. The mentioned signal can be bandwidth-limited after for complying with the requirements for broadcasting. The resulting C and Y signals can be after mixed together for producing the composite video. If you want to play back some composite video, then you have to separate both the “Y” and “C” signals which may be and difficult to do without adding any artifacts.

S Video Connection *

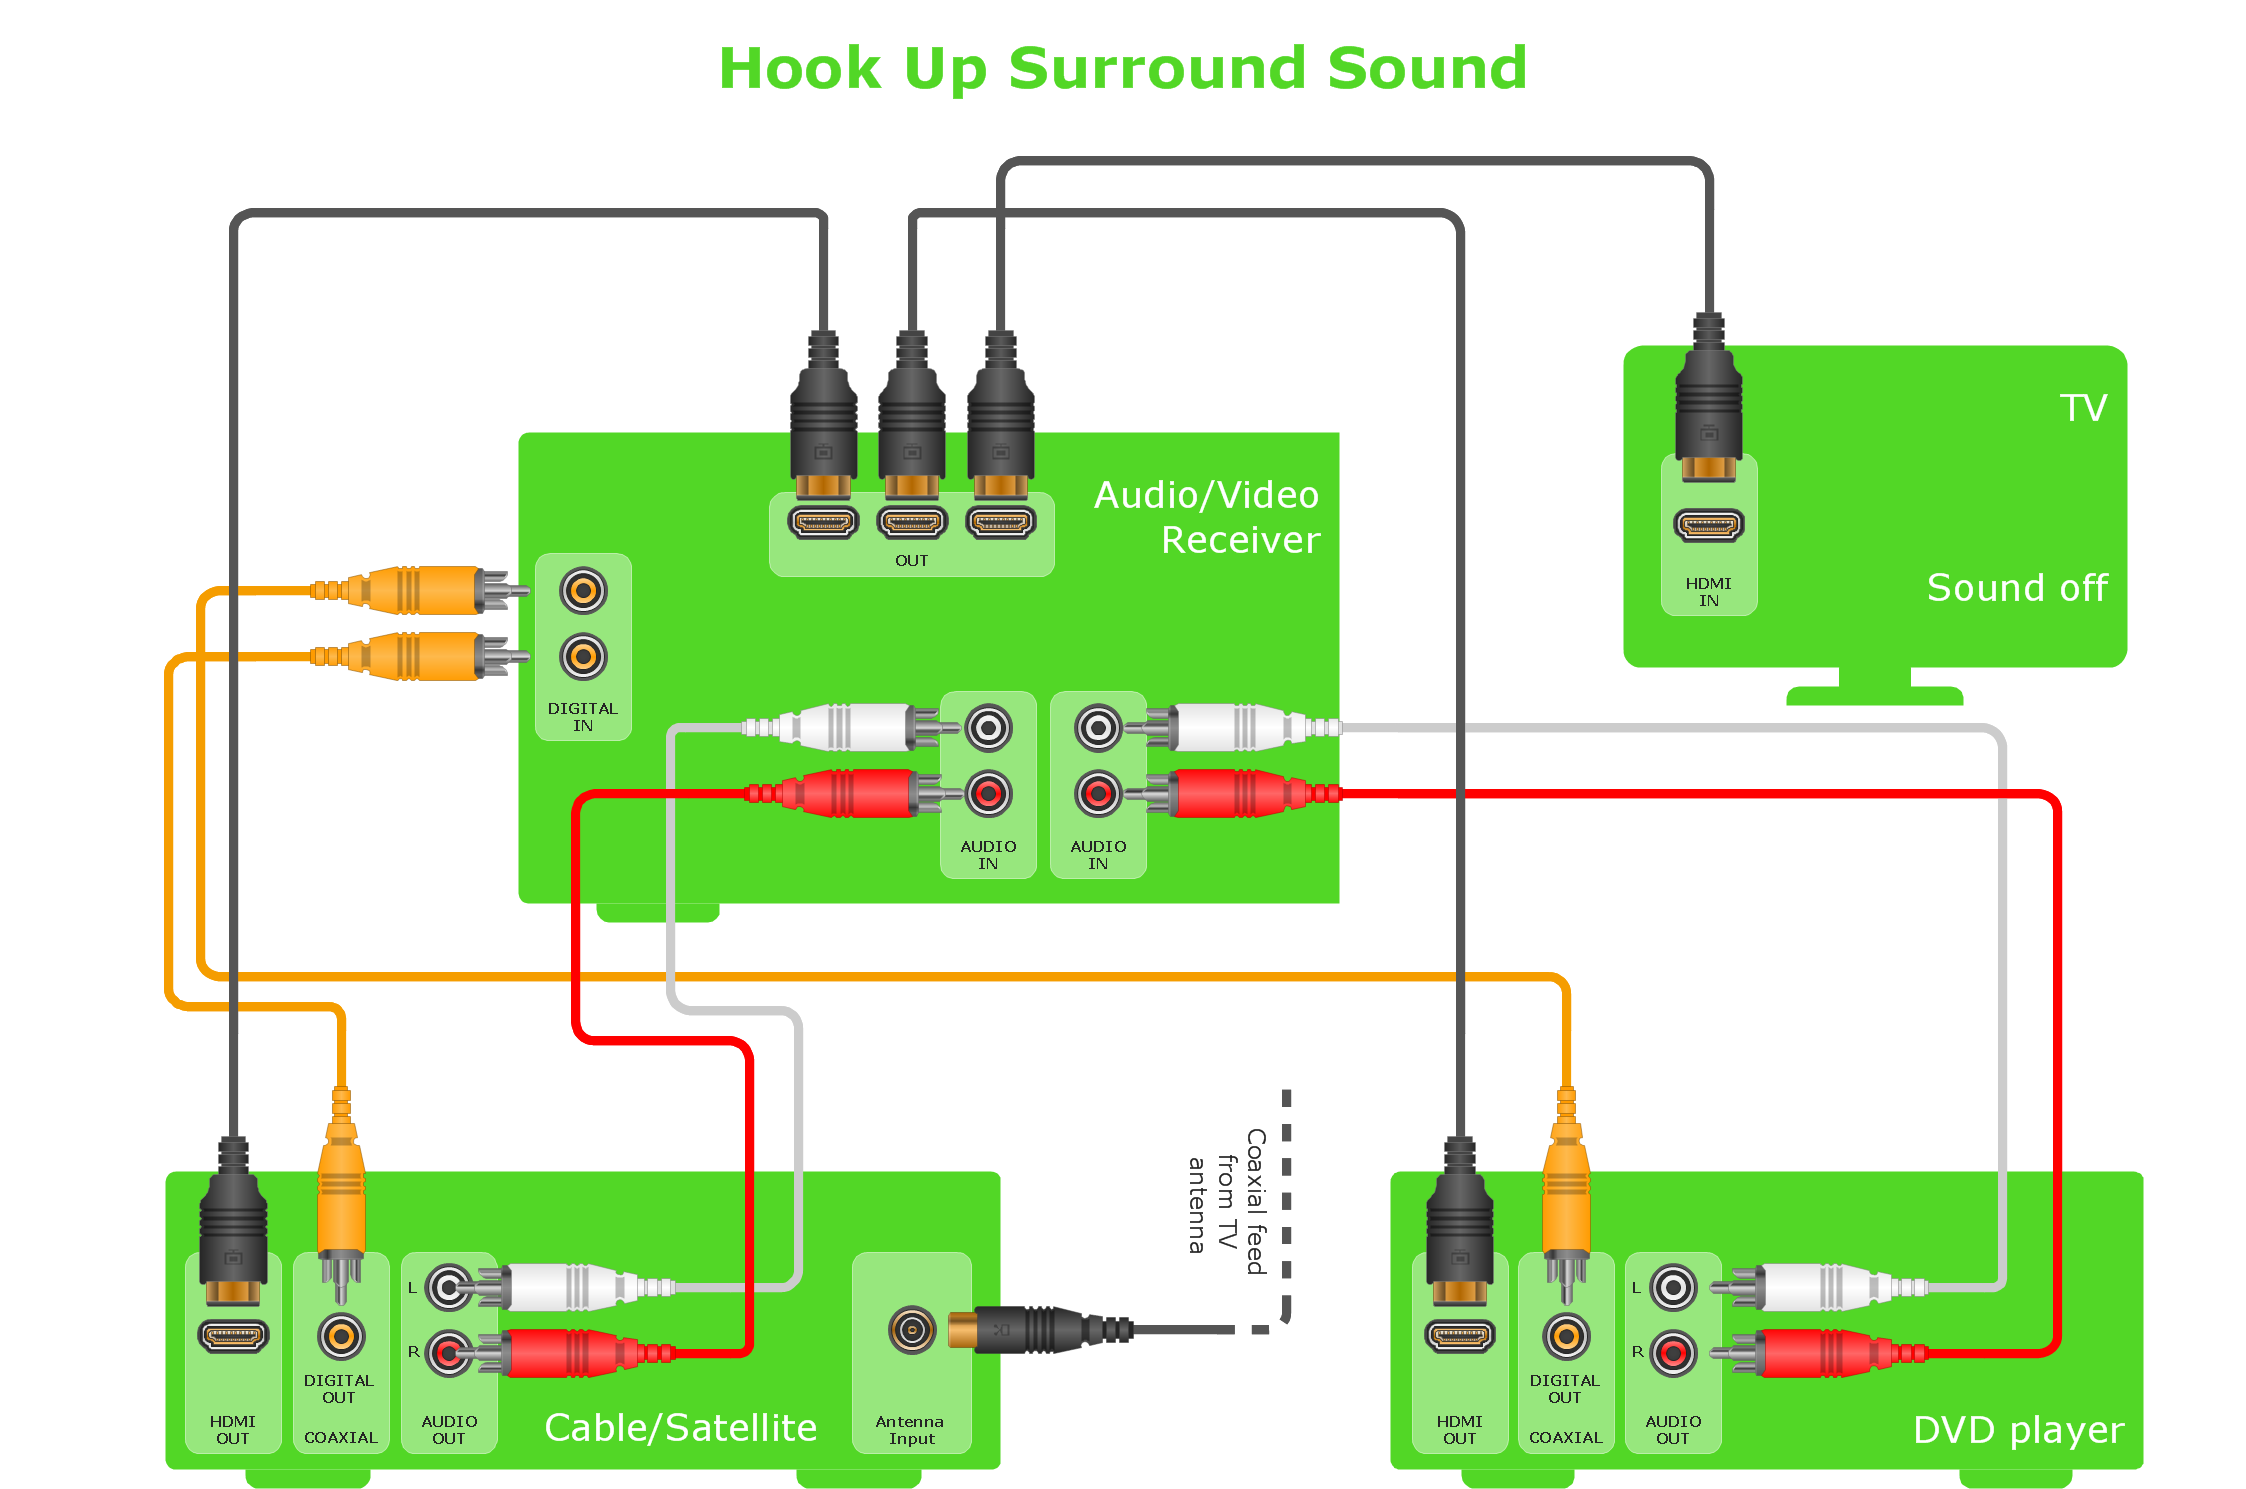
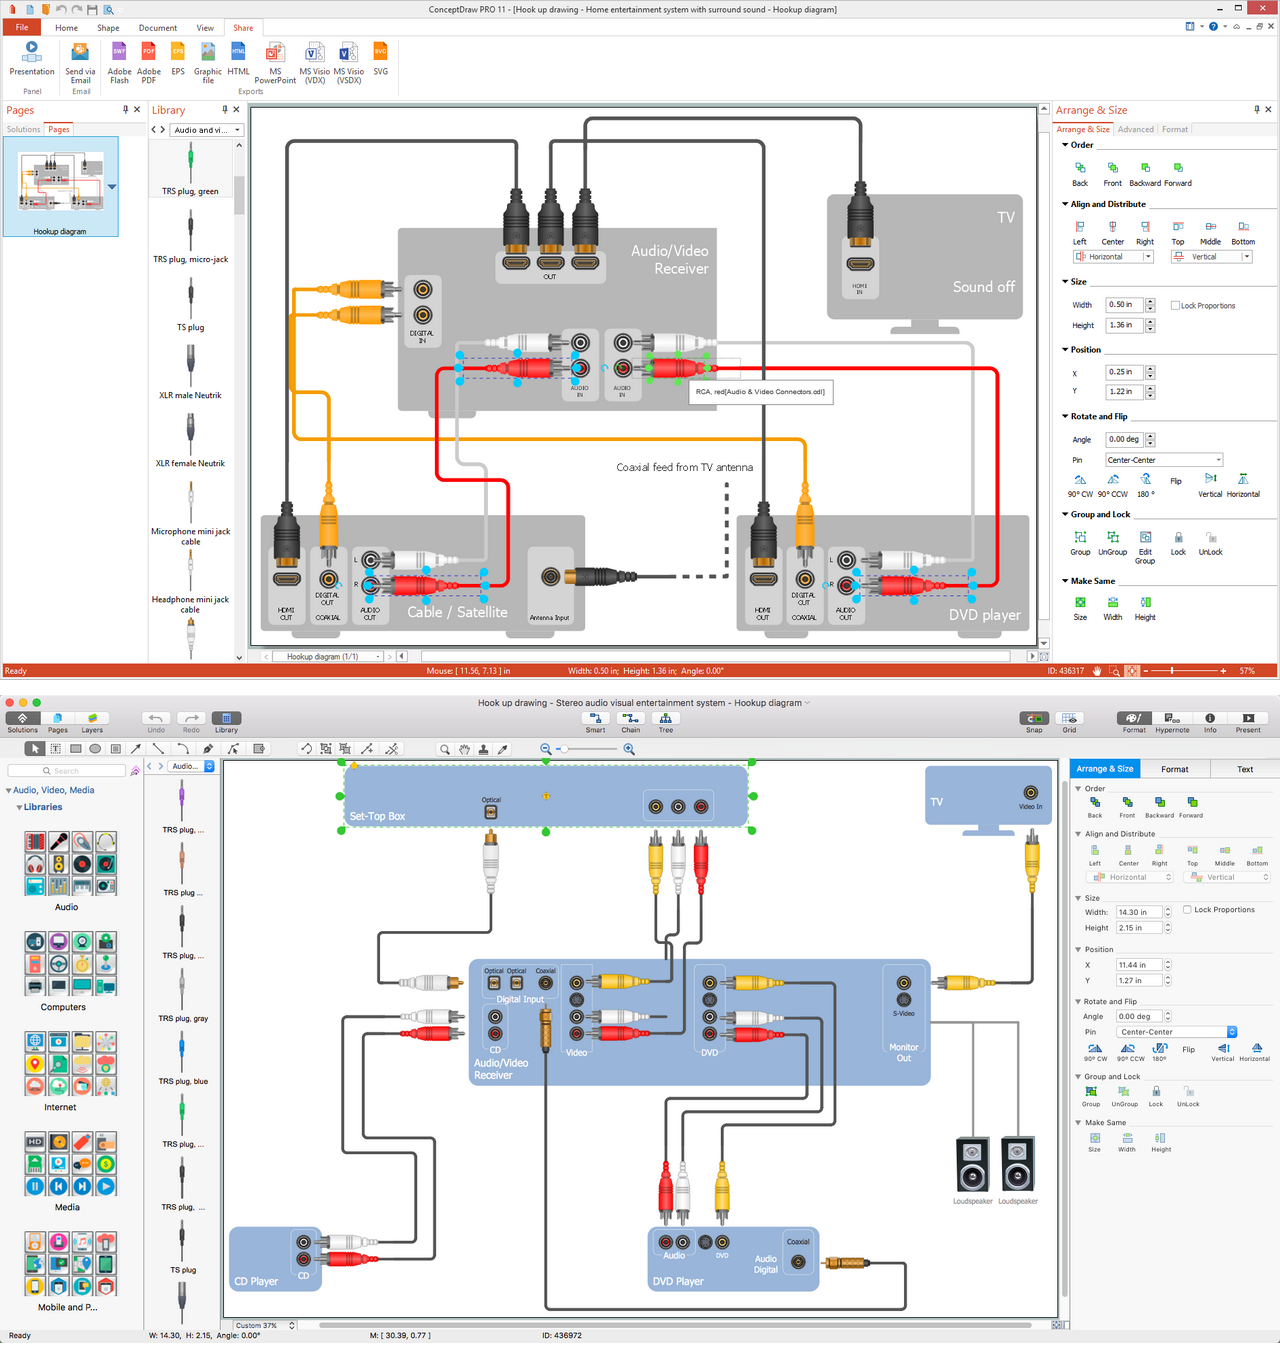
Example 2. S Video Connection

Each of the described steps may still lead to the unavoidable or deliberate loss of the quality. In order to retain it in the final image, it is better to eliminate as many of the decoding/encoding steps as possible. “S-Video” is one of the approaches that can be used for solving this problem by eliminating the final mixing of C with Y as well as the subsequent separation itself at the so-called “playback time”.

Carrying video, the S-video cable may be using ground pairs (termed C and Y) and synchronized signal. The luma signal is Y: it carries either or black-and-white or luminance of the picture, including the synchronization pulses. At the same time, C is known to be the so-called “chroma” signal, which carries the coloring-in or chrominance of the picture. The mentioned signal is known to be containing both the hue and the saturation of the video.

Any luminance signal is known to be carrying both vertical and horizontal sync pulses in the same way as a composite video signal. Luma is what a signal that is responsible for carrying the luminance after gamma correction called. In case you wonder why Luma is termed "Y", the answer is the following: it is simply similar to the lower-case Greek letter gamma.

In any composite video, the signals can co-exist on completely different frequencies. In order to achieve such effect, the luminance signal must be low-pass filtered. I should happen while dulling the images. S-Video is what can maintain two signals as separate ones. This detrimental low-pass filtering is not that necessary for luminance, but the chrominance signal still has some limited bandwidth that is relative to the component video.

To compare it with component video, which separates the color-difference signals into Cr/Pr and Cb/Pb while carrying the identical luminance signal, the color resolution of S-Video can be limited by the modulation on a subcarrier frequency of 3.57 to 4.43 megahertz. It all depends on the standard. It is also very important to know that this difference is simply meaningless on the home videotape systems. The reason for such statement is: the chrominance is already constrained by Betamax and VHS.

Carrying any color information in a way of one signal means that this color has to be encoded, usually in accord with PAL, SECAM, or NTSC, but it all depends on the applicable local standard.

S-Video also is known to be suffering from the so-called “low color” resolution. NTSC S-Video color resolution is 250 lines horizontal versus 120 lines horizontal for the Rec. 601-encoded signal of a DVD.

That may be a reason why S-Video is not as common in many European Union countries. Another reason may be the dominance of SCART connectors, which can be found on the most existing televisions. It is always possible to output any S-Video over SCART for a player, but televisions' SCART connectors are not always wired enough in order to accept it. In case they are not, then their displays can show only the monochrome images. To solve this problem, it is possible to modify the SCART adapter cable in order to make it work.

Connector Types Diagram in ConceptDraw DIAGRAM title=

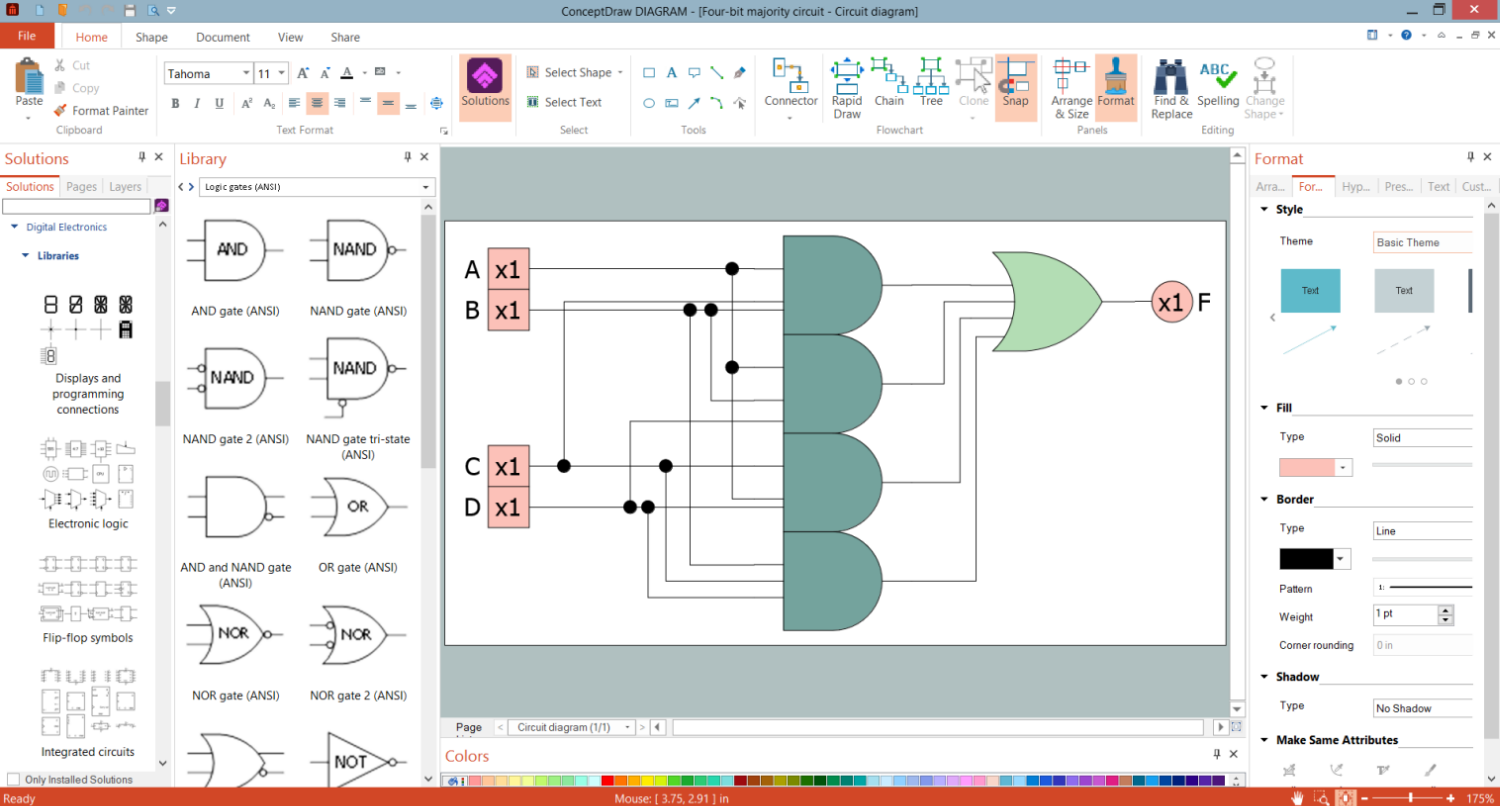
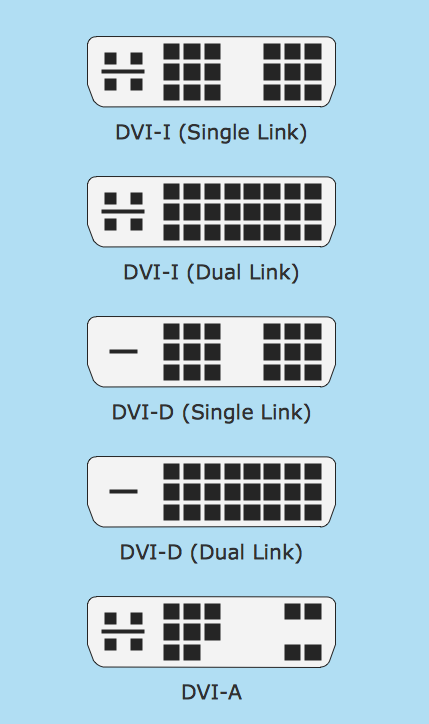
Example 3. Connector Types Diagram in ConceptDraw DIAGRAM

To make more the explanations about how the mentioned connectors work is always possible in a way of a text to it can be also done by representing them in a way of a drawing by using the ConceptDraw DIAGRAM and ConceptDraw STORE applications. Thus, once they are downloaded from this site, it is always possible to find the Audio and Video Connectors solution in the ConceptDraw STORE, to install it and to use while working in the ConceptDraw DIAGRAM making the smart looking drawings.


NINE RELATED HOW TO's:
Sometimes, when it is difficult to create a functional space plan or to rearrange existing one, the art of interior design comes in. It doesn't matter, if you need a cozy bedroom or an office layout plan, you should use appropriate tools to make your design great. While making a floor plan of a new office it could be useful to apply some design elements such as furniture and office equipment. This diagram presents an office furniture objects that can be used for office interior design planning, or making office furniture and equipment layouts. This vector stencils library is supplied with ConceptDraw Office Layout Plans solution. It contains more then 30 vector objects of office interior for making office floor plans including an office space layout plans and furniture arrangement.Office Layout Plan Design Element
Picture: Interior Design. Office Layout Plan Design Element
Related Solution:
The Audio & Video Connectors solution contains a set of pre-designed objects, libraries, templates, and samples; allowing quick and easy diagramming of various configurations of audio and video devices.Audio & Video Connections *
Picture: Audio & Video Connections
Related Solution:
Audio connectors are electrical connectors designed and used for audio frequencies. ConceptDraw DIAGRAM diagramming and vector drawing software extended with Audio and Video Connectors Solution from the Industrial Engineering Area is the best for drawing various audio schematics with detailed illustration the audio connectors.Audio Connectors *
Picture: Audio Connectors
Related Solution:
Beginning from the 19th century, people tried to tame electricity. Nowadays, electrical engineering covers a wide range of applications starting from providing illumination in our homes to developing space technologies. Considering the fact that every project needs documentation, engineers use electrical diagram software to develop these projects. Standard electrical symbols of electrical components are recognizable all around the world. This illustration represents the 26 libraries that are supplied by the ConceptDraw Electrical Engineering solution. The Electric Engineering libraries contains about a thousand objects enabling you to draw various charts depicting electrical connections and circuits, along with schemes of different equipment and devices. The electric engineering libraries delivered with ConceptDraw solution meet the standards adopted in the image to electrical circuits. So they can be used by professionals along with amateurs in electrical engineering.Electrical Diagram Software *
Picture: Electrical Diagram Software
Related Solution:
When we start to speak about databases, we must always mention database structure visualization. One of the most common ways to do it is to create an entity relationship diagram, and to put appropriate symbols on it. It is important either for database projecting and for its' future maintenance. Entity Relationship Diagram describes data elements and their relationships within a database. There are a set of special symbols that depict each element of an entity relationship diagram. Entities - represents some stable components such as supplier, employee, invoice, client, etc. Relation symbols show how the entities interact. Attributes define characteristics of the relationships. Attributes can be one-to-one or many-to-many. Physical symbols is used in the physical models. They represent items such as fields, tables, types and keys. ERD physical symbols are the building material for the database. Notation lines are used to illustrate the relationships. The most common method is Crow’s Feet notation. You can use ConceptDraw Entity-Relationship Diagram (ERD) solution to represent a database using the Entity-Relationship model.Entity Relationship Diagram Symbols
Picture: Entity Relationship Diagram Symbols
Related Solution:
Mac compatible remote presentation, A simple way to share your presentation remotely via Skype. All participants receive presentation file.Mac Compatible Remote Presentation *
Picture: Mac Compatible Remote Presentation
Related Solution:
Big and complex projects sometimes need some simplification of plans and schedules. That's why Program Evaluation and Review Technique was invented and first implemented in 1958. You can create PERT diagrams effortlessly with ConceptDraw DIAGRAM and share them with your colleagues. Program Evaluation Review Technique (PERT) is a method that is used to assess and analyze projects. PERT is a valuable tool for the project management practice. PERT gives an assessment and analysis of the time needed to the project completion. A PERT chart is a visual tool that delivers a graphical view of a project timeline. It is used to display the sequences and dependences of project tasks necessary to complete a project. ConceptDraw DIAGRAM delivers the possibility to build a PERT along with other diagrams applied to assist management process by using its Seven Management and Planning Tools solution.Program Evaluation and Review Technique <br>(PERT) with ConceptDraw DIAGRAM  *
Picture: Program Evaluation and Review Technique (PERT) with ConceptDraw DIAGRAM
Related Solution:
Creation of well thought-out network security model will effectively help you in realization your network's security. ConceptDraw DIAGRAM diagramming and vector drawing software extended with Network Security Diagrams Solution from the Computer and Networks Area of ConceptDraw Solution Park lets fast and easy design all variety of network security models: Open network security model, Closed network security model, Restrictive network access model.Network Security Model
Picture: Network Security Model
Related Solution:
This diagram represents the electrical floor plan. This is a common practice - to draw the electrical plan on the floor plan. The outlets, fixtures and other electrical equipment are depicted on the floor plan with special symbols. This drawing was created using the possibilities of ConceptDraw DIAGRAM as CAD software. Computer-aided design software is intended to replaces manual engineering drafting with an automated process. CAD software is used by engineers, architects, and others to make high-precision technical drawings and illustrations. CAD software allows technical specialists to develop, examine and manage various engineering projects. It is almost impossible nowadays to imagine mechanical engineering without digital technologies. Finding a suitable CAD software for creating mechanic diagram and electrical diagram architectural designs can take a lot of time and effort. However, with ConceptDraw DIAGRAM you can create any diagram that you want and later convert it to the most popular graphic formats like.vsdx,.png,.pptx etc.ConceptDraw DIAGRAM software for making mechanic and electrical diagrams for architectural design
Picture: CAD Drawing Software for Making Mechanic Diagram and Electrical Diagram Architectural Designs
Related Solution:
ConceptDraw
DIAGRAM 18