
Example 1. Electrical Schematics - Bipolar Current Mirror
The easiest way to design Electrical Schematics in ConceptDraw DIAGRAM software is to choose the sample appropriate for your needs and make changes in it. Thanks to the Electrical Engineering Solution we have a variety of electrical engineering examples and samples in ConceptDraw STORE.

Example 2. Electrical Schematics - Amplifier
To make the Electrical Schematics from the beginning in new ConceptDraw document, use the predesigned electrical schematic symbols offered in quantity by 26 libraries of Electrical Engineering Solution. 926 ready-to-use vector elements are more than enough for drawing any Electrical Schematic you want.

Example 3. Electrical Schematics - Lamp
The electrical schematics you see on this page were created in ConceptDraw DIAGRAM software using the Electrical Engineering Solution. These samples successfully demonstrate solution's capabilities and professional results you can achieve. An experienced user spent 10-15 minutes creating each of them.
Use the Electrical Engineering Solution for ConceptDraw DIAGRAM software to create your own electrical schematics and diagrams of any complexity fast and easy, and then successfully use them in your work activity.
All source documents are vector graphic documents. They are available for reviewing, modifying, or converting to a variety of formats (PDF file, MS PowerPoint, MS Visio, and many other graphic formats) from the ConceptDraw STORE. The Electrical Engineering Solution is available for all ConceptDraw DIAGRAM or later users.
TEN RELATED HOW TO's:
A network diagram represents the set of computers and network devices and the connections among them. This scheme can be developed for any institution or establishment. To illustrate this concept let’s take for example, a hotel network topology diagram or a school network diagram. These diagrams depict access points, servers, workstations, firewalls and another equipment needed to provide a network.
On this masterpiece drawing one will see a simple scheme a of connecting computers together. Such form of connecting can be applied for a hotel, guest house, bungalow, hut or something else. This diagram shows the images of the real LAN components. So, it represents a physical category of a network construction. It looks similar to a star - so this network configuration is named a star topology. The typical feature of this construction is a center point - usually it is hub, or router. The rays of this star means network connections. Computers, peripherals and other network details are placed on the ends of the star rays.
Picture: Hotel Network Topology Diagram
Related Solution:
Sometimes, when it is difficult to create a functional space plan or to rearrange existing one, the art of interior design comes in. It doesn't matter, if you need a cozy bedroom or an office layout plan, you should use appropriate tools to make your design great.
While making a floor plan of a new office it could be useful to apply some design elements such as furniture and office equipment. This diagram presents an office furniture objects that can be used for office interior design planning, or making office furniture and equipment layouts. This vector stencils library is supplied with ConceptDraw Office Layout Plans solution. It contains more then 30 vector objects of office interior for making office floor plans including an office space layout plans and furniture arrangement.
Picture: Interior Design. Office Layout Plan Design Element
Related Solution:
Designing of food images, fruit art illustrations, pictures of vegetables, and many other food and cafe related images and infographics has never been easier than it is now with ConceptDraw DIAGRAM software.
ConceptDraw DIAGRAM diagramming and vector drawing software extended with Food Court solution from the Food and Beverage area of ConceptDraw Solution Park is perfect food pictures design software.
Picture: Pictures of Vegetables
Related Solution:
The ConceptDraw Flowchart component includes a set of samples and templates. This geathered as flowchart maker toolbox which focused on drawing flowcharts of any industry standards.
Picture: Flowchart Components
Related Solution:
ConceptDraw DIAGRAM provides the Plant Layout Plans solution from the Building Plans Area of ConceptDraw Solution Park to develop: Plant layouts for production, Storage, Distribution, Transport, Shipping, Receiving of manufactured goods.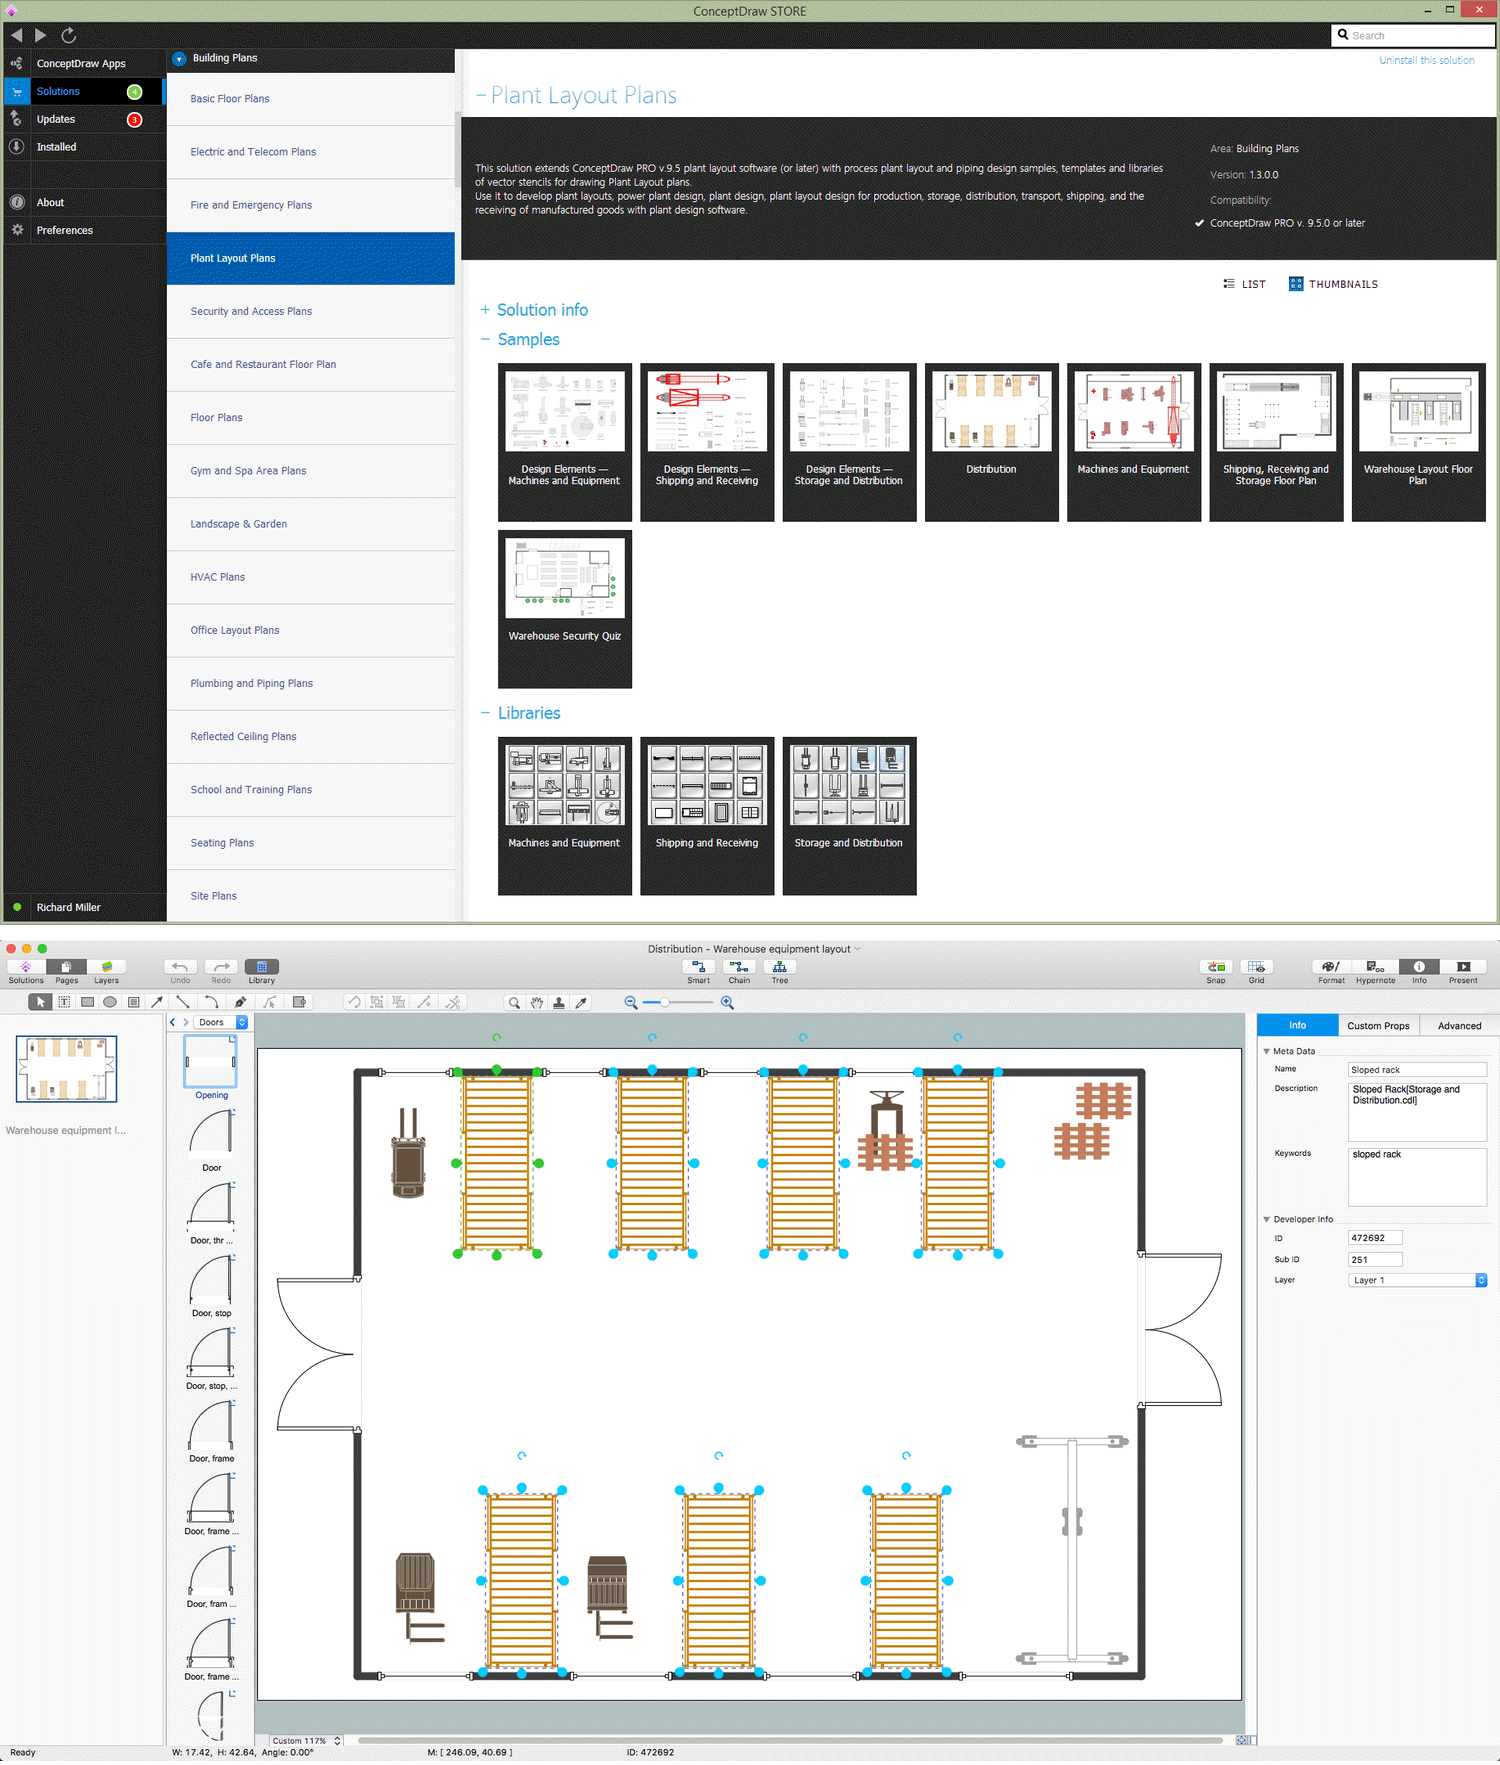
Picture: Storage Design Software
Related Solution:
Designing Spa Floor Plan? What can be easier for ConceptDraw DIAGRAM users? Use the tools of Gym and Spa Area Plans solution from Building Plans area of ConceptDraw Solution Park to depict any of your ideas for the Spa Floor Plan.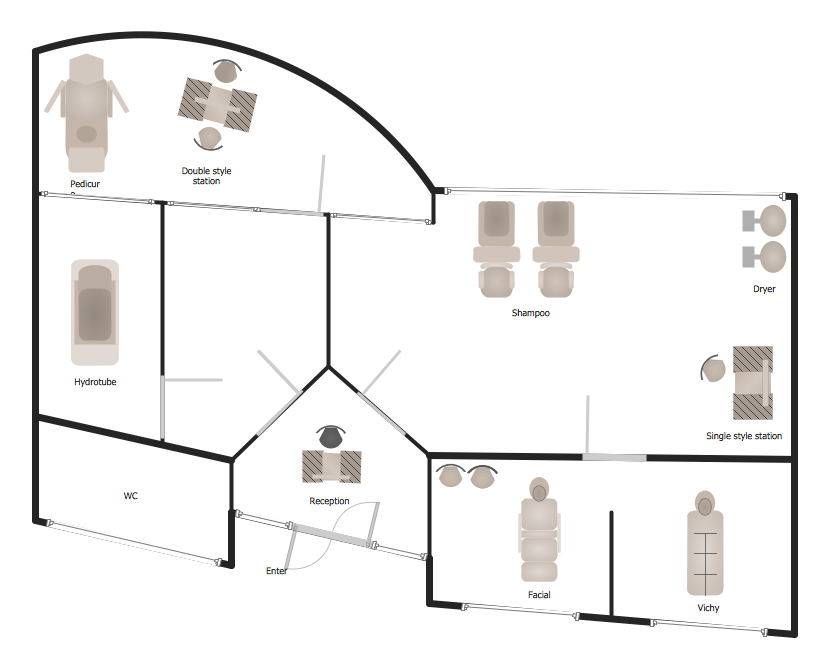
Picture: Spa Floor Plan
Related Solution:
The Audio & Video Connectors solution contains a set of pre-designed objects, libraries, templates, and samples; allowing quick and easy diagramming of various configurations of audio and video devices.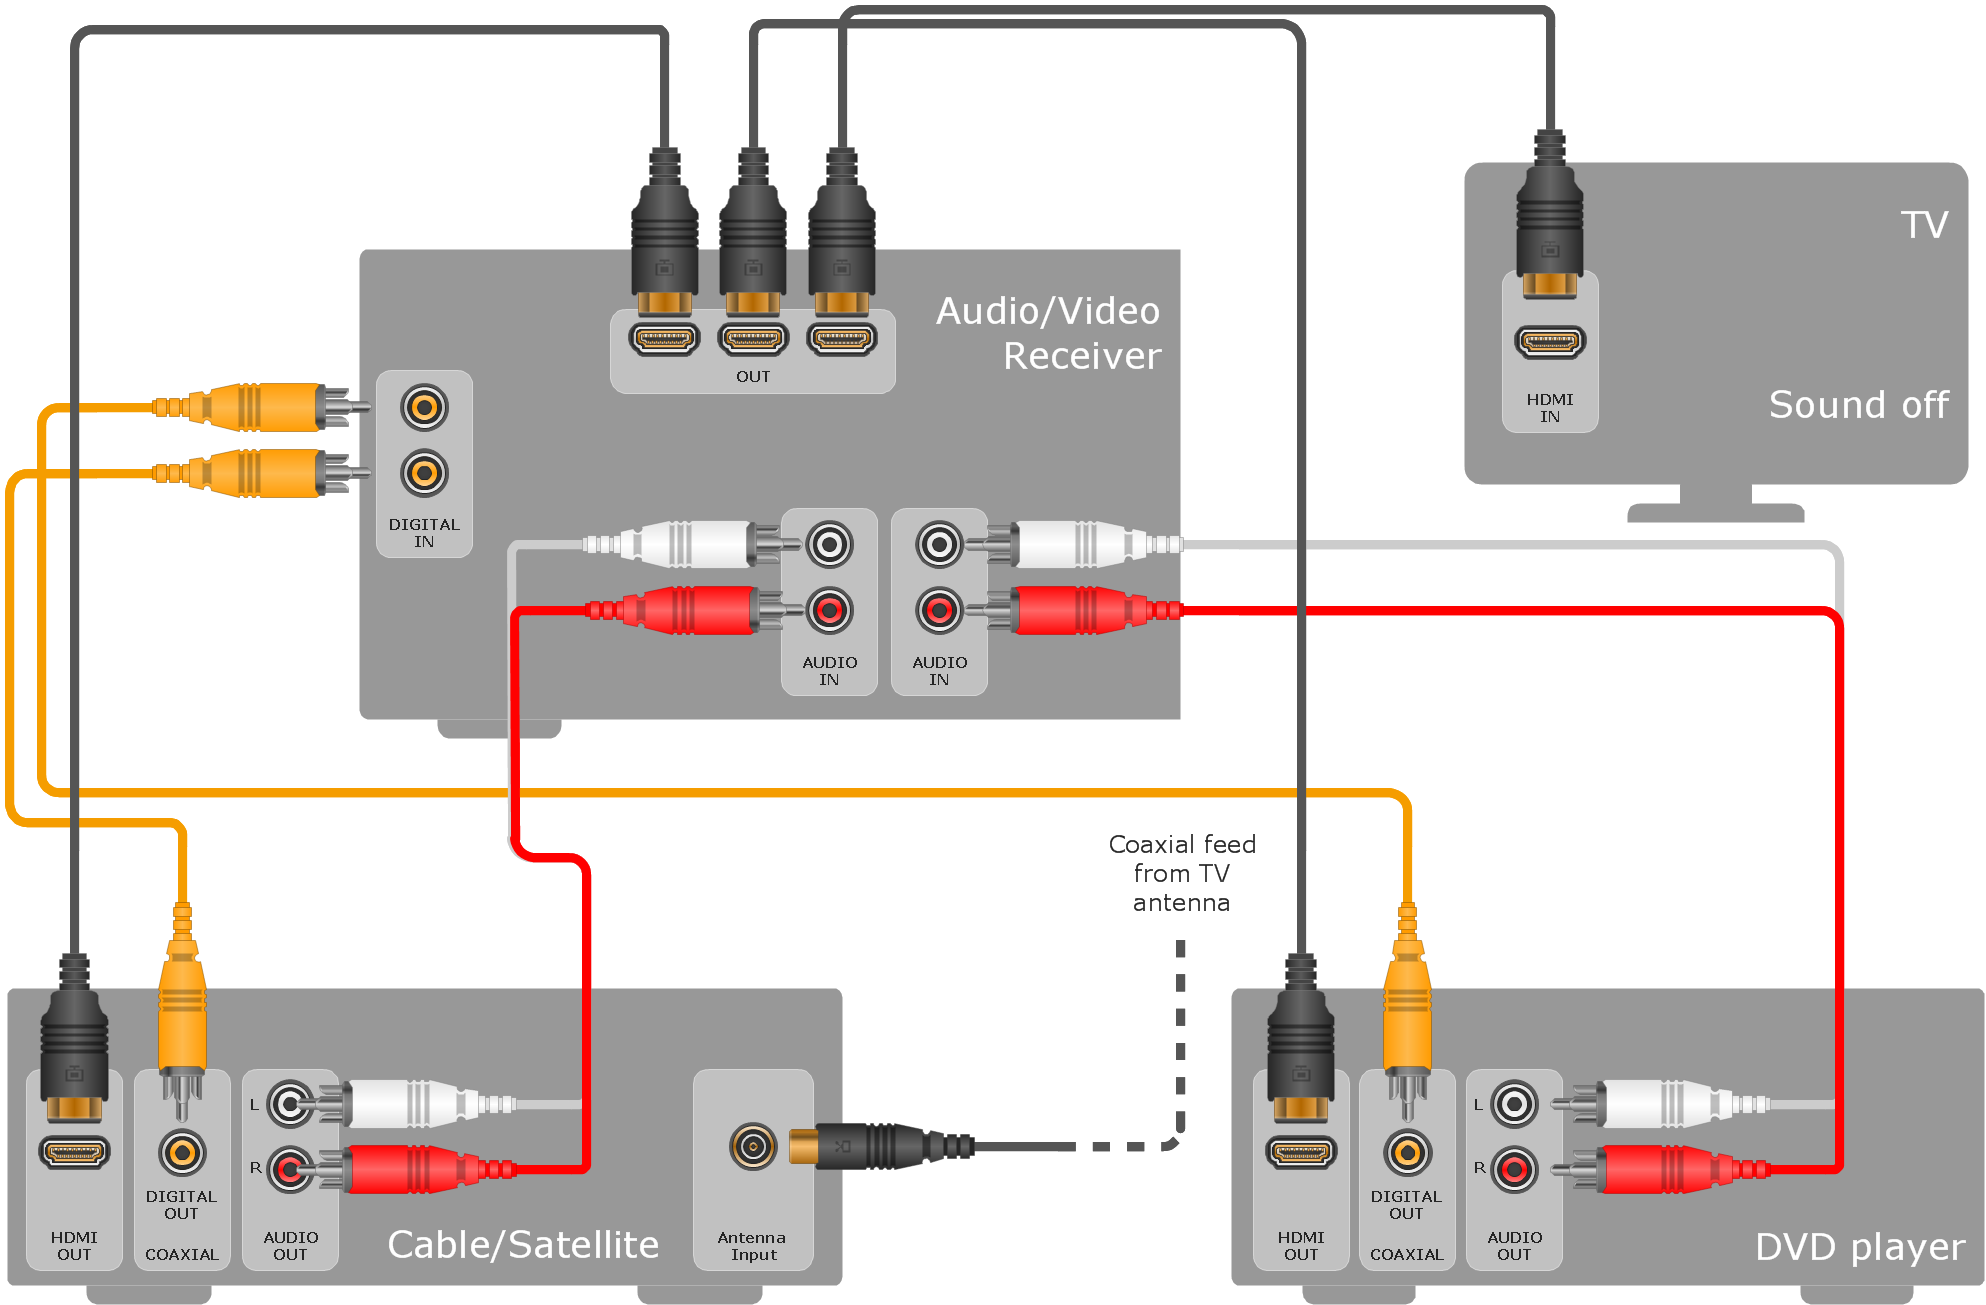
Picture: Audio & Video Connections
Related Solution:
Semiconductors are crystalline or amorphous solids with distinct electrical characteristics. They are of high resistance — higher than typical resistance materials, but still of much lower resistance than insulators. Their resistance decreases as their temperature increases, which is behavior opposite to that of a metal. Finally, their conducting properties may be altered in useful ways by the deliberate, controlled introduction of impurities into the crystal structure, which lowers its resistance but also permits the creation of semiconductor junctions between differently-doped regions of the extrinsic semiconductor crystal. The behavior of charge carriers which include electrons, ions and electron holes at these junctions is the basis of diodes, transistors and all modern electronics.
26 libraries of the Electrical Engineering Solution of ConceptDraw DIAGRAM make your electrical diagramming simple, efficient, and effective. You can simply and quickly drop the ready-to-use objects from libraries into your document to create the electrical diagram.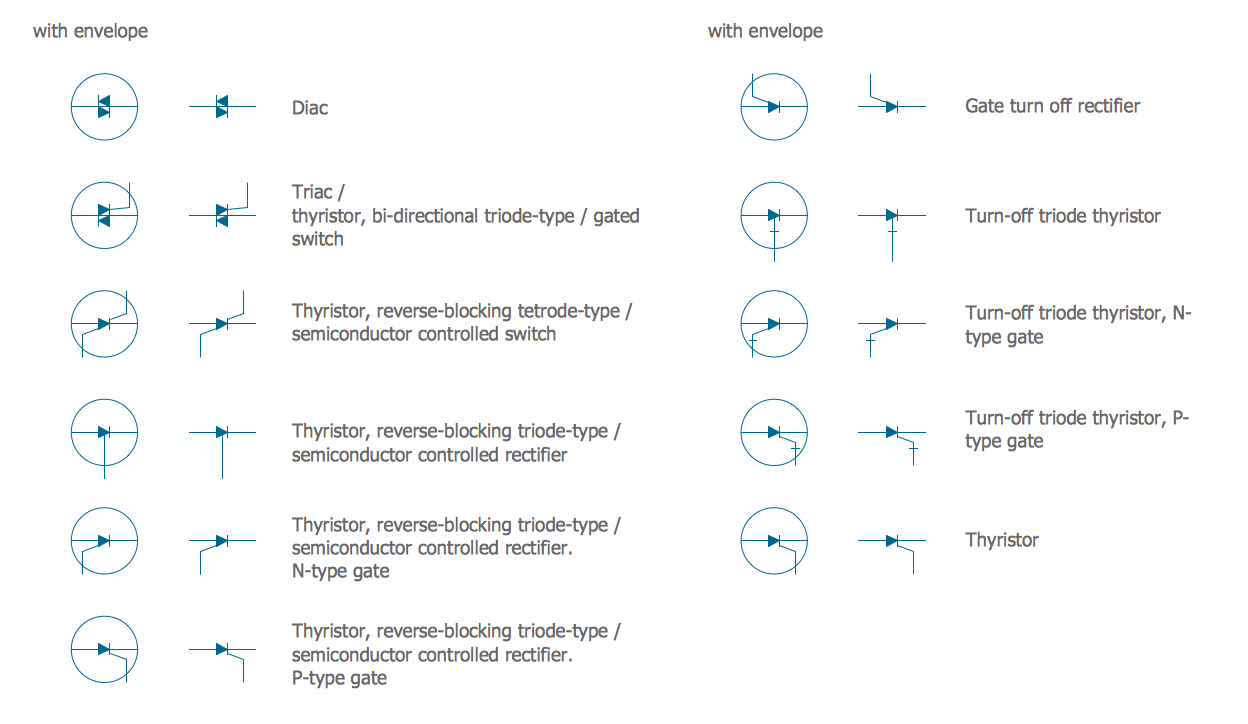
Picture: Electrical Symbols — Semiconductor
Related Solution:
To design line and scatter charts use ConceptDraw DIAGRAM diagramming and vector drawing software extended with Line Graphs solution from Graphs and Charts area of ConceptDraw DIAGRAM Solution Park. (Line chart, scatter chart, 2d chart).
Picture: Line Graph Charting Software
Related Solution:
Communication via Internet nowadays is almost irreplaceable part of lifestyle. It’s needless to say that providing that communication is not a piece of cake, and network diagram software is useful for representing all the interconnections between network devices. These diagrams are also helpful for educational purposes.
This drawing depicts the network topology of the sample web studio. This is a physical type of network diagram. It is depicting the network, end-user equipment and connections between them. The given network has combined the both star and mesh network topology features. This diagram is a tool of network administrator. it delivers the actual information on location of servers, hubs, switches, routers, and other telecommunication equipment. The collection of network related symbols provided with ConceptDraw Network Diagrams solution represents the entire network components. All Symbols are standard. Therefore, network specialists can effortlessly decrypt this diagram.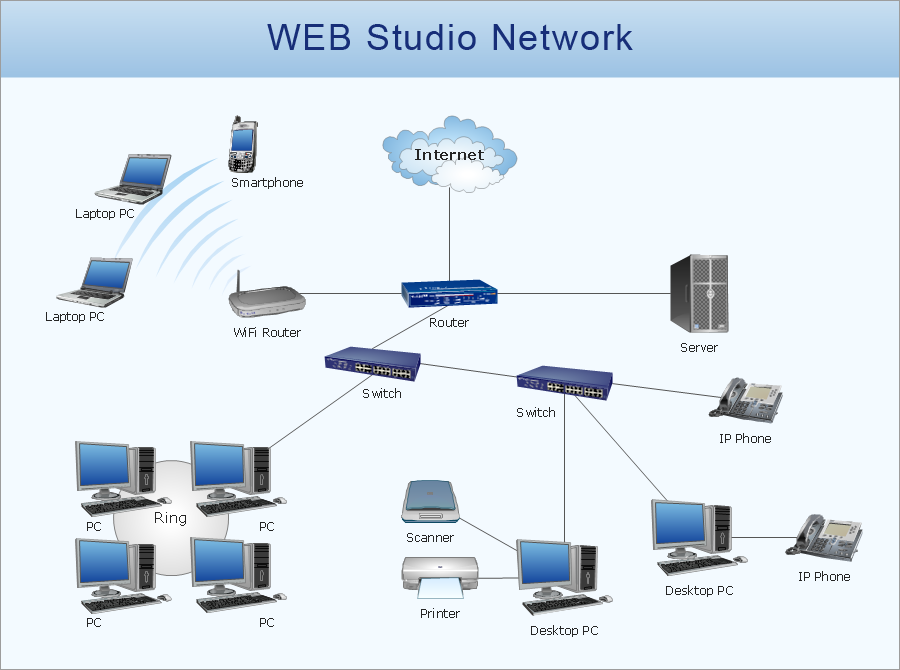
Picture: Network Diagram Software
Related Solution:

