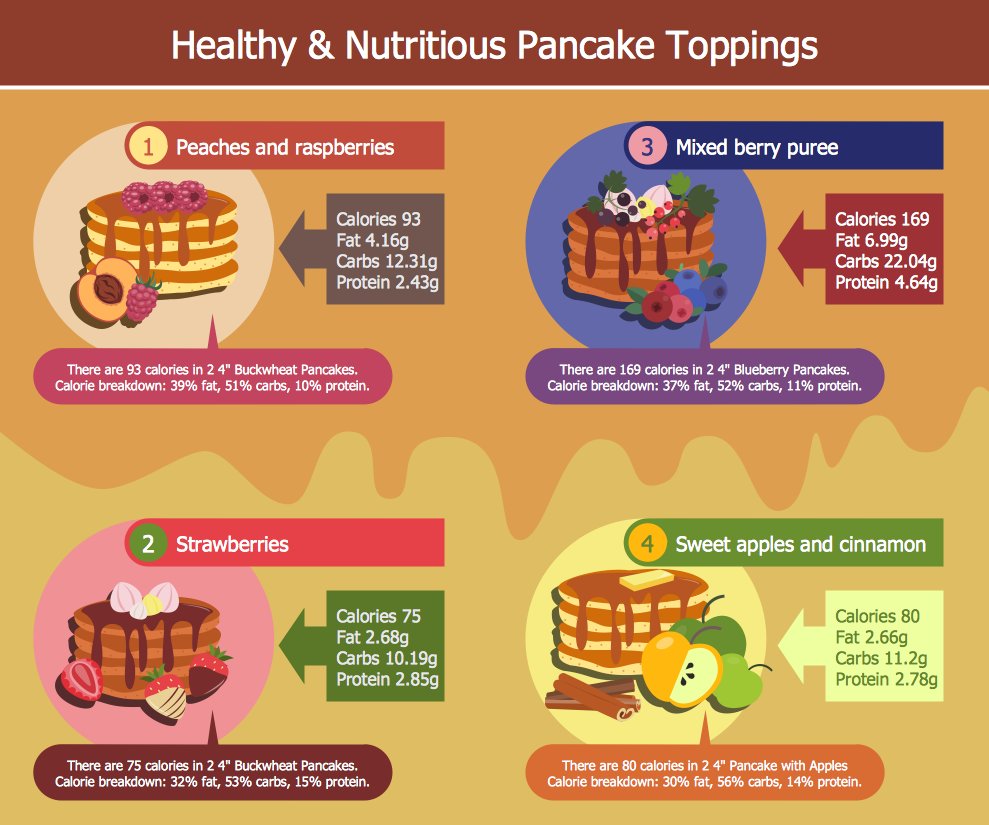
Example 1. Food and Beverage - Healthy and Nutritious Pancake Toppings
Food Court Solution for ConceptDraw DIAGRAM offers you collection of different kinds of predesigned food court examples, food and beverage samples, and 7 libraries with 201 vector objects and clipart to help you draw any F&B illustrations which you want, and of any complexity. You can also use clipart from other libraries of ConceptDraw DIAGRAM solutions to make your drawings yet more attractive and bright.

Example 2. Food and Beverage - Outdoor Party Food Court Area
All samples offered by Food Court solution are available from ConceptDraw STORE, you can open any of them and change something as needed, and thus get already other illustration – your own new pictorial food drawing.

Example 3. Food and Beverage - Fast Food Menu
The food and beverage illustrations you see on this page were created in ConceptDraw DIAGRAM software using the tools of the Food Court Solution. An experienced user spent 10 minutes creating each of these samples.
Use Food Court Solution for ConceptDraw Solution Park for quick, easy and effective designing your own food and beverage drawings of any complexity .
All source documents are vector graphic documents. They are available for reviewing, modifying, or converting to a variety of formats (PDF file, MS PowerPoint, MS Visio, and many other graphic formats) from the ConceptDraw STORE. The Food Court Solution is available for all ConceptDraw DIAGRAM users.
EIGHT RELATED HOW TO's:
Designing landscapes nowadays doesn’t require any special skills. Therefore, it’s not rocket science how to use landscape design software and create detailed plans and projects. Special Landscape & Garden Solution from the Building Plans area of ConceptDraw Solution Park provides vivid ready-to-use vector objects of trees, bushes, fences, furniture etc.
Picture: How To use Landscape Design Software
Related Solution:
The food has great importance in human life, but it is very important that the food was tasty and salubrious. Preparing the food with help of different recipes from the fashion magazines, popular cookbooks, Internet cooking sites, we firstly pay attention to the recipe's design, how delicious and aesthetically the dish is presented on the picture.
Use the ConceptDraw DIAGRAM diagramming and vector drawing software extended with Cooking Recipes solution from the Food and Beverage area of ConceptDraw Solution Park for easy design colorful and eye-catching food recipes illustrations.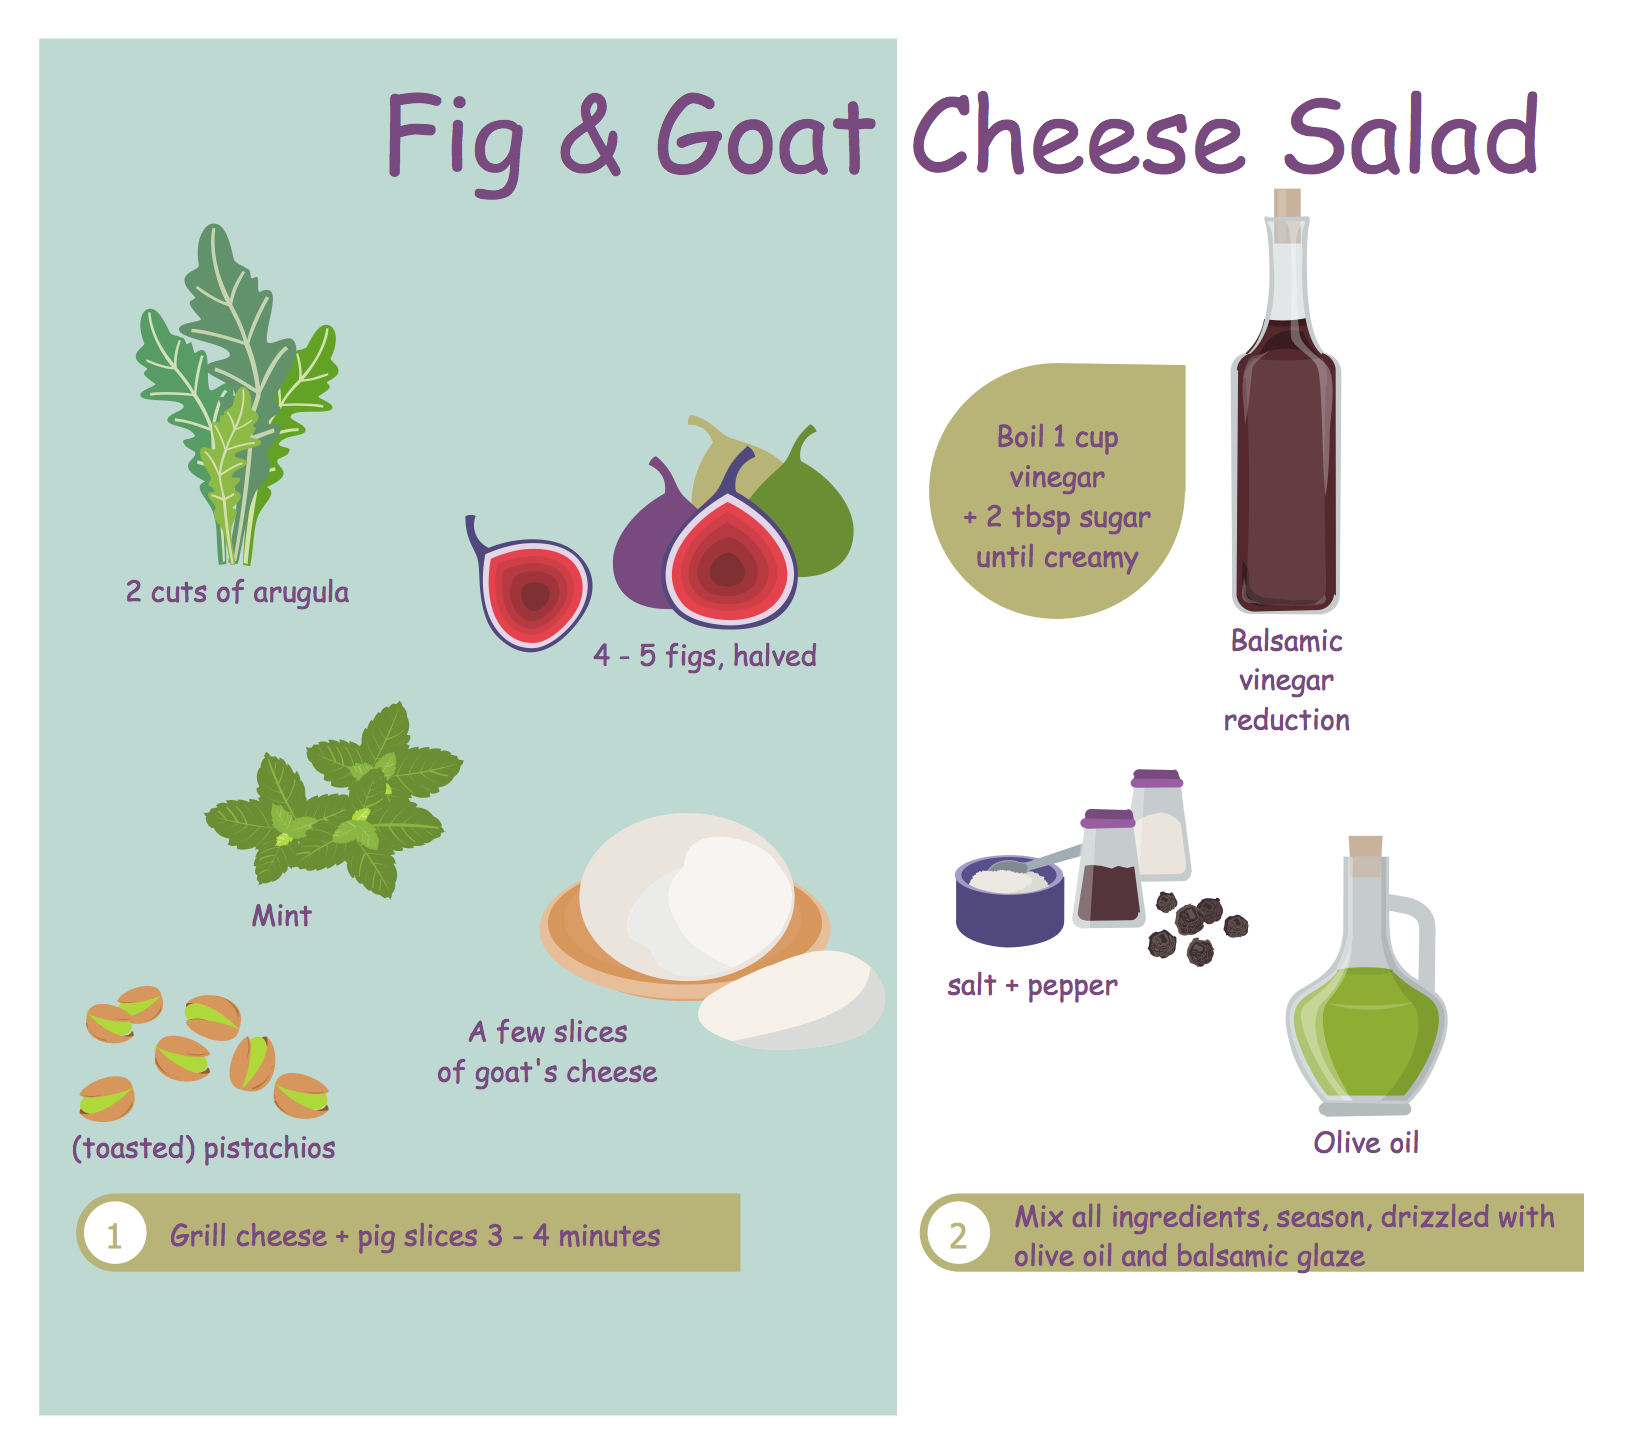
Picture: Food Recipes
Related Solution:
Nowadays, it's easy to create any drawing with appropriate software tools. Special Seating Plan solution from Building Plans area has all the design elements possible to create any seating plan that you might need. It might be a plan of a theater, or a cinema or even a wedding plan.
A seating plan is an indispensable element of any public event organization. Well thought-out arrangement of seats, furniture and other items help making the event a successful and effective. If you are organizing a spectacular event in a big theater or in a banquet hall, ConceptDraw Seating Plans solution is the tool for you. Especially its library of graphic elements for large and small blocks of seats, stairs, sectors, stage and backstage - just 67 vector objects. The Seating Plans Solution is specially developed for seating plans easy construction. With the help of this solution you'll quickly sketched the seating plan for any event
Picture: Building Drawing Software for Design Seating Plan
Related Solution:
ConceptDraw DIAGRAM is a drawings software for creating Nature scenes. Nature solution from ConceptDraw Solution Park expands this software with a new library that contains 17 vector objects and samples illustration files.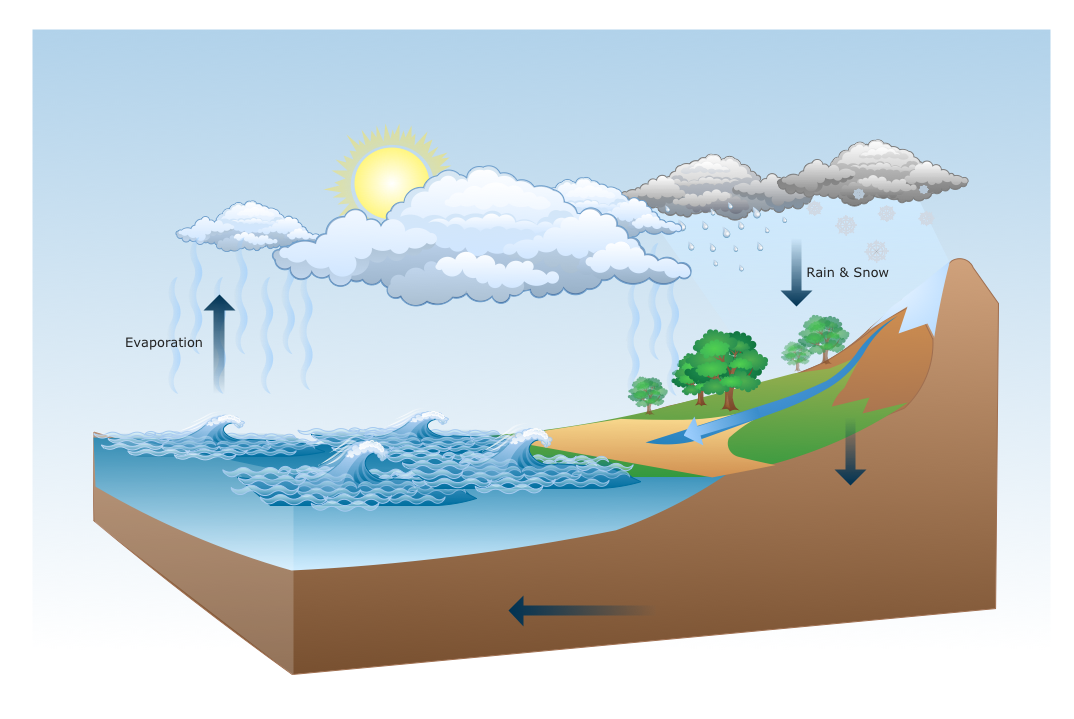
Picture: Drawing a Nature Scene
You want to decorate menu, design pictorial illustration for the cooking article in the fashionable magazine, create attractive posters for your cafe or restaurant, or develop beautiful advertising materials? In order to ideally cope with all these tasks, use the easy recipes design software - ConceptDraw DIAGRAM extended with Cooking Recipes solution from the Food and Beverage area of ConceptDraw Solution Park.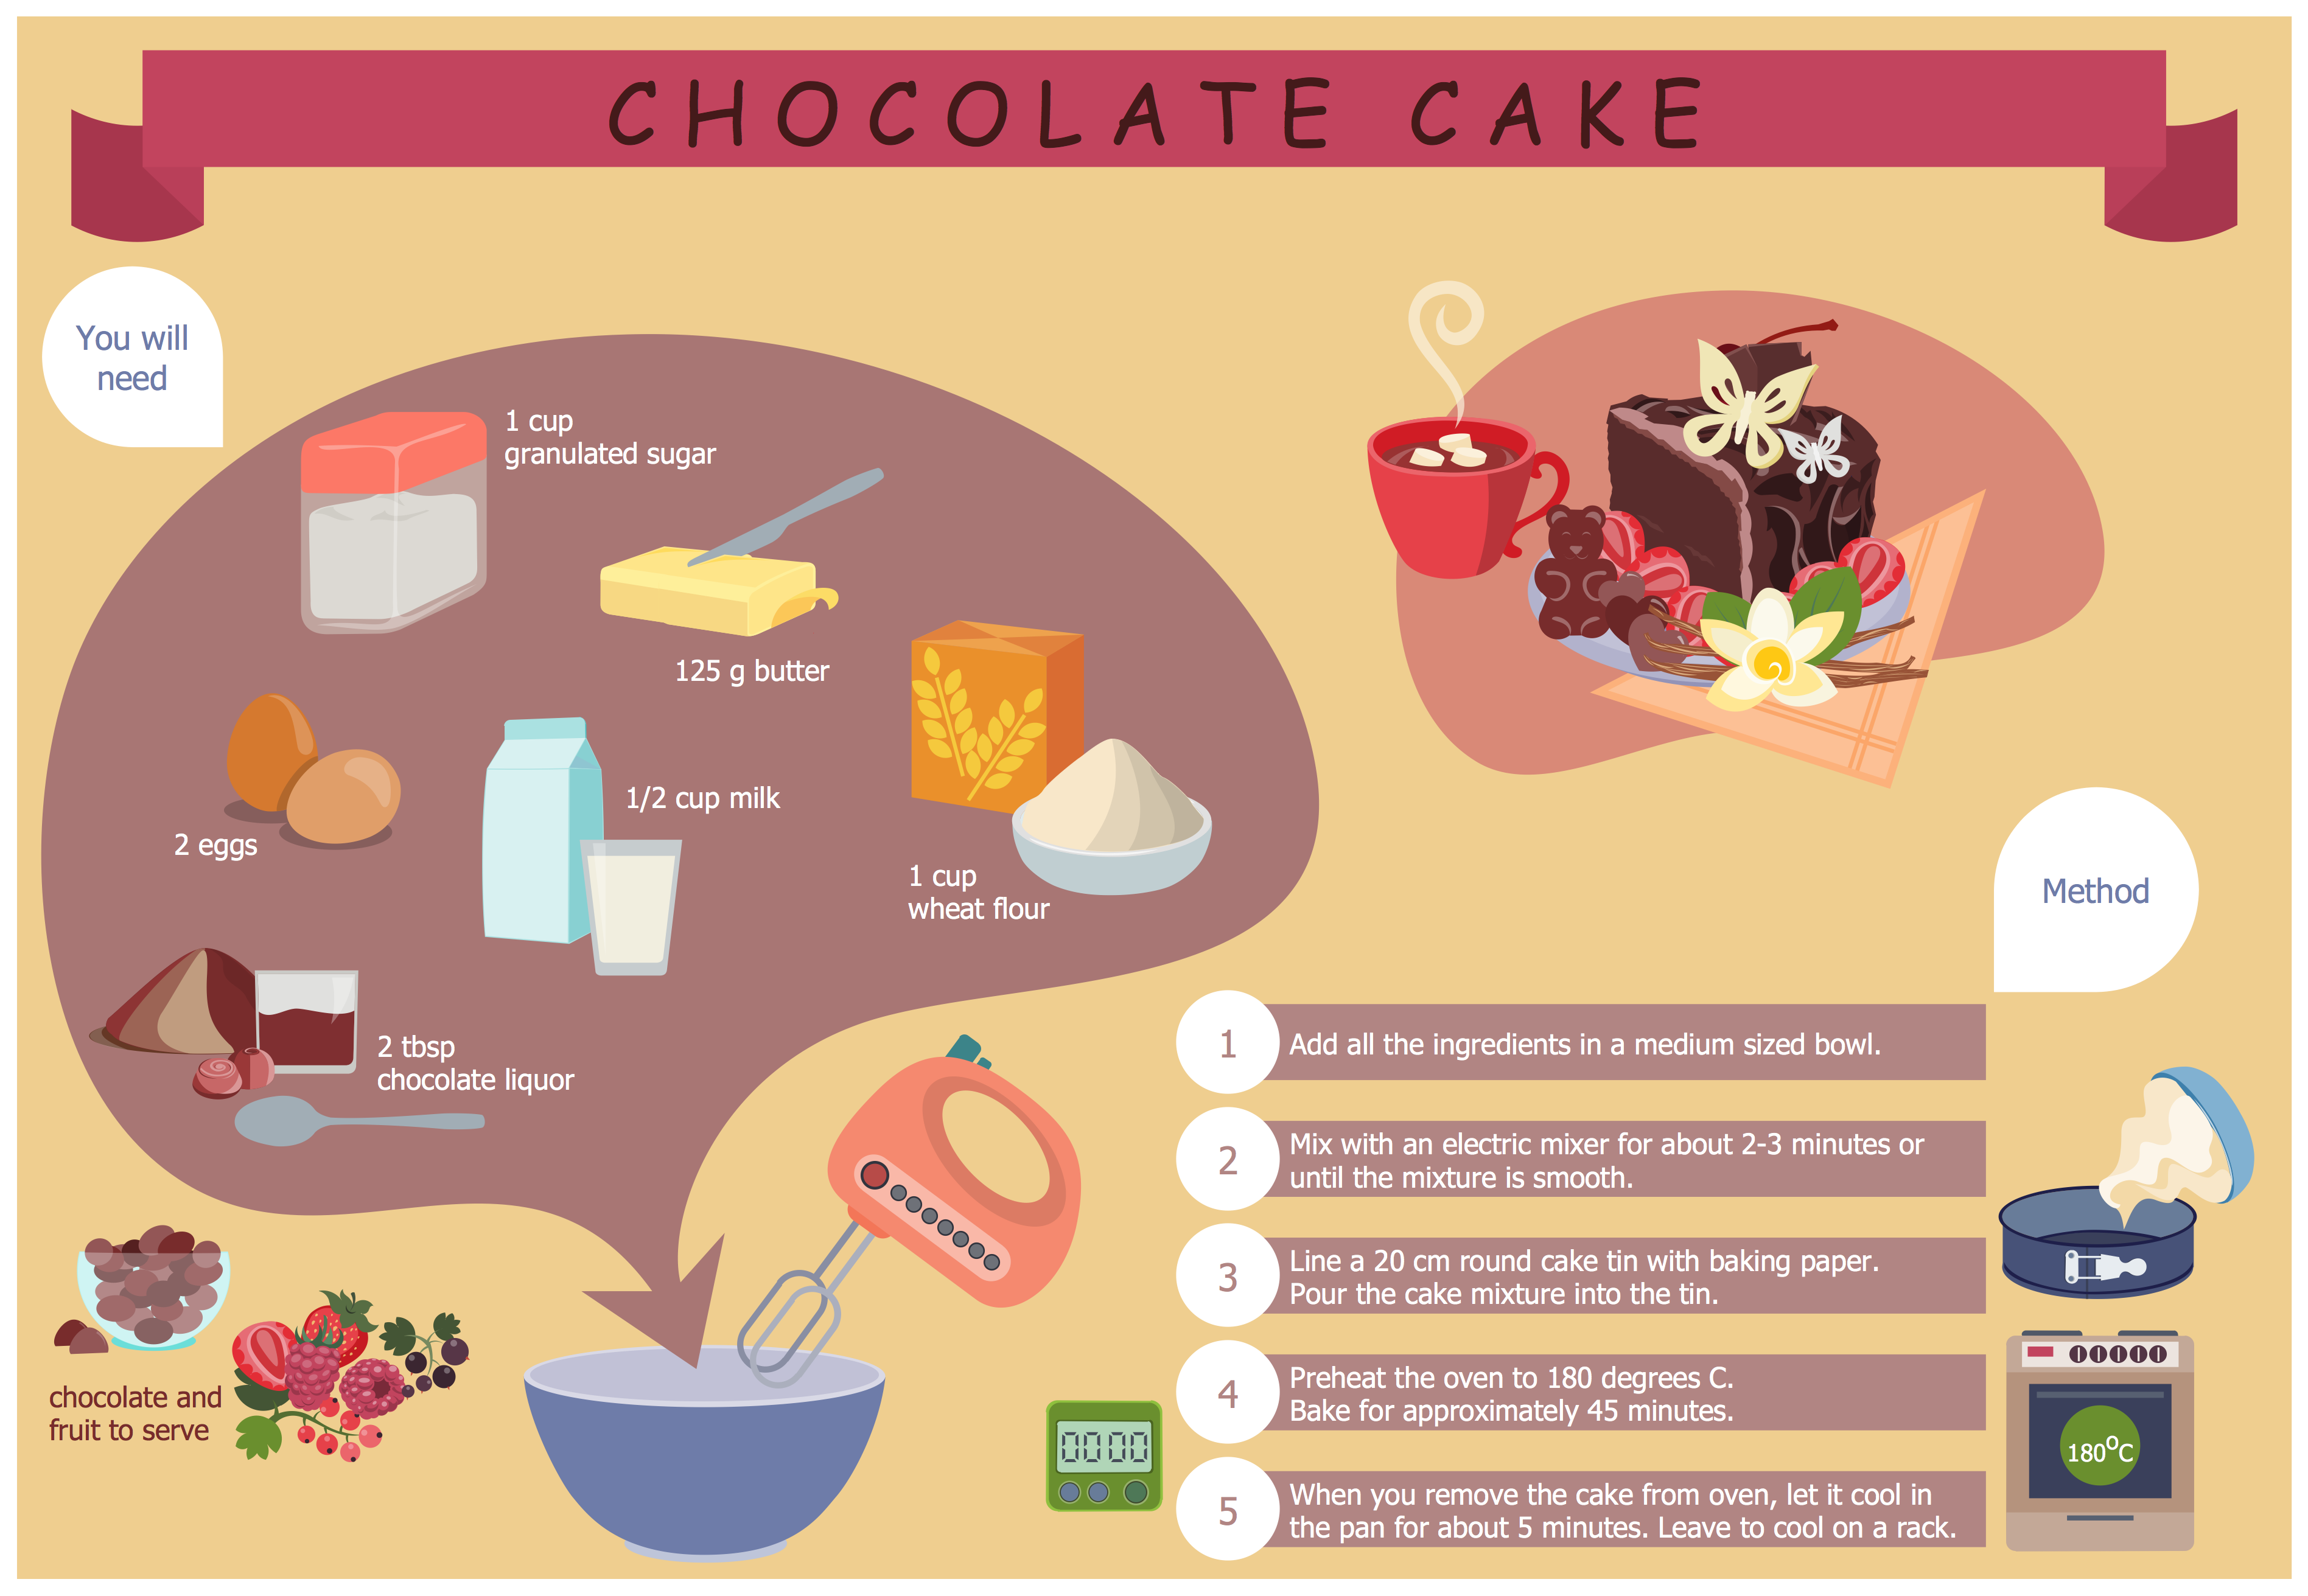
Picture: Easy Recipes
Related Solution:
There are many ways to describe a database structure. One of the most usual is to draw an entity relationship diagram (ERD) using a Crow’s Foot notation to represent database elements. If you don’t want to draw it on paper, you should use an appropriate software.
An entity-relationship (ER) diagram is used to show the structure of a business database. ERD represents data as objects (entities) that are connected with standard relationships symbols which Illustrate an association between entities. ERD, there is a wide range of ERD notations used by data bases architects for reflecting the relationships between the data entities. According to the crow’s foot notation relationships are drawn as single labeled lines designating a certain kinds of relationship. Crow foot notation is a most frequently used ERD standard, because of improved readability of diagrams, with a more accurate use of space on the page._Win_Mac.png)
Picture: Entity Relationship Diagram - ERD - Software for Design Crows Foot ER Diagrams
Related Solution:
A healthy lifestyle and a balanced healthy diet are the basis of health, longevity and good feeling. Every day a human must receive with a food the correct proportions of nutrients and vitamins. It is very important to make a proper menu that includes tasty and healthy dishes.
ConceptDraw DIAGRAM diagramming and vector drawing software enhanced with Health Food solution from the Food and Beverage area of ConceptDraw Solution Park will help you easy develop, depict and appetizingly illustrate your healthy food recipes.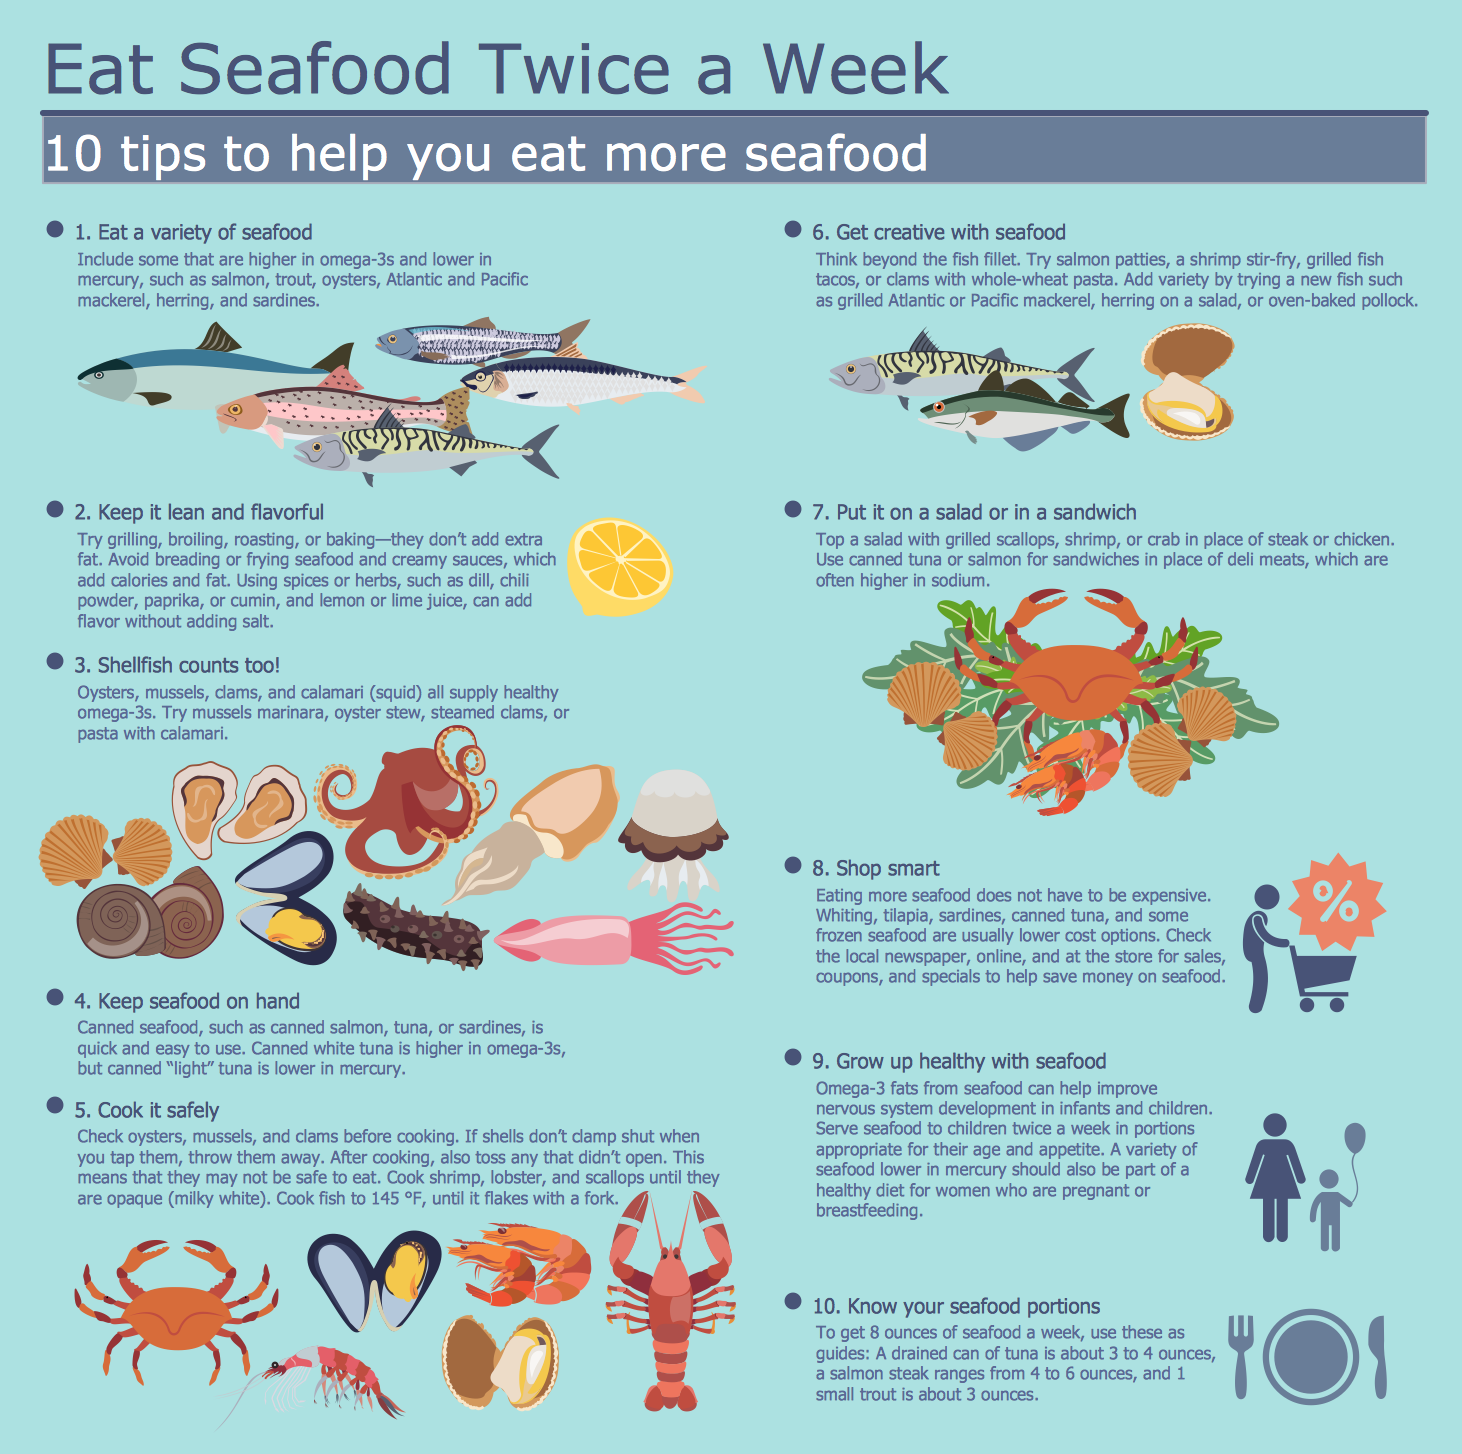
Picture: Healthy Food Recipes
Related Solution:
Chore chart. Draw perfect-looking chore chart. Free chore chart samples. All about chore charts.
Picture: Chore charts with ConceptDraw DIAGRAM

