This network diagram sample is created using ConceptDraw DIAGRAM diagramming and vector drawing software enhanced with Computer & Networks solution from ConceptDraw Solution Park.
Computer & Networks solution provides the symbol libraries with pre-designed network graphic elements.
Use Computer & Networks solution to draw the network diagrams for bandwidth management for Cisco networks, Apple networks, IVR networks, GPRS networks, wi-fi networks, LAN and WAN.
TEN RELATED HOW TO's:
What is a computer network? This is a set of devices and systems that are connected to each other (logically or physically) and communicate with each other. This could include servers, computers, phones, routers, and so on. The size of this network can reach the size of the Internet, and can consist of only two devices connected by a cable.
This sample shows the connection scheme of the home WLAN equipment to the Internet.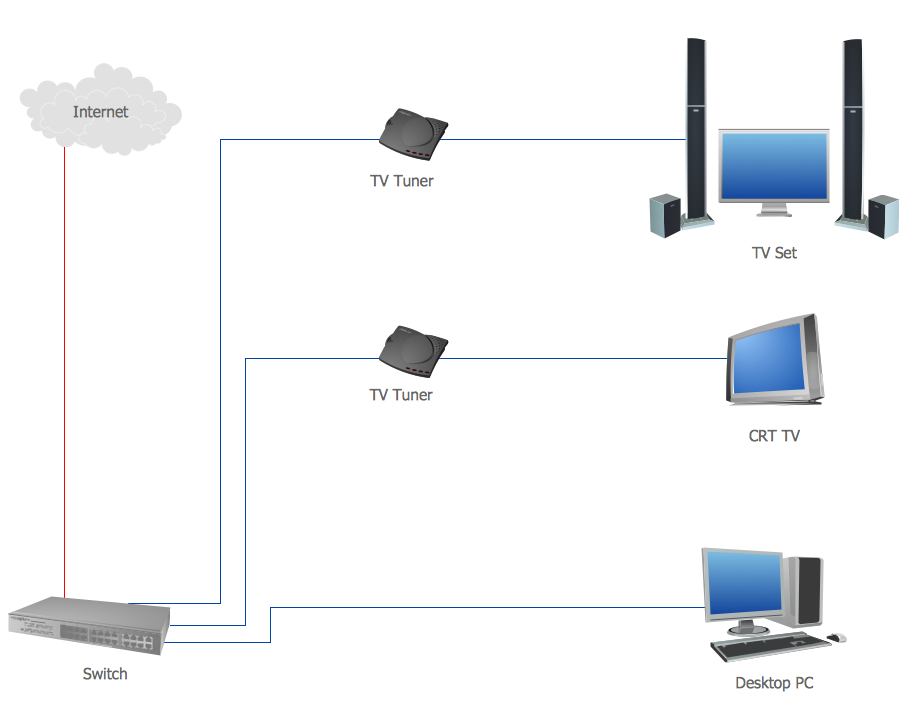
Picture: Diagram of a Basic Computer Network. Computer Network Diagram Example
Related Solution:
ConceptDraw Network Diagram Software - Network design software for network drawings with abundant examples and templates.
Create computer network designs, diagrams and schematics using ConceptDraw.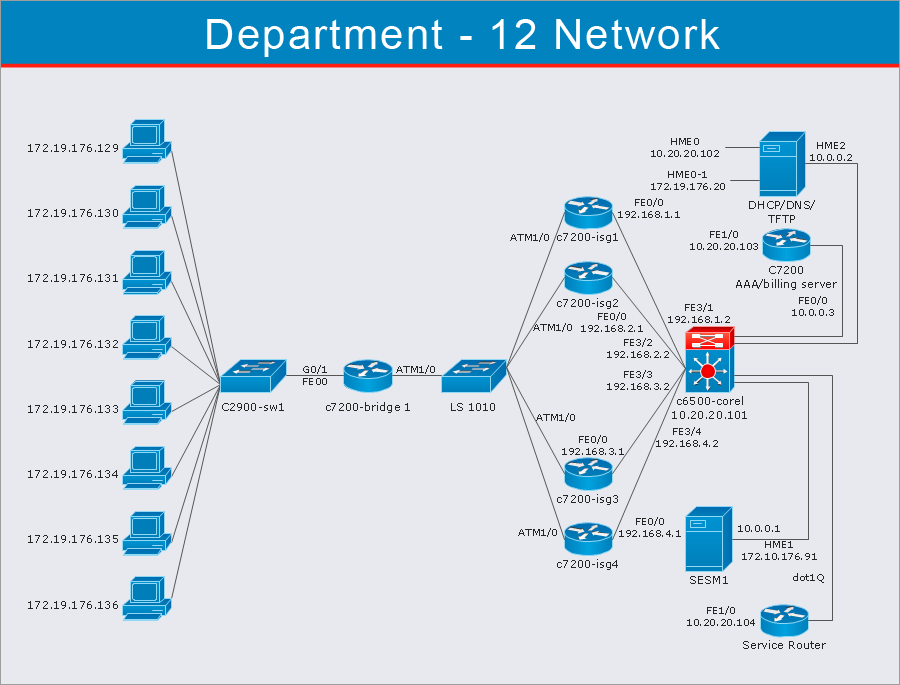
Picture: Network Diagram Software
This template was created in ConceptDraw DIAGRAM diagramming and vector drawing software using the Block Diagrams Solution from the “Diagrams” area of ConceptDraw Solution Park.
This template shows the Product Proposal Diagram on that is displayed the sequence of the product planning steps. This diagram is convenient, visual and clear.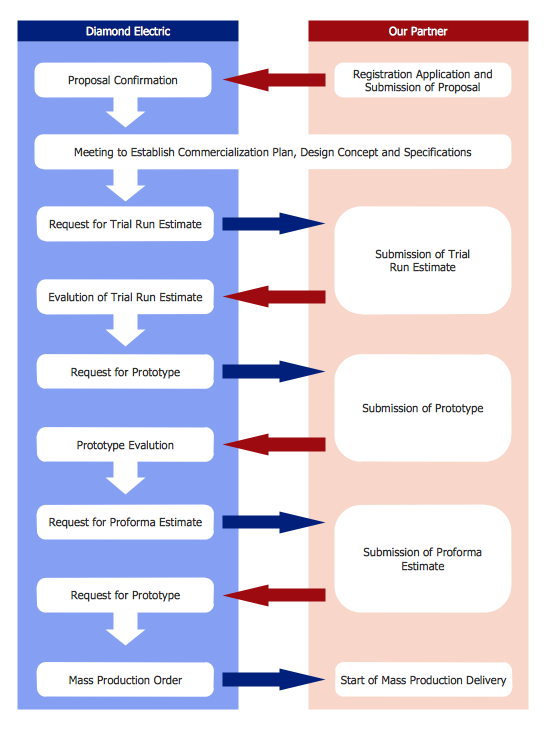
Picture: Product Proposal Template
Related Solution:
It’s a challenge for any administer to set a brand new corporate network. Talking about network parameters, we should mention that network layout is important for network efficiency and reliability. After the budget is accepted, you need to make a network topology draft.
The diagram of computer network layout is a tool of IT specialists and corresponding departments of diversified organizations. Also the responsibilities of any network or system administrator include making network layout diagrams, since they are important piece of any network documentation package. ConceptDraw solution for networking and diagramming offers more than 1000 vector object, composed into the 40 libraries that are designed to to getting started with making professional network layout diagrams.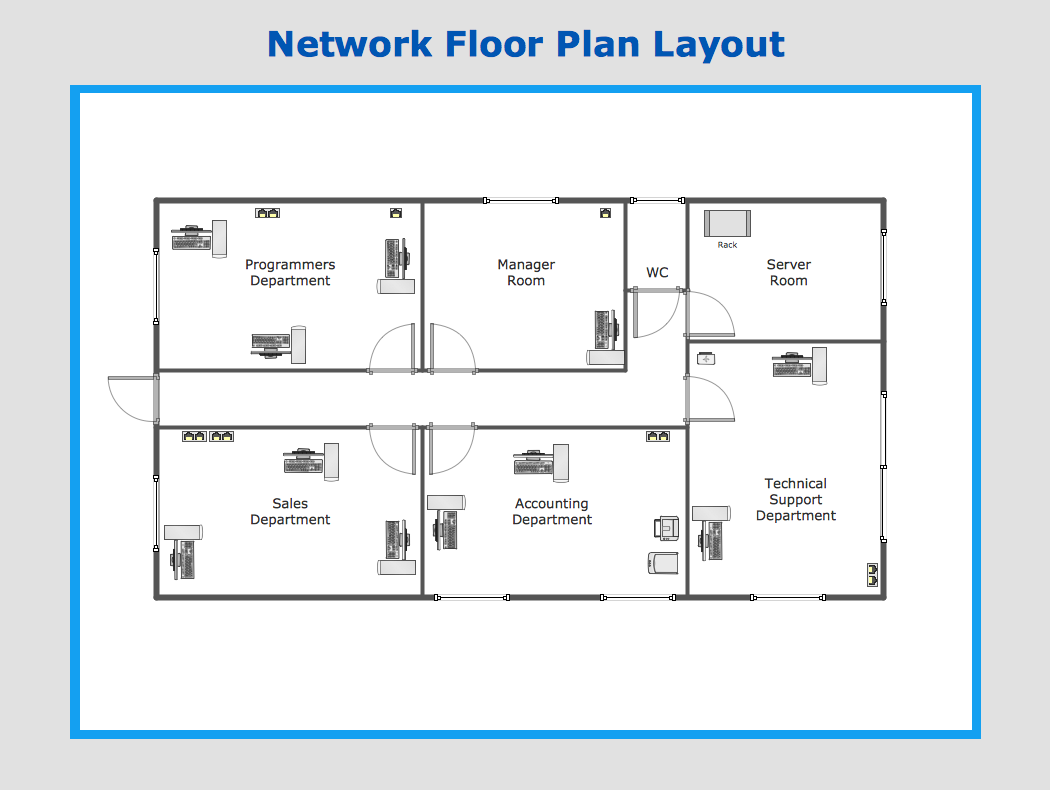
Picture: Network Layout
House of Quality Matrix Software - Use the predesigned objects from the Involvement Matrix Objects Library from the Seven Management and Planning Tools Solution to create professional looking House of Quality Matrices in minutes.
Picture: House of Quality Matrix Software
Related Solution:
To connect two or more network devices are used the network cables. There are more different types of the network cables: Coaxial cable, Optical fiber cable, Twisted Pair, Ethernet crossover cable, Power lines and others. They are used depending of the network topology, size, protocol.
This example was created in ConceptDraw DIAGRAM using the Computer and Networks solution from the Computer and Networks area of ConceptDraw Solution Park.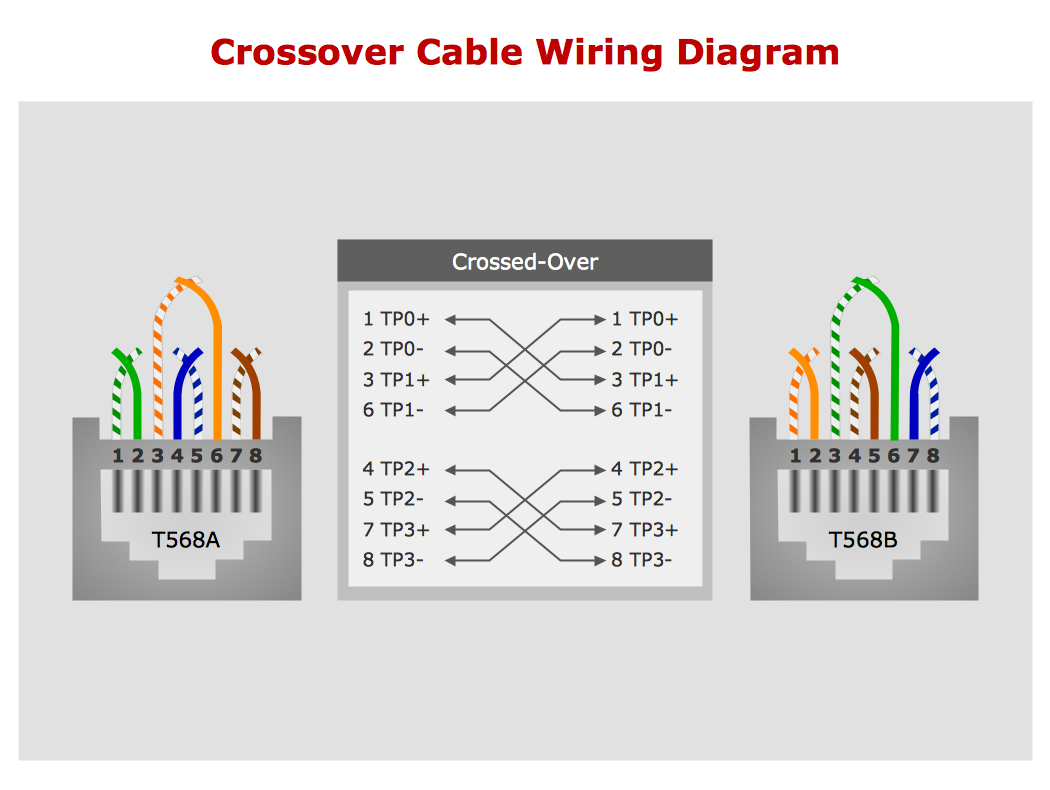
Picture: Network wiring cable. Computer and Network Examples
Related Solution:
UML Communication diagramming software with rich examples and template. ConceptDraw is ideal for software designers and software developers who need to draw UML Communication Diagrams.
Picture: Communication Diagram UML2.0 / Collaboration UML1.x
When studying computer science, it is important to have good training manuals. To understand how the networks and data links work, you will probably need a set of network diagram examples depicting all the possible interconnections between network devices. You can find them on Internet or try to create your own.
This example of a network topology diagram was made using ConceptDraw Computer and Network Diagrams solution. It represents a bus topology network diagram. A bus topology means that computers and peripherals in the network are connected to a mutual cable (backbone). This topology is often used for small networks. This diagram was designed using vector libraries of network equipment symbols. They also can be applied while creating various LAN and WAN diagrams.
Picture: Network Diagram Examples
Use ConceptDraw DIAGRAM enhanced with solutions from ConceptDraw Solution Park to create diagrams to present and explain structures, process flows, logical relationships and networks.
Picture: Cross-Functional Flowcharts in ConceptDraw
A network diagram is used to depict the topology of a computer network or, talking more broadly, any telecommunications network in general. In order for a computer network diagram to be understandable, clearly identifiable icons must be used for each network appliance. Cisco network templates, also called Network Topology Icons, is a brand of symbols developed and used by Cisco. Since Cisco Systems is the largest networking company in the world, it's list of networking symbols is widely recognized and exhaustive.
The diagram of the ISG network topology diagram illustrates the Cisco Intelligent Services Gateway. Since Cicso company offers service providers a possibility to provide control of state and resources in a broadband network, network architects and engineers need some facilities to create ISG topology diagrams.This Cisco ISG network diagram was created in ConceptDraw DIAGRAM using its solution for Cisco network diagrams. The vector library of this solution comprises over 500 icons of Cisco hardware and accessories. They can be used to design LAN, WAN, ISG and other Cisco equipped network diagrams.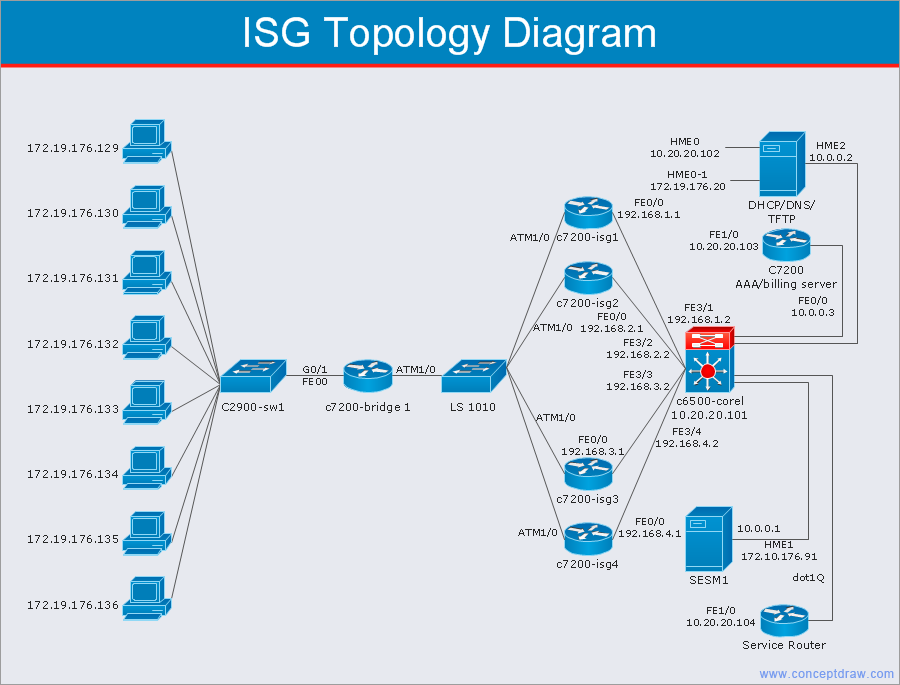
Picture: Cisco Network Templates
Related Solution: