How should diagramming software work? Is it possible to develop a diagram as quickly as the ideas come to you?
The innovative ConceptDraw Arrows10 Technology included in ConceptDraw DIAGRAM is a powerful drawing tool that changes the way diagrams are produced.
While making the drawing process easier and faster.
ConceptDraw DIAGRAM is a powerful tool that helps you create a process map diagram quickly and easily.
When the "tree" mode is switched on the next shape you add to your diagram is automatically connected to the initial shape. You can rapidly add shapes to your tree diagram by copying-and-pasting or using Ctrl+"drag-and-drop" combination.
Want to add the next level of shapes to your tree diagram. This easy to do by selecting a shape to make it the new initial shape for this level and continue adding shapes. The "tree" auto connection mode can help you easily create different types of structured diagrams; examples of these types of diagrams could be mind maps, organization charts, root cause diagrams, and more.
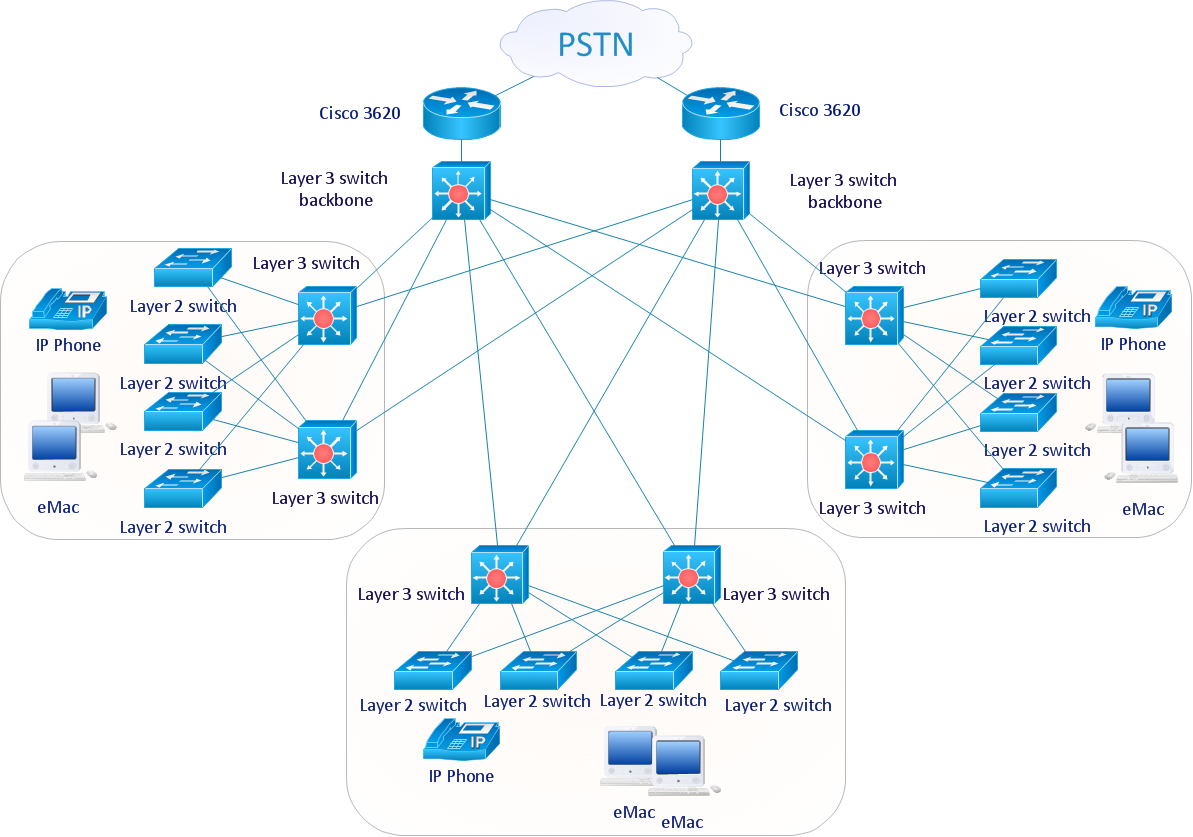
Sample 1. Cisco network diagram - LAN fault tolerance system.
ConceptDraw DIAGRAM diagramming software provides vector shapes and connector tools for quick and easy drawing diagrams for business, technology, science and education.
Use ConceptDraw DIAGRAM enhanced with solutions from ConceptDraw Solution Park to create diagrams to present and explain structures, process flows, logical relationships, networks, design schemes and other visually organized information and knowledge.
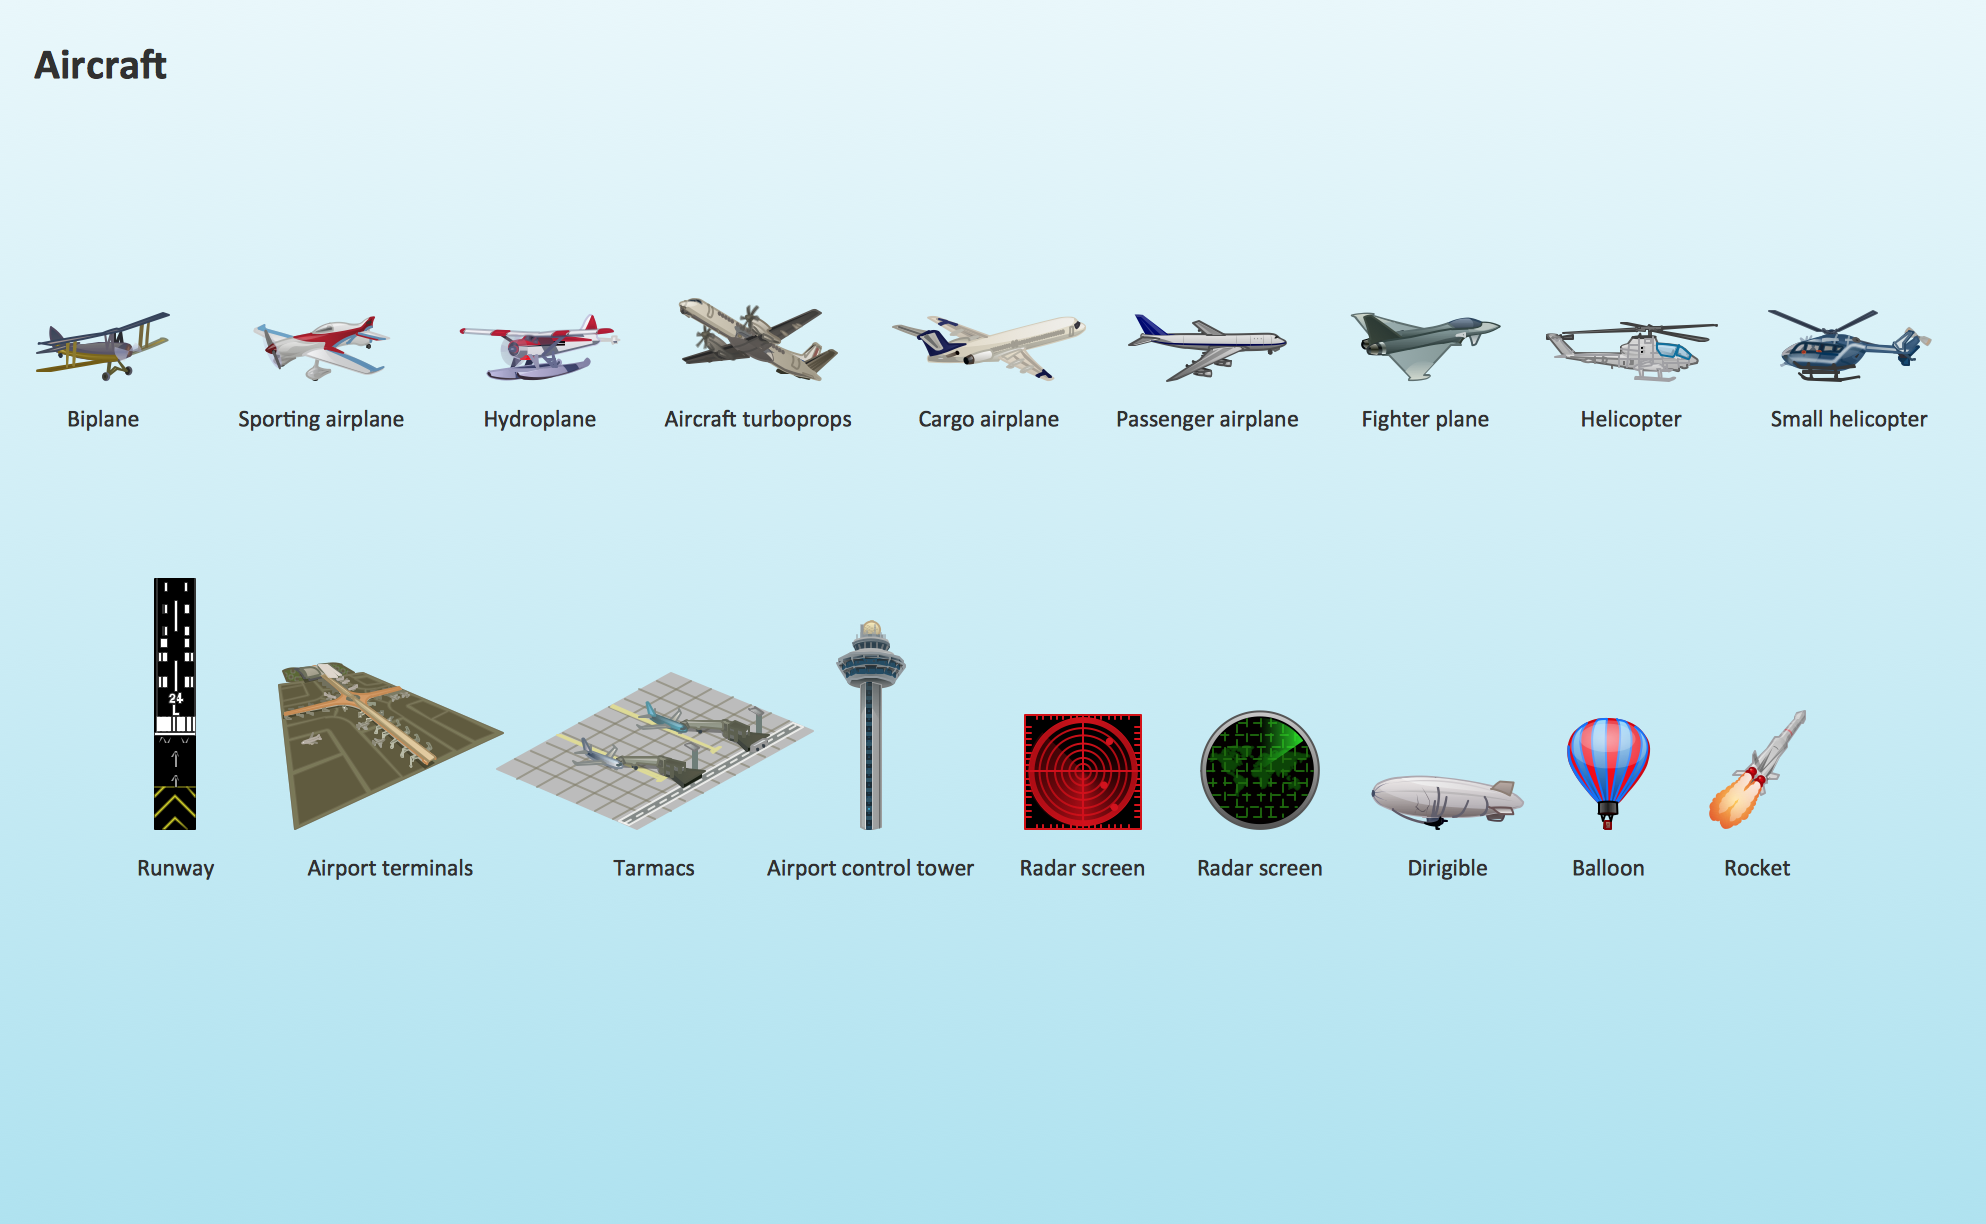
The vector stencils library Aircraft contains clipart of aerospace objects, transportation vehicles, office buildings, and ancillary facilities for ConceptDraw DIAGRAM diagramming and vector drawing software.
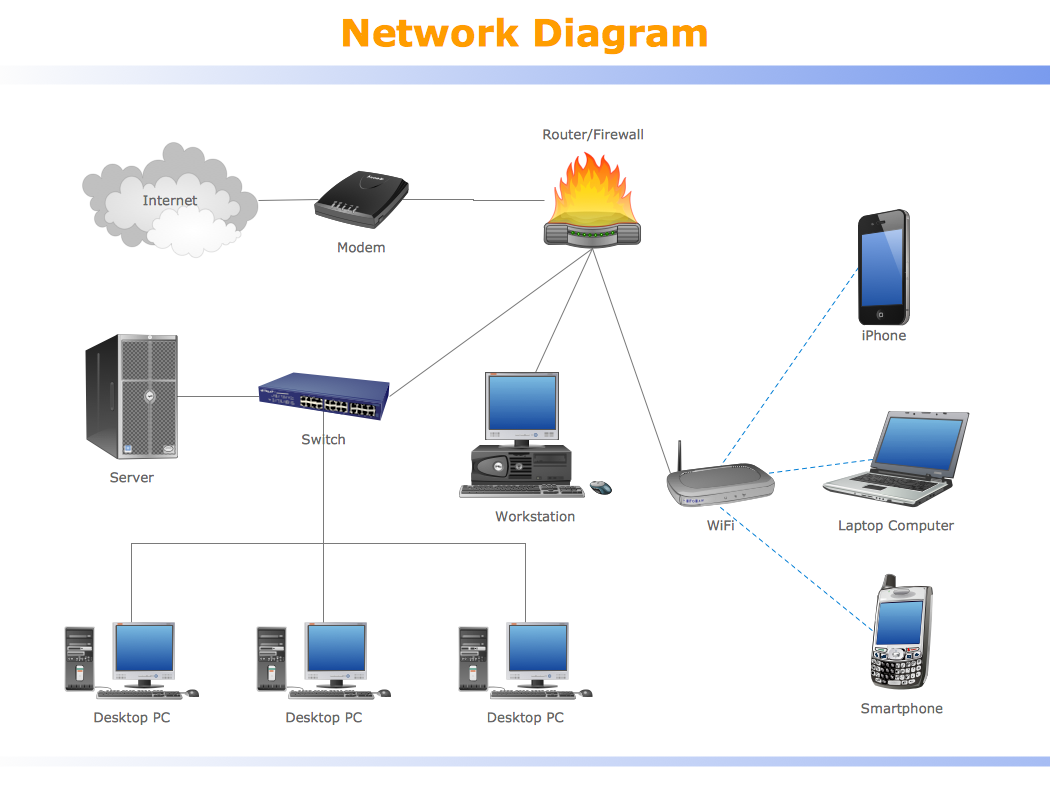
With best content of the Wireless Network solution that includes more than 10 building pre-designed objects network engineers can illustrate the computer network of a building.
Picture: Illustrate the Computer Network of a Building
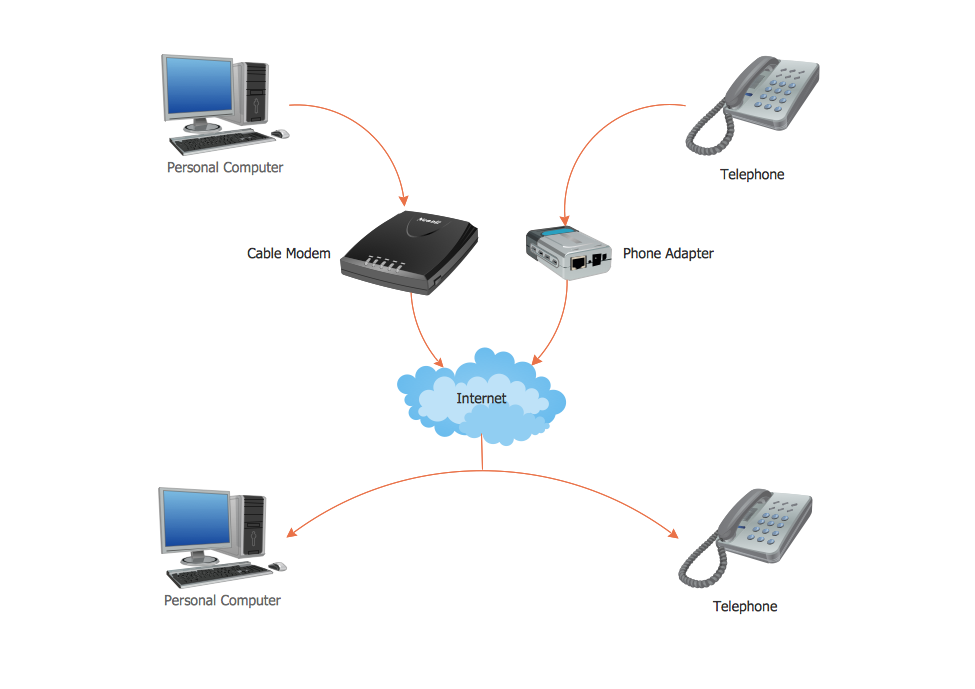
ConceptDraw DIAGRAM extended with Interactive Voice Response Diagrams Solution from the Computer and Networks Area Solution is the best software for VoIP diagrams creating. Make sure in it right now!
ConceptDraw solution Computer and Networks provides Interactive Voice Response samples, templates and library of 35 vector stencils for drawing the IVR network diagrams.
Use ConceptDraw DIAGRAM diagramming and vector drawing software enhanced with solution Computer and Networks to visualize the logical and physical structure of IVR systems for inbound and outbound call centers and voice mail systems.
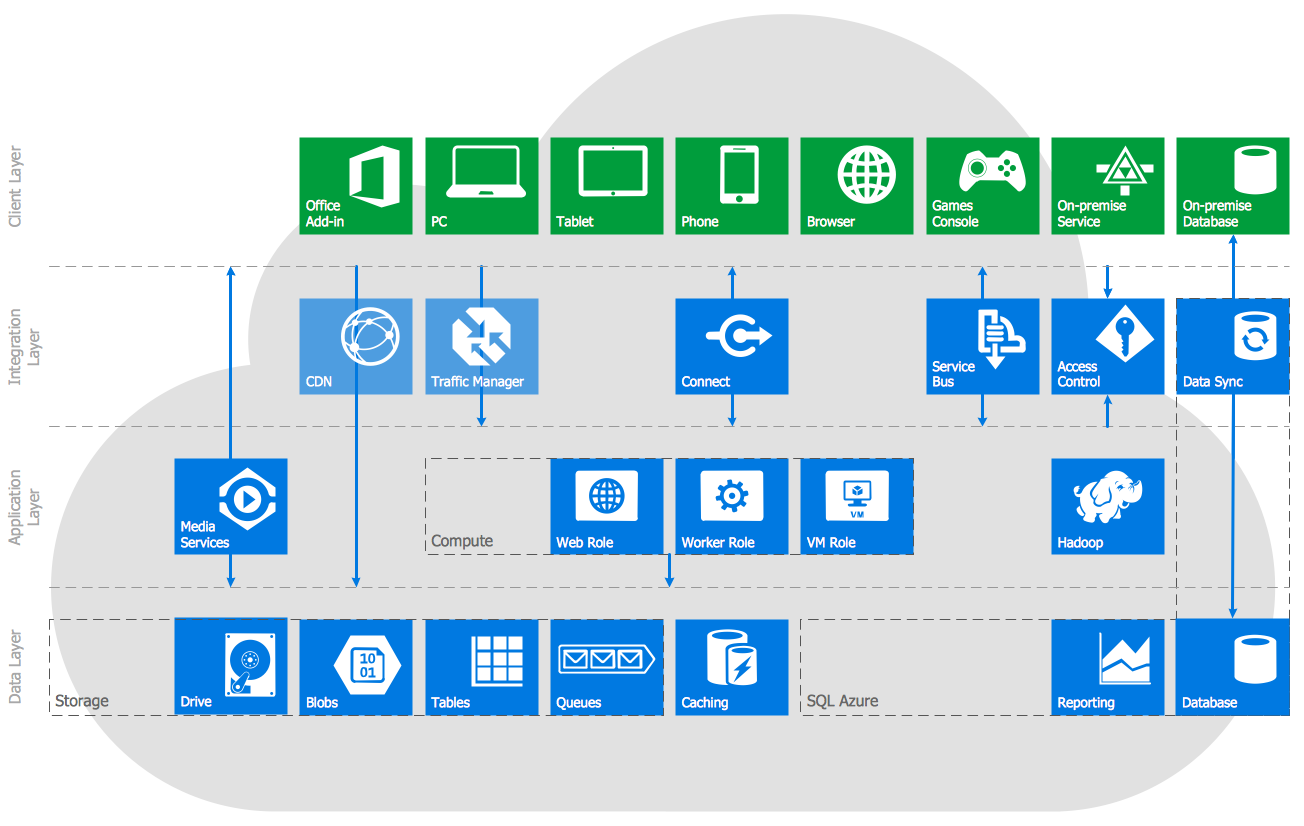
Azure is a cloud computing platform developed by Microsoft which offers the extensive infrastructure and wide set of integrated Azure services useful for effective computing, storage, analytics, databases, networking, application development and deployment.
ConceptDraw DIAGRAM extended with Azure Architecture Solution from the Computer and Networks area is a powerful diagramming and vector drawing software with extensive set of useful drawing tools for easy creating Azure Architecture Diagrams and documenting Azure services.
No need for any special drawing skills to create professional looking diagrams outside of your knowledge base. ConceptDraw DIAGRAM takes care of the technical details, allowing you to focus on your job, not the drawing.
ConceptDraw DIAGRAM delivers full-functioned alternative to MS Visio. ConceptDraw DIAGRAM supports import of Visio files. ConceptDraw DIAGRAM supports flowcharting, swimlane, orgchart, project chart, mind map, decision tree, cause and effect, charts and graphs, and many other diagram types.
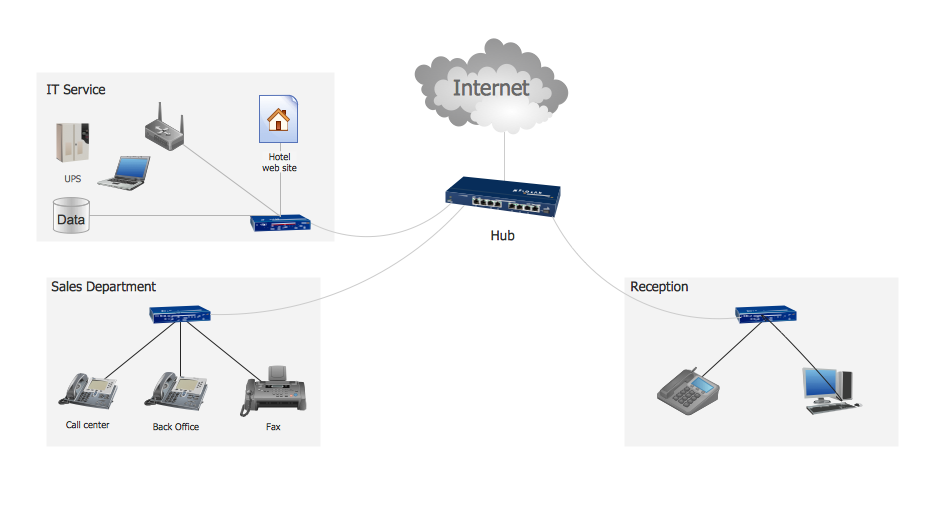
This sample shows computer network diagram of the hotel service process, structure of the hotel service departments and the connection of each department to the internet using the WLAN equipment (routers, hub. etc.).
This sample was created in ConceptDraw DIAGRAM diagramming and vector drawing software using the Computer and Networks solution from Computer and Networks area of ConceptDraw Solution Park.
Special libraries of highly detailed, accurate shapes and computer graphics, servers, hubs, switches, printers, mainframes, face plates, routers etc.
Use ConceptDraw DIAGRAM with Computer & Networks solution for drawing LAN and WAN topology and configuration diagrams, Cisco network diagrams, network wiring schemes and floor plan layouts.
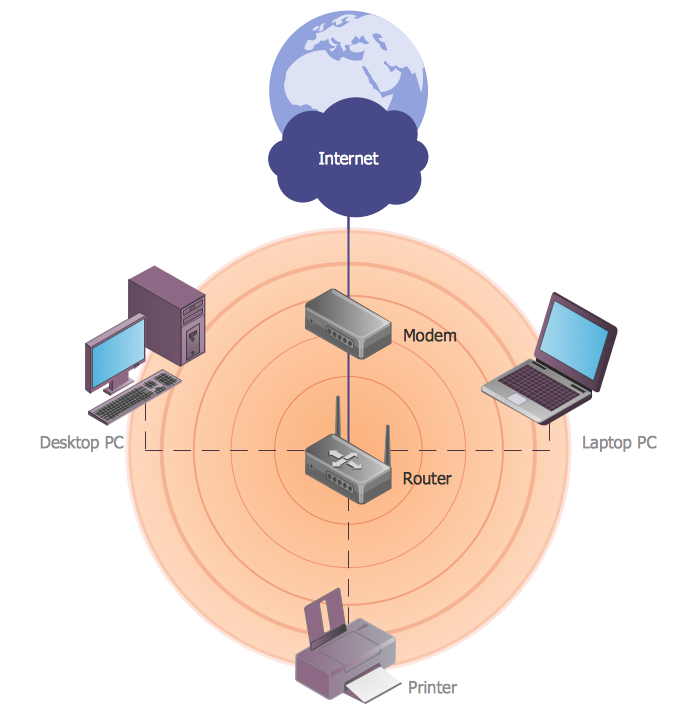
ConceptDraw DIAGRAM diagramming and vector drawing software extended with Wireless Networks Solution gives the ability to its users to create professional looking WLAN schemes and diagrams quick and easy.
Block diagrams solution extends ConceptDraw DIAGRAM software with templates, samples and libraries of vector stencils for creating the block diagram.
Create block diagrams, electrical circuit diagrams, schematics, and more in minutes with ConceptDraw DIAGRAM.