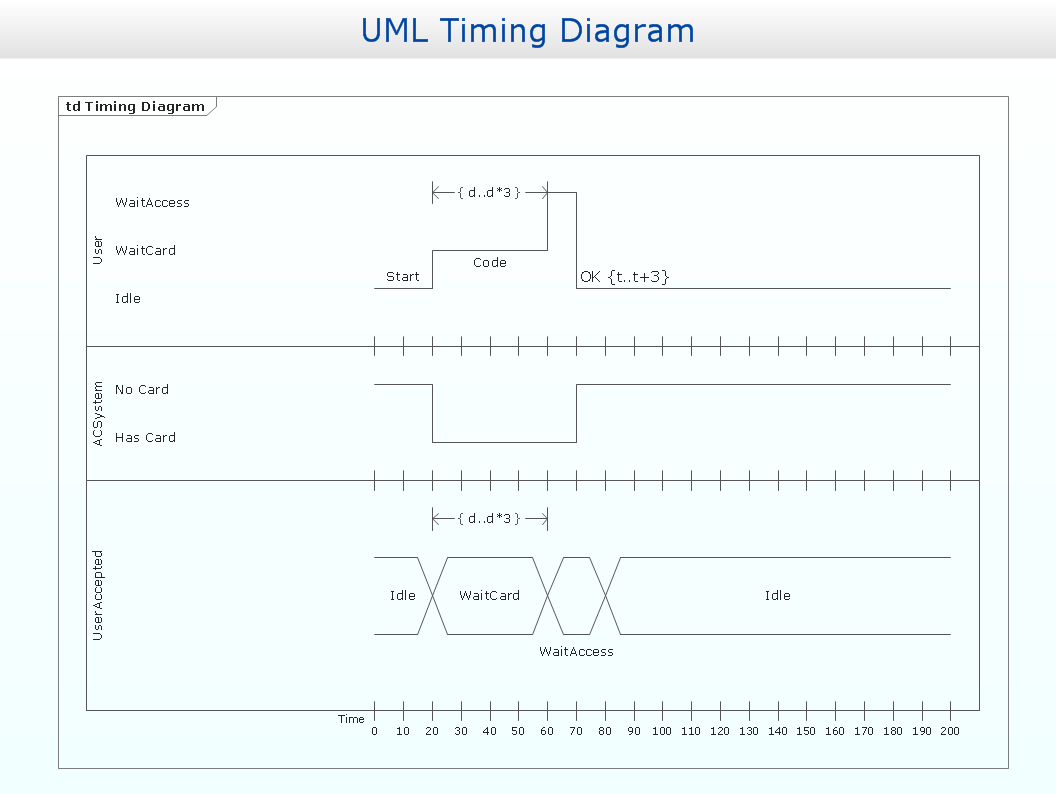
Example 2. UML timing diagram
This example is created using ConceptDraw DIAGRAM diagramming and vector drawing software enhanced with Rapid UML solution from ConceptDraw Solution Park.

Example 3. Rapid UML solution
Rapid UML solution provides templates, examples and libraries of stencils for quick and easy drawing UML 2.4 timing diagram.
Use ConceptDraw DIAGRAM with UML Timing Diagram templates, samples and stencil library from Rapid UML solution to model how the objects of your system change their state or value over time, and how the timed events interact.
TEN RELATED HOW TO's:
The ConceptDraw Flowchart component includes a set of samples and templates. This geathered as flowchart maker toolbox which focused on drawing flowcharts of any industry standards.
Picture: Flowchart Components
Related Solution:
Sequence UML for ATM - This sample represents the UML Sequence Diagram of working the ATM (Automated Teller Machine) banking system. On this diagram are represented the processes and objects that occur at the same time as lifelines (parallel vertical lines), and the messages exchanged between them as horizontal arrows. This sample can be used by the banks for service of the banking transactions using ATMs.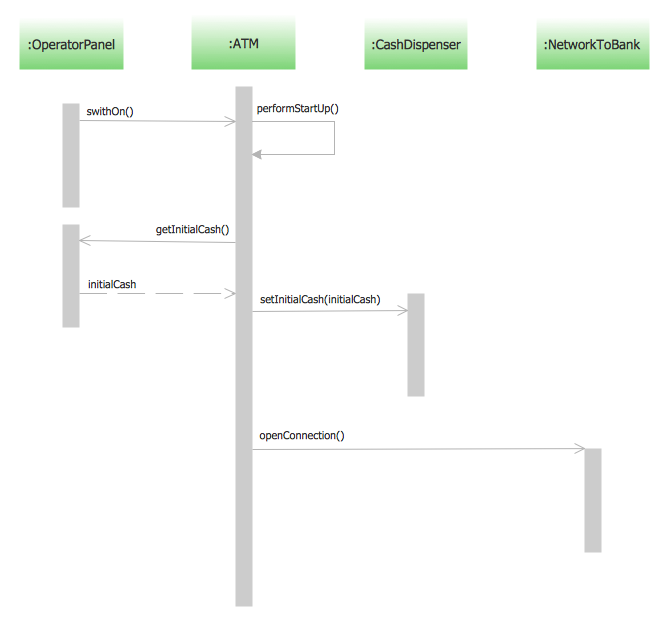
Picture: Sequence UML for ATM
Related Solution:
Venn diagrams are illustrations used in the branch of mathematics known as set theory.
Use ConceptDraw DIAGRAM to quick and easy design your own Venn Diagram of any complexity.
Picture: Venn Diagram
Related Solution:
Data modeling is actively applied in analysis and uses wide set of methods for description the data requirements in a system. One of the most popular and well-known is the ERD method of database modeling.
The best ERD tool for the Mac and Windows is ConceptDraw DIAGRAM software extended with the Entity-Relationship Diagram (ERD) solution from the Software Development Area for ConceptDraw Solution Park, which is sharpened for professional ERD drawing and data modeling with Entity Relationship Diagram.
Picture: Data Modeling with Entity Relationship Diagram
Related Solution:
You can use many tools to create a representation of a system behavior or a scheme of objects relationships. Some of them are quite abstract and useless, and some, like UML tools help clarifying both the structure and the behavior of a system. There are various types of uml diagrams and tons of examples explaining the difference between them.
UML 2.2 specification has many kinds of diagrams. They are divided into two groups( structure and behavior diagrams). This class diagram shows the hierarchical structure of UML 2.2 specification. Class diagram - the most suitable tool for this task because it is designed to describe basic structure of a system. This diagram can be use as a visual aid for learning UML.
Picture: UML Tool & UML Diagram Examples
Related Solution:
This template shows the Context Diagram. It was created in ConceptDraw DIAGRAM diagramming and vector drawing software using the Block Diagrams Solution from the “Diagrams” area of ConceptDraw Solution Park.
The context diagram graphically identifies the system. external factors, and relations between them. It’s a high level view of the system. The context diagrams are widely used in software engineering and systems engineering for designing the systems that process the information.

Picture: Context Diagram Template
Related Solution:
Services UML Diagram. ATM system. This sample was created in ConceptDraw DIAGRAM diagramming and vector drawing software using the UML Use Case Diagram library of the Rapid UML Solution from the Software Development area of ConceptDraw Solution Park.
This sample shows the scheme of the servicing using the ATMs (Automated Teller Machines) and is used at the working of ATM banking systems, at the performing of the banking transactions.
Picture: UML Use Case Diagram Example. Services UML Diagram. ATM system
Related Solution:
The ConceptDraw DIAGRAM Planogram Software and Retail Plan Software offers powerful tools of Enterprise Architecture Diagrams Solution for visualization the market analysis and easy making successful Retail Plans and Planograms with useful detailed recommendations about placing products and optimization the shelf space.
Picture: Planogram Software and Retail Plan Software
Related Solution:
Interactive tool helps you find the appropriate response to social media mentions quickly.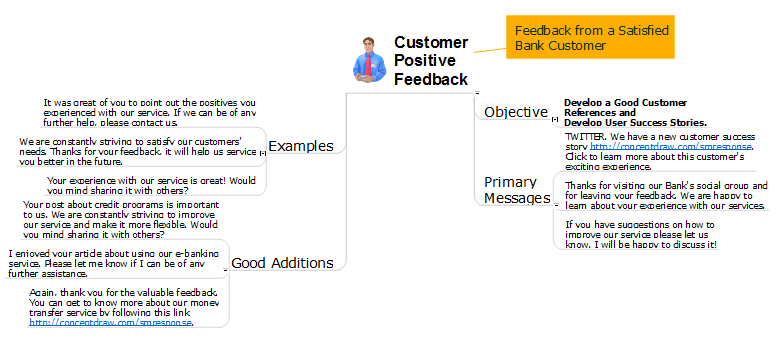
Picture: How to Prepare Learning Presentations for Training
Related Solutions:
Designing a floor plan or a home plan using special software may sound quite complicated. There are many tools to create such plan, but it would be useful for a beginner to watch some tips on how to create home plan with examples or even templates. ConceptDraw Solution Park provides dozens of floor plans examples, templates and libraries with vector stencils.
This small private apartment floor plan is created using ConceptDraw Building Plans solution. It provides the 15 object libraries that include more than 600 vector objects along with the set of templates for drawing different floor plans. The given sample represents the individual apartment's plan in details. It shows the layout of rooms, the furniture and sanitary engineering location and even possible location of houseplants. The legend on the right side of the drawing will guide people through the location of the apartment.
Picture: How To Create Home Plan with Examples
Related Solution:

