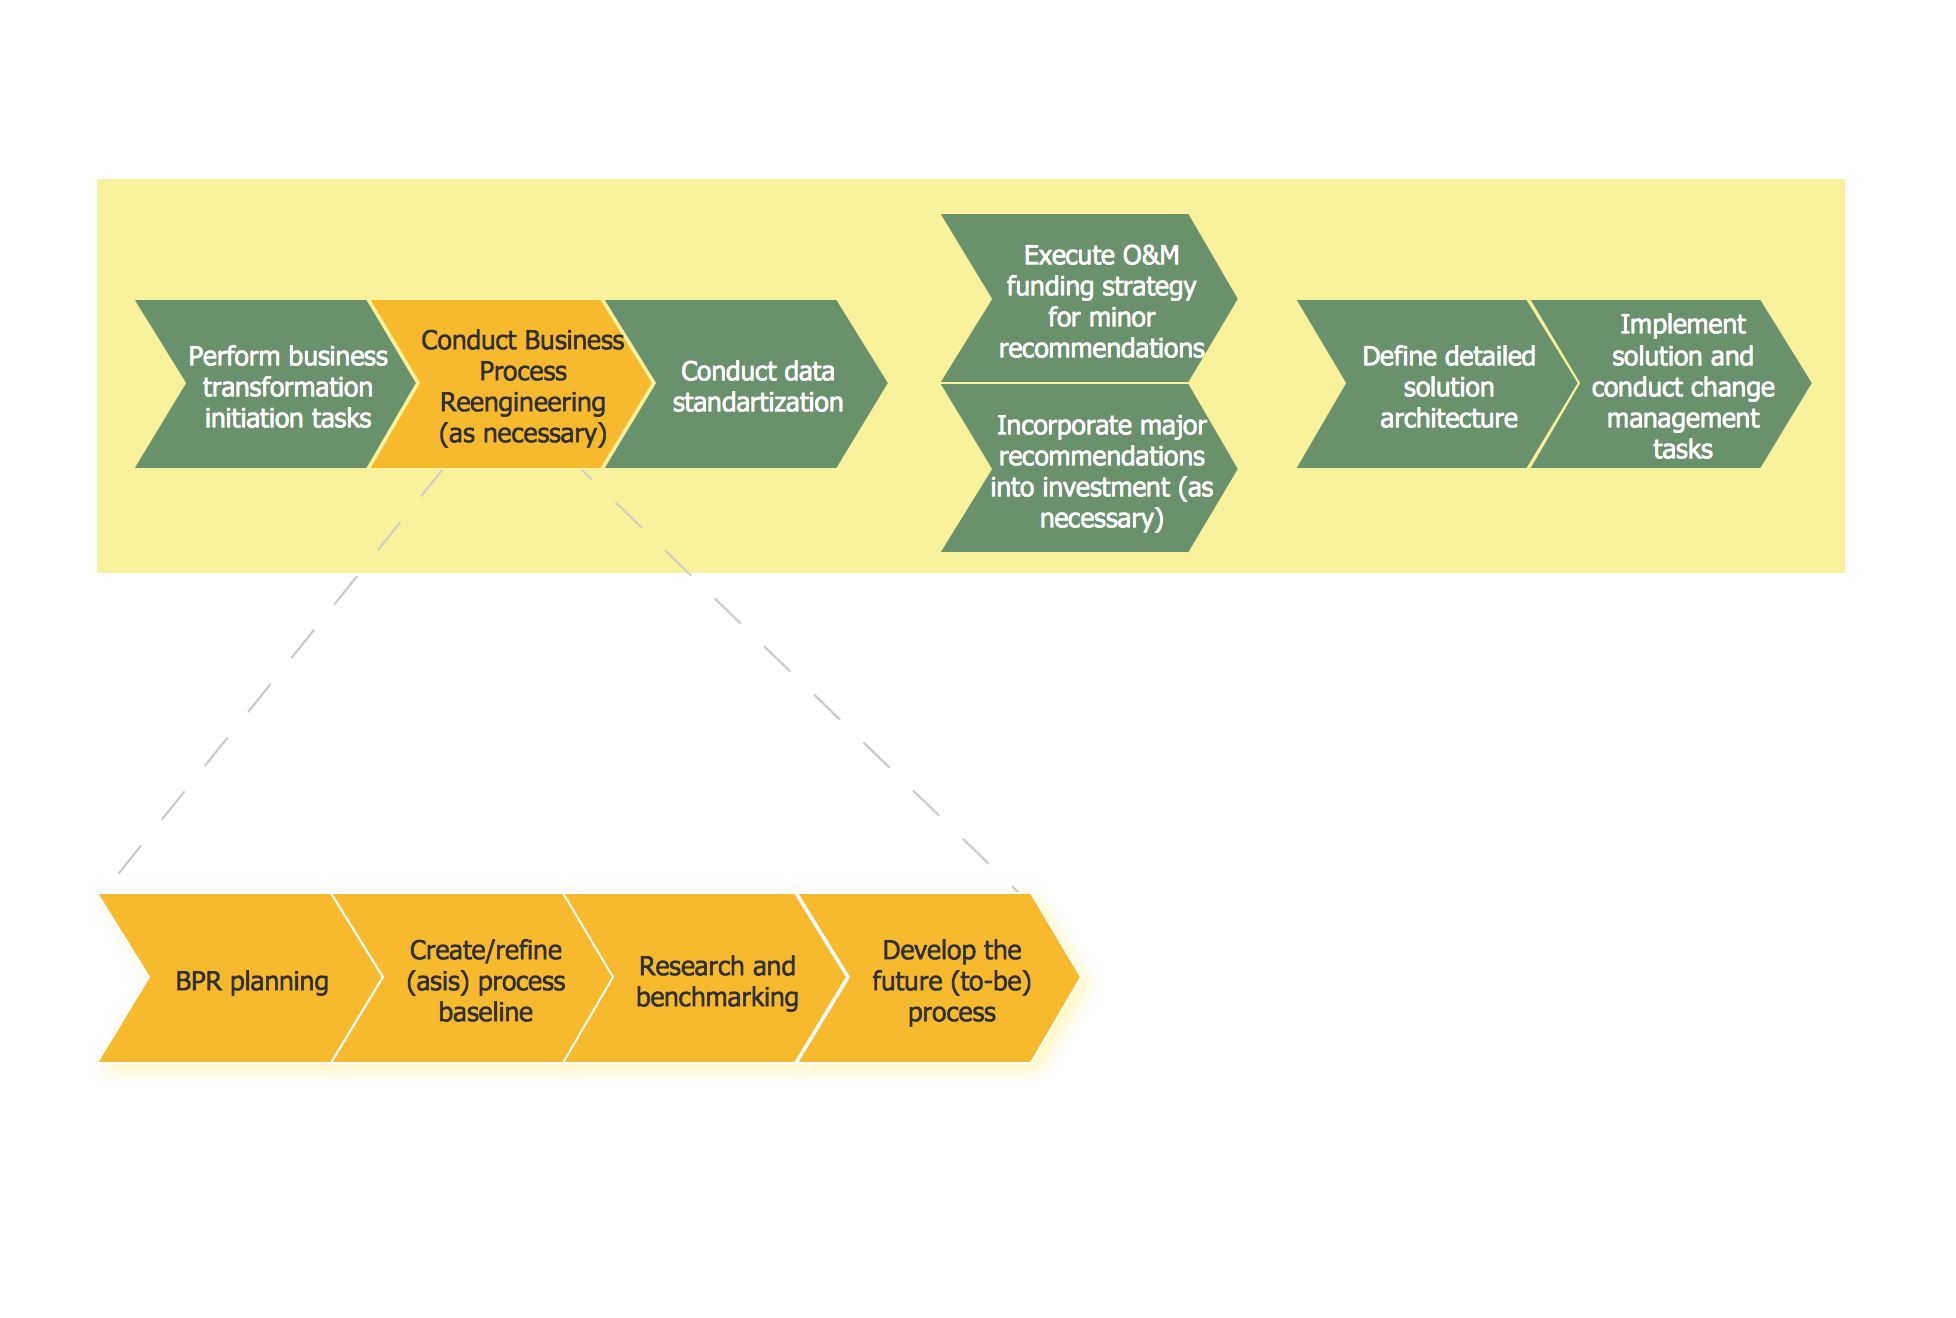
Using the libraries of the Business Process Diagram Solution for ConceptDraw DIAGRAM you can create your own professional Business Process Diagrams quick and easy.
TEN RELATED HOW TO's:
It's no secret that there is a list of skills that every average system administrator should have. And it's important to be able to manage domains via active directory technologies. The best way to keep all the details in mind is to draw a diagram representing users, groups and domains.
This diagram represents an Active Directory Services (Active Directory Domain Services). It can be helpful for system and network administrators to organize a network physical and logical elements (domains, data bases, servers, network equipment, end-user computers etc.) into a secure and logical structure. The logical structure of Active Directory is a hierarchical organization of all network components. The data that is stored in Active Directory comes from some diverse sources. The Active Directory diagram created using ConceptDraw Active Directory Diagram solution. It shows allocating group policies and functions assigned to end users. It helps to plan, manage and maintain the certain user access scenario.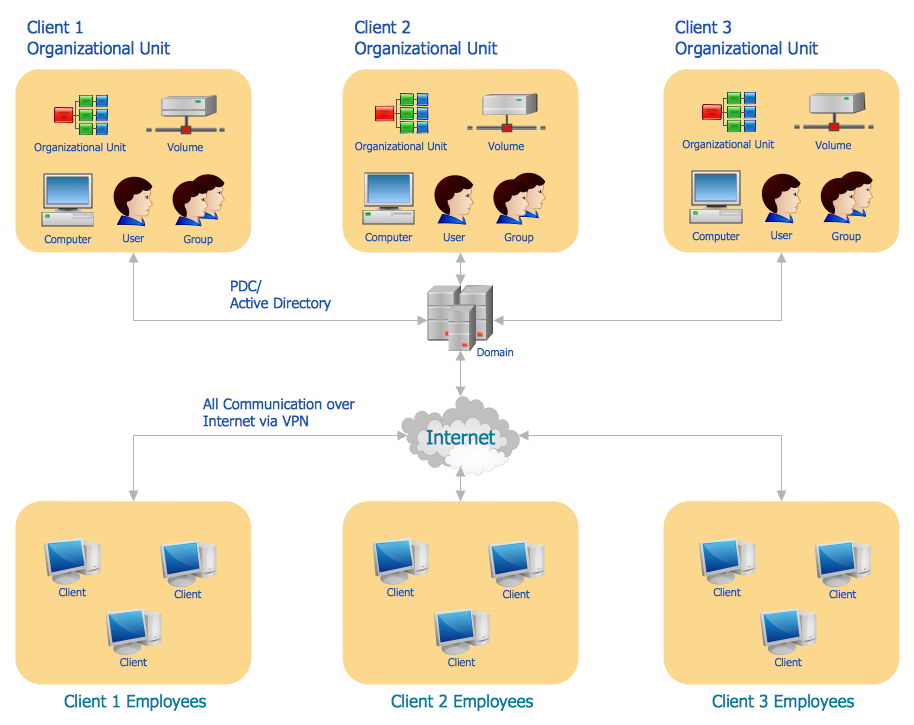
Picture: Active Directory Diagram
Related Solution:
On this diagram are used the flowchart symbols that represents the processes and documents.
Picture:
Credit Card Order Process Flowchart.
Flowchart Examples
Related Solution:
Create with our data flow diagram software perfect data flow diagrams. Download data flow diagram software for FREE. Use hundreds of data flow diagram examples.
Picture: Collaboration in a Project Team
Explore practical flowchart examples including business process diagrams, workflow charts, swimlane flowcharts, and IT troubleshooting flows. Review common patterns and start from ready templates.
Picture: Flowchart Examples
Related Solution:
If you ever wanted to try any diagramming tools except of Visio, but were afraid to lose existing documents, there’s good news for you. One of the most striking features of ConceptDraw DIAGRAM is it’s perfect compatibility with MS Visio, which guarantees that you won’t depend on operating system anymore, because another ConceptDraw DIAGRAM feature is that it’s cross-platform tool. Don’t waste your time looking for other options, you’ve found the solution already!
Business professionals often utilize the MS Visio as a common tool for making various issues on business visualization. MS Visio is a strong software with good capacity to maintain complex business solutions. But there is no MS Visio for Apple OS X. This is a large invocation, and one would be pleased to recognize that ConceptDraw DIAGRAM is the ideal alternative to MS Visio. Primarily, because this software works natively on both Windows and Apple OS X platforms. if you have migrated from Windows to Mac, or need to communicate in a cross-platform conditions, you’ll search for MS Visio replacer. ConceptDraw DIAGRAM is the exclusive professional business diagramming application that runs on both Windows and Apple OS X. The opportunity exchange files between PC and Mac, as well as between ConceptDraw DIAGRAM and Visio is the significant advantage that permits you to display and to collaborate business information in effortless and cost-effective way.
Picture: ConceptDraw DIAGRAM Compatibility with MS Visio
To create flowcharts in MS Word, programs designed specifically for the purpose of creating flowcharts are particularly well-suited to the task.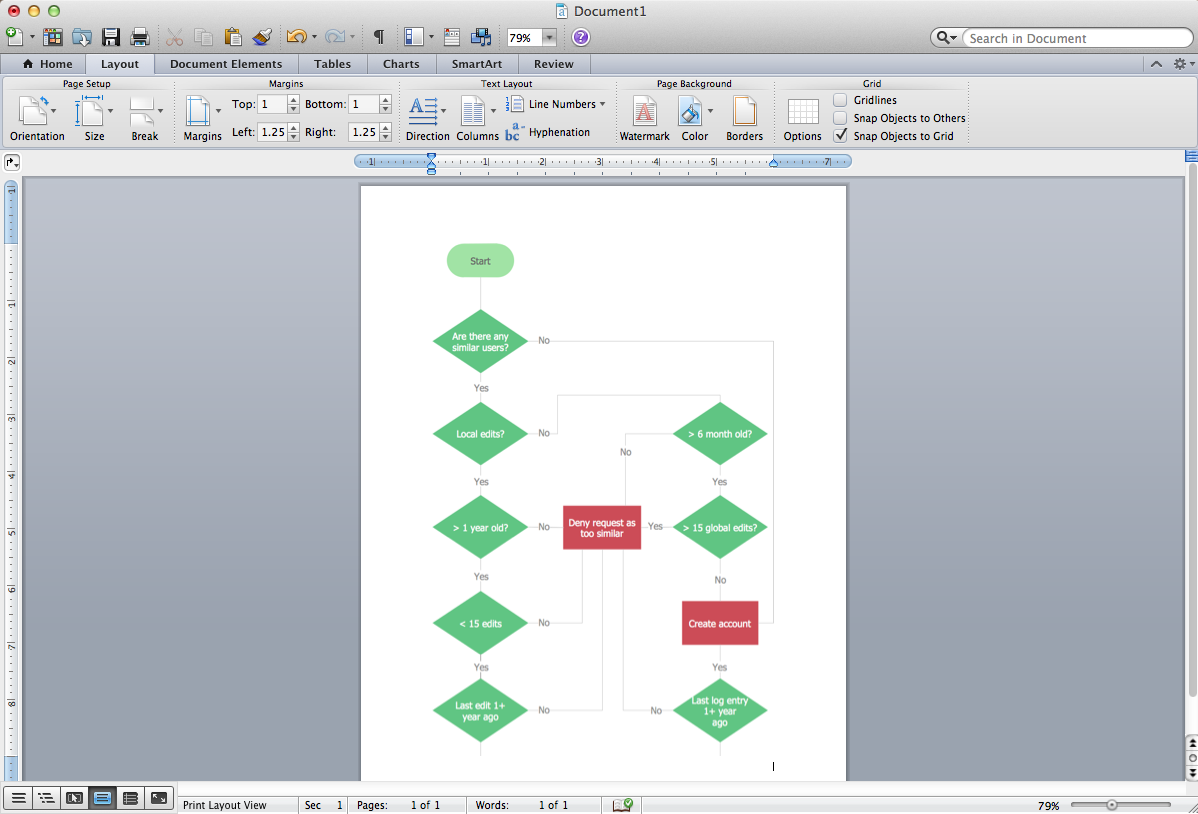
Picture: Flowcharts in Word
Related Solution:
Waterfall chart shows the changing of the value from one state to another through the series of intermediate changes. The waterfall diagrams are widely used in the business. They are used to represent the set of figures and allow link the individual values to the whole.
Picture: Waterfall Bar Chart
Related Solution:
Any bar chart can be also called as a bar graph or a column chart or graph. Being a chart or a graph that is commonly used for presenting some categorical data with the rectangular bars having their lengths or heights proportional to the values that they represent, such drawings can be made with the help of the ConceptDraw DIAGRAM diagramming and drawing software. The created bars can be plotted either vertically or horizontally and any vertical bar chart can be also sometimes called as a line graph.
Picture: Column Chart Template
Related Solution:
An event-driven process chain diagram is a flowchart used in business process analysis. It evolved from Architecture of Integrated Information Systems (ARIS) and utilised in the business process improvement and analysis. It is also used to facilitate enterprise resource planning.
An EPC diagram is a complex flowchart that shows different business processes through various workflows. The workflows are seen as functions and events that are connected by different teams or people, as well as tasks that allow business processes to be executed.
ConceptDraw DIAGRAM is a software for making EPC diagrams that allows managers visually present business process models for making decisions for business.
Picture: How to Draw EPC Diagram Quickly
Related Solution:
Fast visualization of structured data is main capability of the ConceptDraw DIAGRAM. With numerous vector stencils and standard flowchart symbols from object libraries and the RapidDraw technology this program stands as the best professional flowchart software for drawing with type of flowchart symbols. ConceptDraw DIAGRAM also known as best flowchart maker.
Picture: Easy Flowchart Program and Standard Flowchart Symbols
Related Solution: