
Example 1. Daily Schedule Chart in ConceptDraw
Target and Circular Diagrams Solution offers 2 libraries:
- Circular Diagrams library
- Target Diagrams library
with variety of predesigned vector elements for drawing various kinds of Target Diagrams and Circular Diagrams. The Daily Schedule Chart can be also easily designed with their help.

Example 2. Circular Diagrams Library Design Elements
All these objects are vector and easy to use. You can simply drag any of them from the library to the document, fill and change for your needs.

Example 3. Target Diagrams Library Design Elements
The predesigned examples and samples included in the Target and Circular Diagrams Solution and available from the ConceptDraw STORE will be also useful for you.

Example 4. Daily Schedule Chart
This sample was created in ConceptDraw DIAGRAM using the tools of the Target and Circular Diagrams Solution. It demonstrates the detailed Daily Schedule Chart. An experienced user spent 5 minutes creating this sample.
Use the Target and Circular Diagrams Solution to create your own professional looking Daily Schedule Chart of any complexity quick, easy and effective.
All source documents are vector graphic documents. They are available for reviewing, modifying, or converting to a variety of formats (PDF file, MS PowerPoint, MS Visio, and many other graphic formats) from the ConceptDraw STORE. The Target and Circular Diagrams Solution is available for all ConceptDraw DIAGRAM or later users.
TEN RELATED HOW TO's:
For depicting the onion model are actively used Stakeholder Onion Diagrams. The ConceptDraw DIAGRAM diagramming and vector drawing software extended with Stakeholder Onion Diagrams Solution from the Management Area of ConceptDraw Solution Park offers the number of useful tools and Stakeholder Onion Diagram template for their easy design.
Picture: Stakeholder Onion Diagram Template
Related Solution:
A causal model is an abstract concept, that describes the causal mechanisms of a system, by noting certain variables and their influence on each other, in an effort to discover the cause of a certain problem or flaw. This model is presented in diagram form by using a fishbone diagram.
ConceptDraw DIAGRAM diagramming and vector drawing software enhanced with Fishbone Diagrams solution helps you create business productivity diagrams from Fishbone diagram templates and examples, that provide to start using of the graphic method for the analysis of problem causes. Each predesigned Fishbone Diagram template is ready to use and useful for instantly drawing your own Fishbone Diagram.
Picture: Fishbone Diagram Template
Related Solution:
Audit procedures are the specific tests and methods that auditor executes when gathering the evidence which are necessary for making an opinion on the financial statements of the firm. There are three types of audit procedures: data selection, reliability validation, relevance confirmation.
Thanks to the extensive drawing tools which provides the Audit Flowcharts solution from the Finance and Accounting area of ConceptDraw Solution Park, you can easy and effectively develop and realize various audit procedures.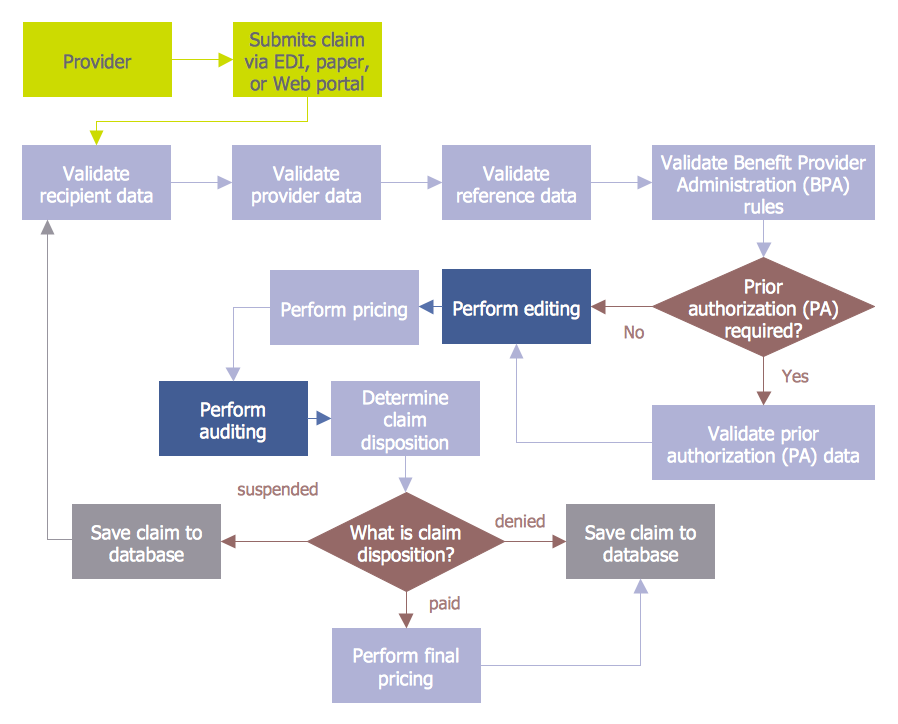
Picture: Audit Procedures
Related Solution:
ConceptDraw RapidDraw DIAGRAM helps create visually document and communicate Business Process (BPMN 2.0) information.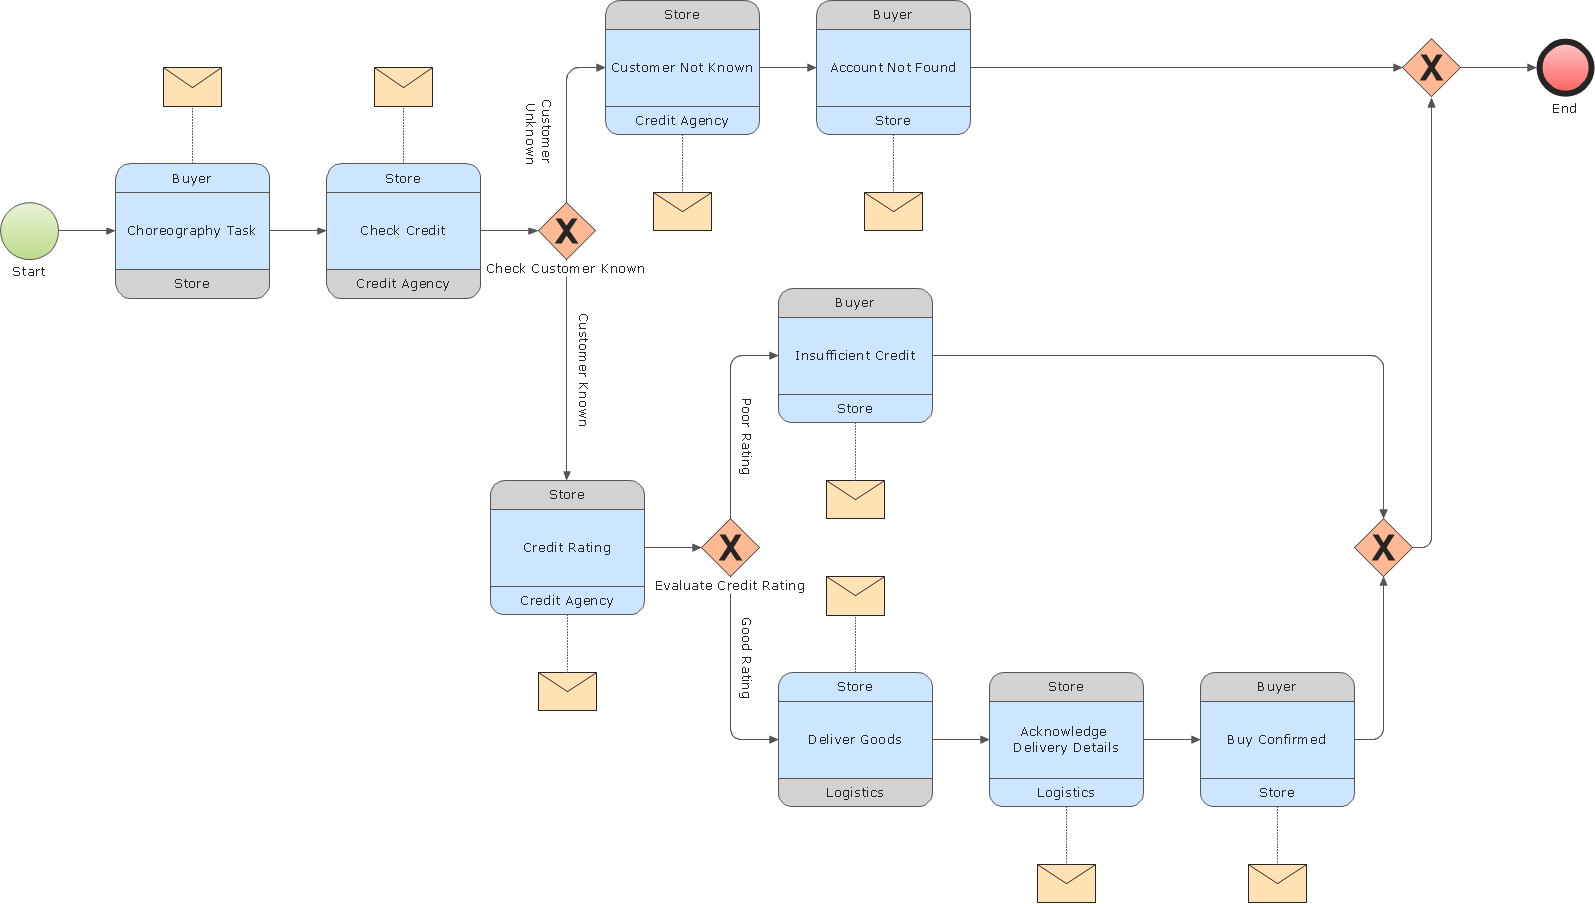
Picture: Business Process Modeling
ConceptDraw DIAGRAM diagramming and vector drawing software offers a Cooking Recipes solution from the Food and Beverage area with wide capabilities for fast and easy design pictorial, bright and inspiring illustrations for various recipes - daily, holiday and party recipes, for pictorial representation dishes in menus of restaurants and cafes, for designing cookbooks, menu sets, food posters and promo materials.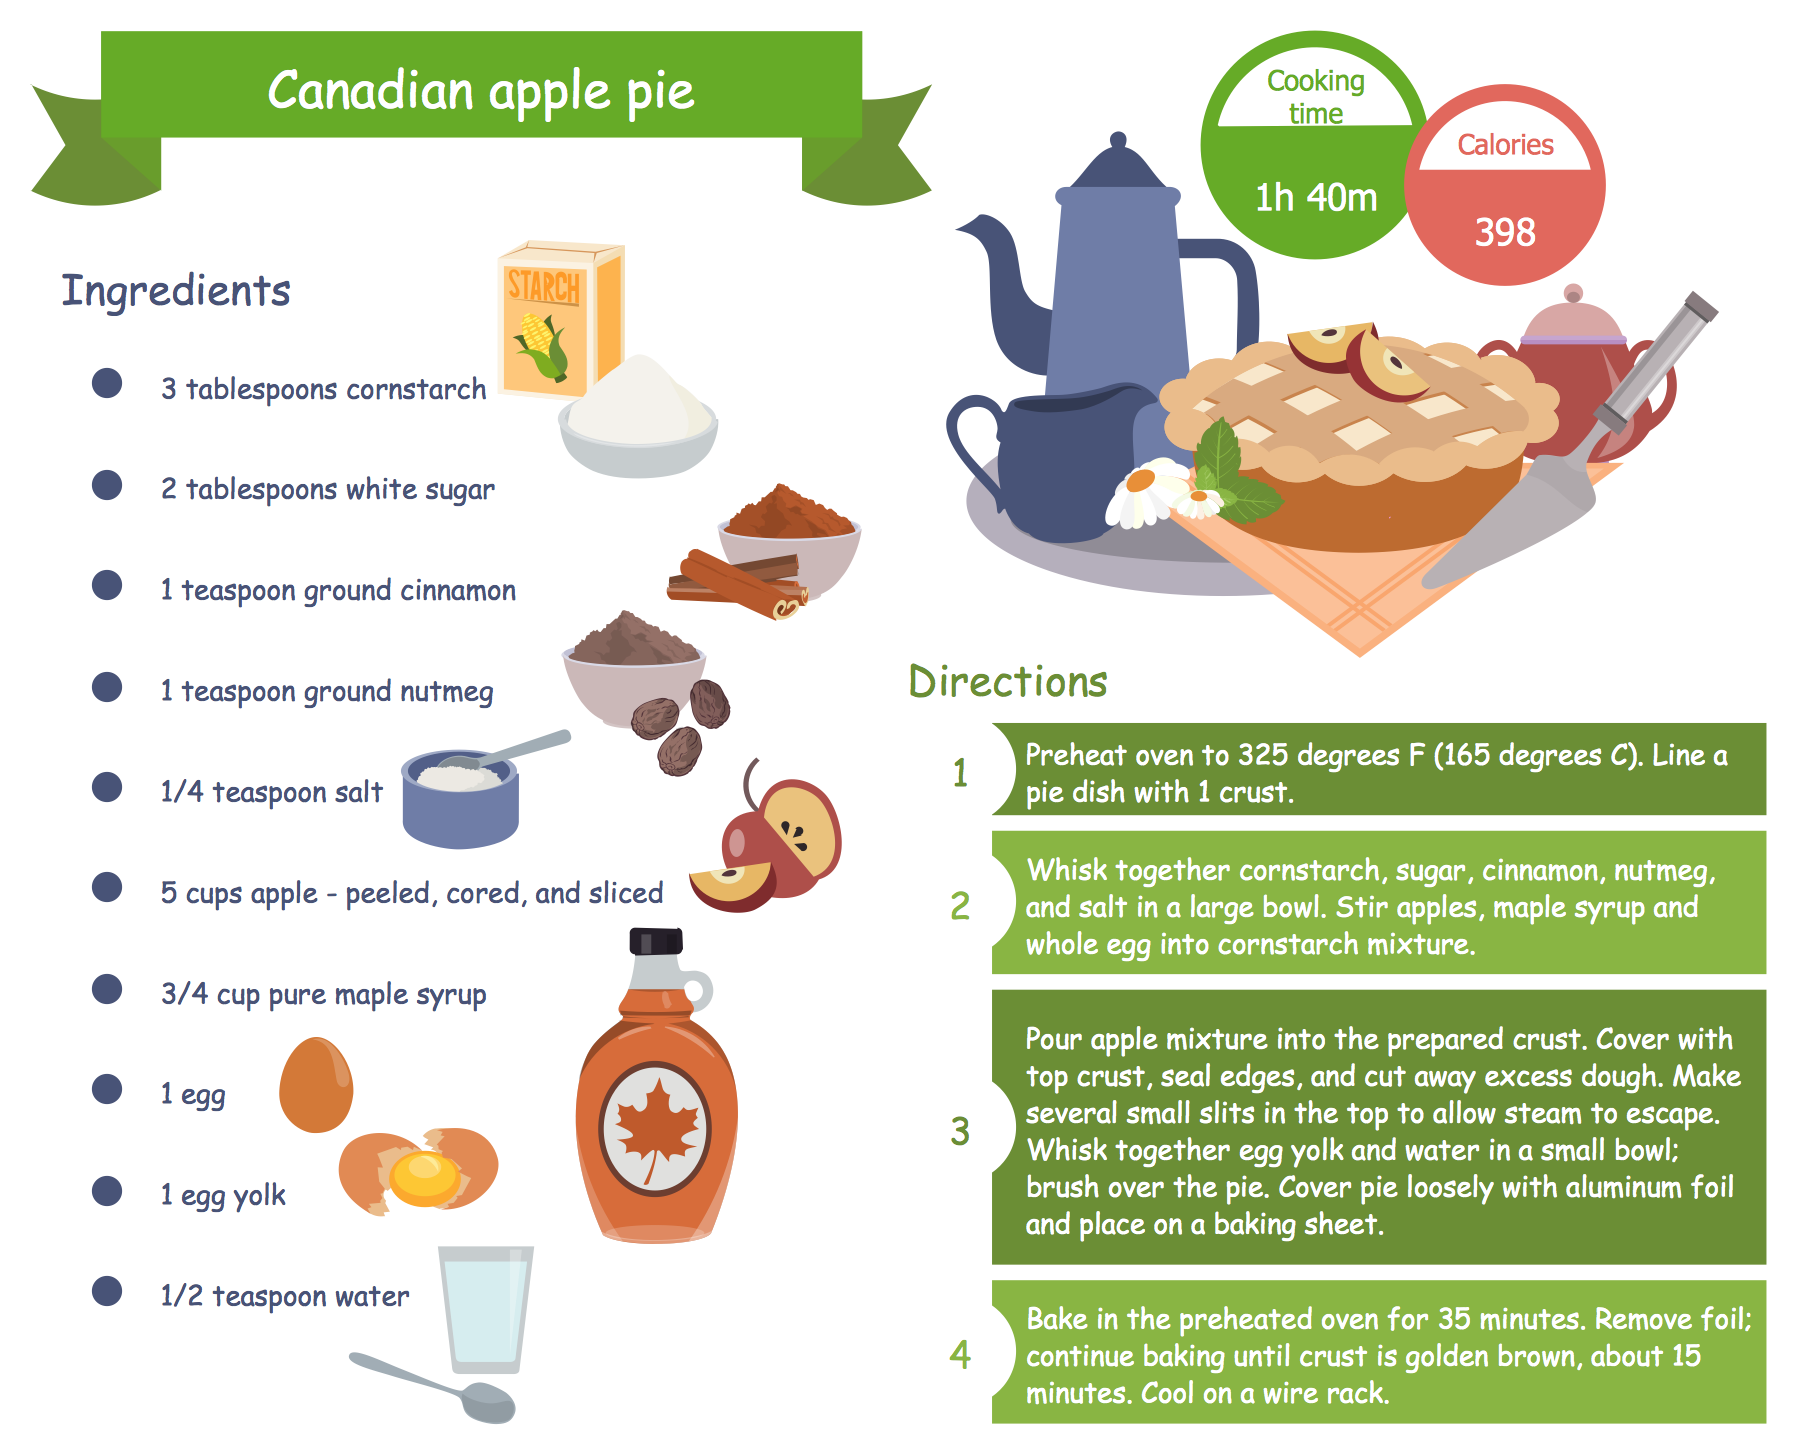
Picture: Party Recipes
Related Solution:
ConceptDraw PROJECT is an effective tool for new and experienced users with a fine balance of usability and powerful functionality.
Picture: ConceptDraw PROJECT Software Overview
Invented in 1904 by John Ambrose Fleming, vacuum tubes were a basic component for electronics throughout the first half of the twentieth century, which saw the diffusion of radio, television, radar, sound reinforcement, sound recording and reproduction, large telephone networks, analog and digital computers, and industrial process control. From the mid-1950s solid-state devices such as transistors gradually replaced tubes. However, there are still a few applications for which tubes are preferred to semiconductors; for example, the magnetron used in microwave ovens, and certain high-frequency amplifiers.
26 libraries of the Electrical Engineering Solution of ConceptDraw DIAGRAM make your electrical diagramming simple, efficient, and effective. You can simply and quickly drop the ready-to-use objects from libraries into your document to create the electrical diagram.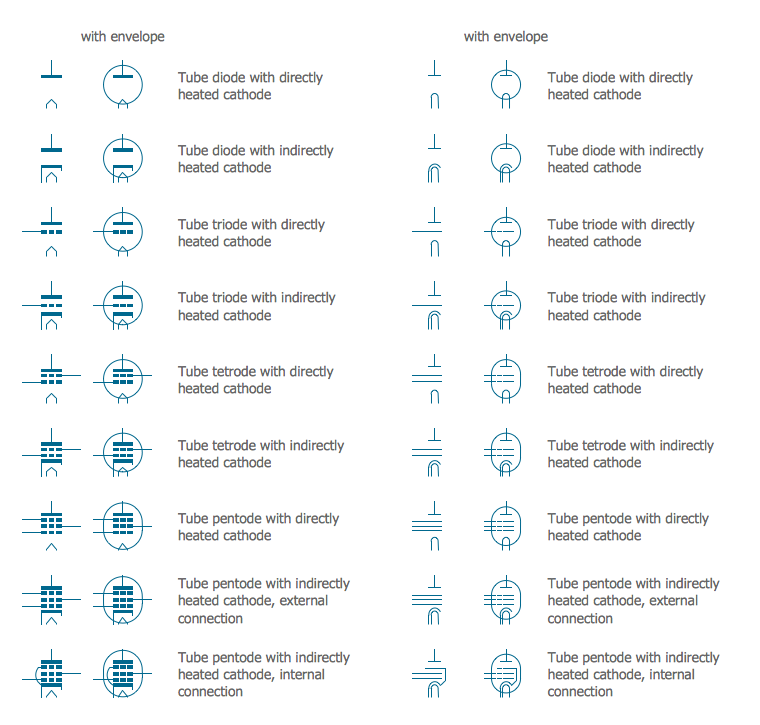
Picture: Electrical Symbols — Electron Tubes
Related Solution:
An Enterprise private network (EPN) is a computer network built by an enterprise to interconnect the sites of the company (such as head and remote offices, shops, production sites, etc.) on purpose to share the computer resources.
This example was created in ConceptDraw DIAGRAM using the Computer and Networks solution from the Computer and Networks area of ConceptDraw Solution Park. It shows the Enterprise Private Network (EPN) using the frame-relay and dial-up.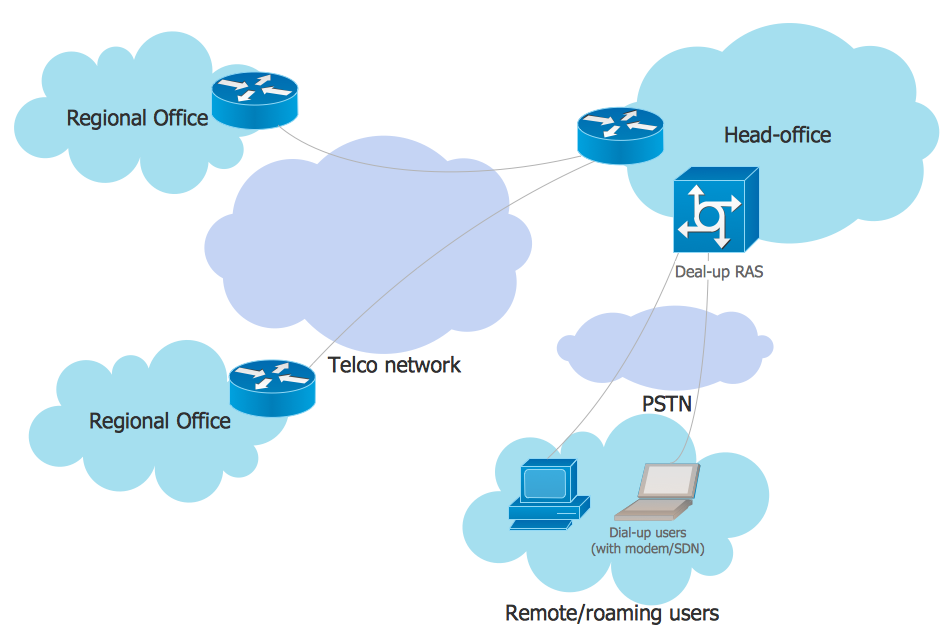
Picture: EPN Frame-Relay and Dial-up Network. Computer and Network Examples
Related Solution:
ConceptDraw DIAGRAM software offers the Electric and Telecom Plans Solution which provides the extensive tools for drawing attractive Electric Visual plans.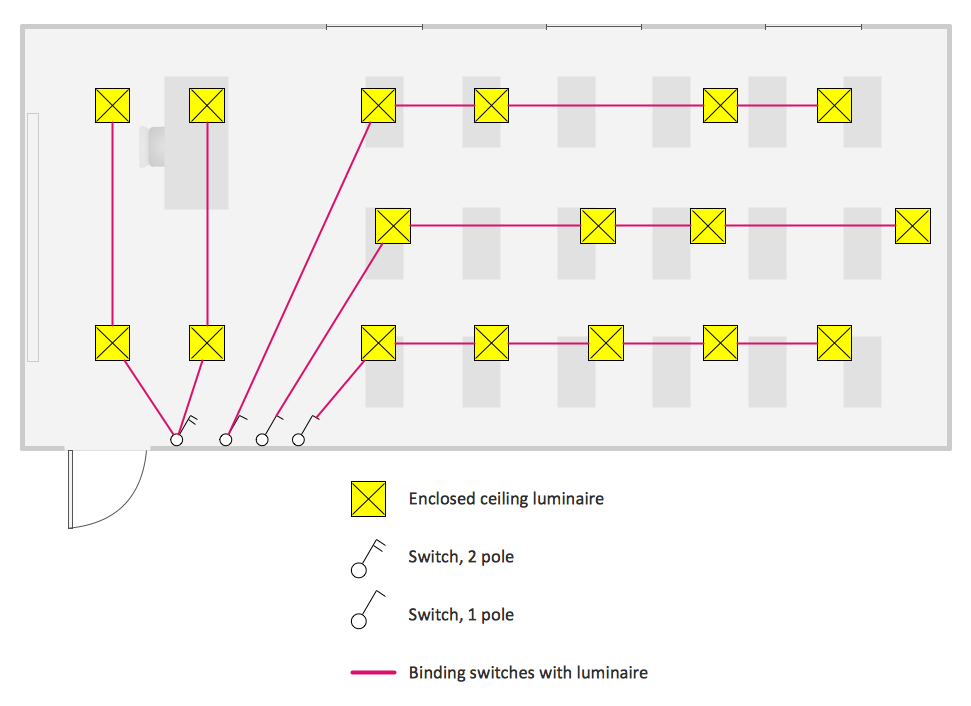
Picture: Electric Visual
Related Solution:
This sample shows the Step Area Graph of the PCB (Printed circuit board) Via current capacity and can be useful in electronics. It is displayed 1 mil plating Via current capacity and the resistance vs diameter on a 1.6 mm PCB. A via is an electrical connection between the layers in the electronical circuit that in PCB consists of two pads on the different electrically connected layers of the board.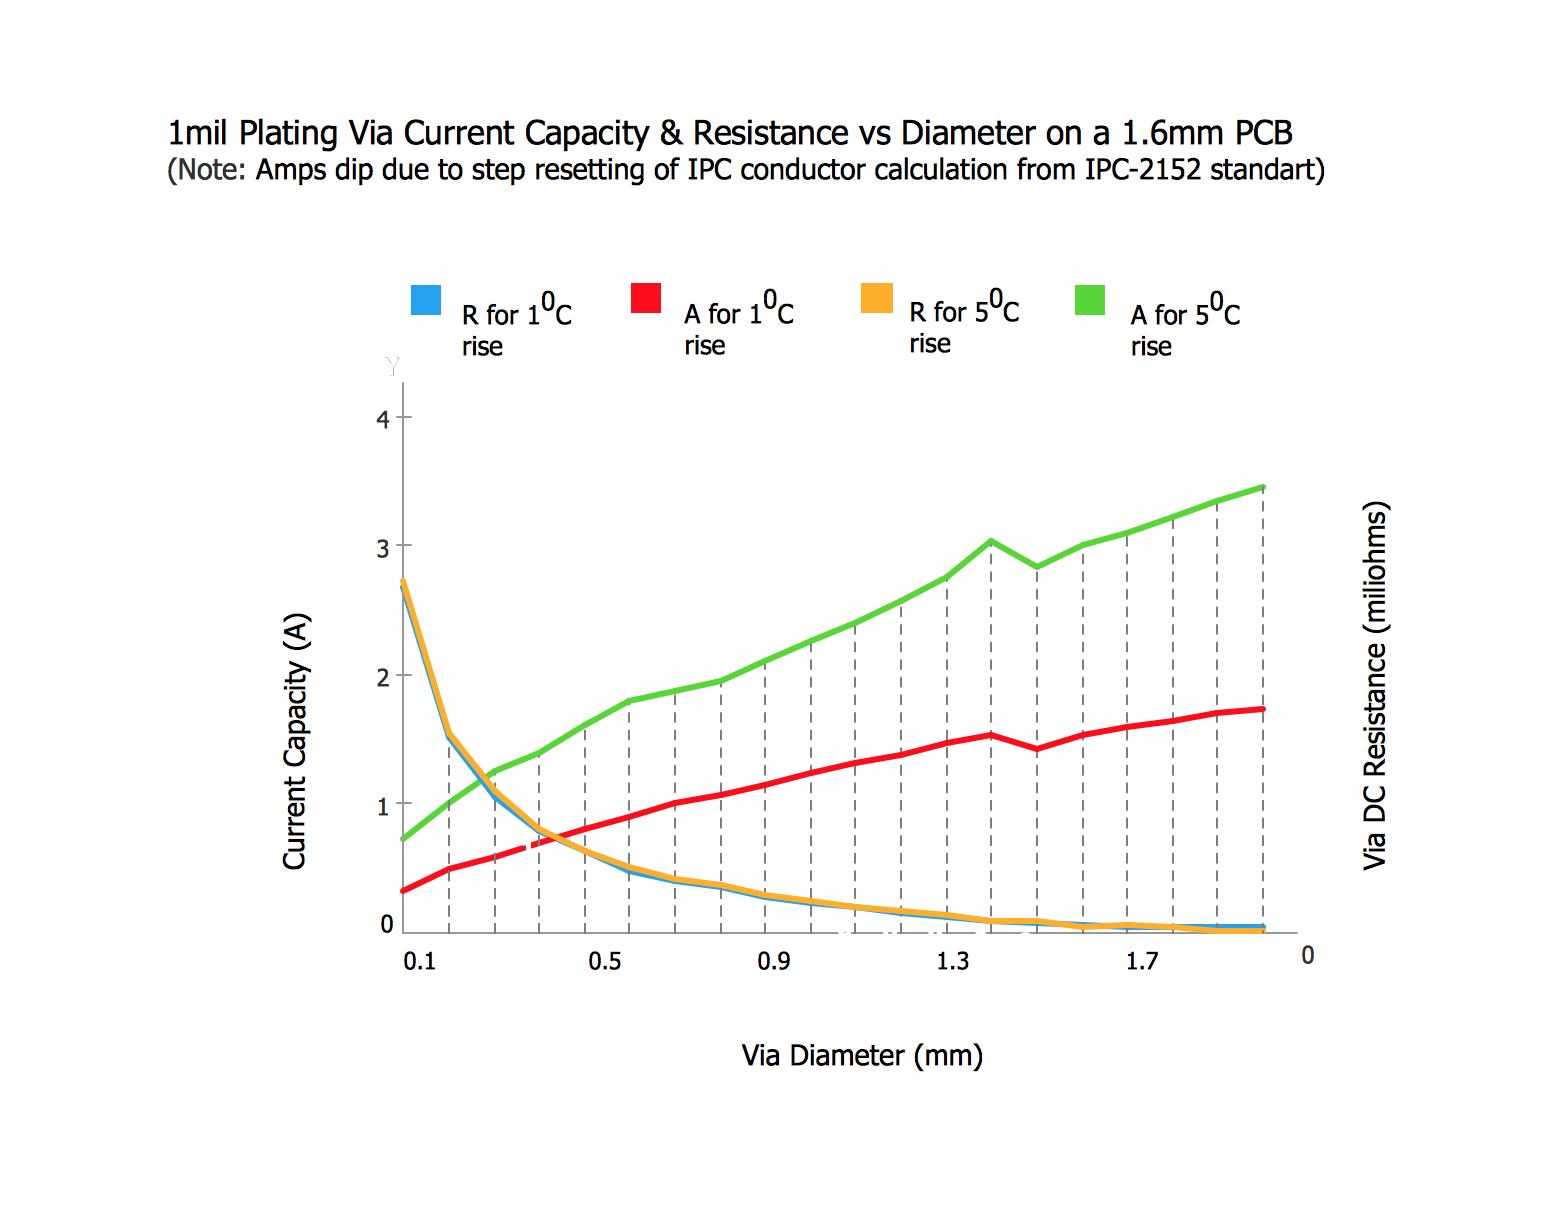
Picture: Step Area Graph
Related Solution:

