How should diagramming software work? Is it possible to develop a diagram as quickly as the ideas come to you?
The innovative ConceptDraw Arrows10 Technology included in ConceptDraw DIAGRAM is a powerful drawing tool that changes the way diagrams are produced. While making the drawing process easier and faster.
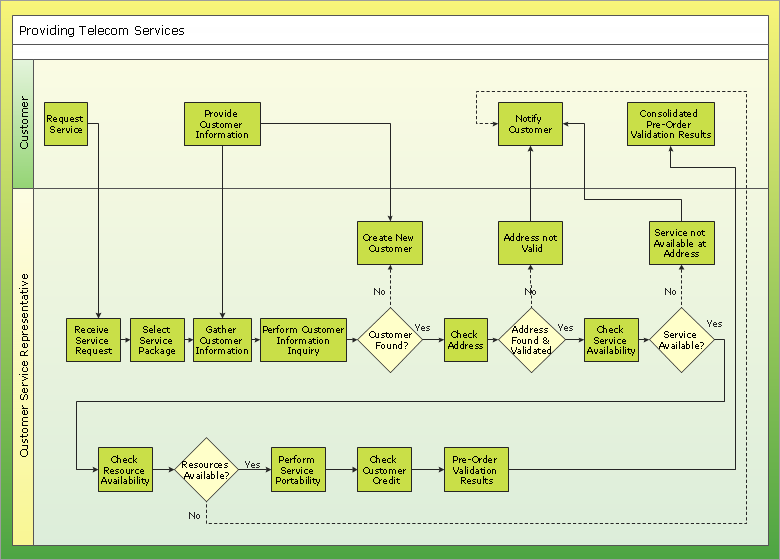
ConceptDraw DIAGRAM is a powerful tool that helps you create a Cross Functional Flow Chart quickly and easily. Fine-tuning the objects in ConceptDraw DIAGRAM allows you to create a really professional finished article. ConceptDraw Arrows10 Technology gives drawing connectors a smart behavior that provides quick and precise placement, allows for easy changes and automatic rearrangement.
The "chain" mode connects every new shape to the previous one. If you want to create a new branch in your diagram, you just deselect the current chain and select the new shape, which will be the root for this branch, turn the "chain" mode on again and then continue adding shapes. The "chain" auto connection mode is convenient for drawing Cross Functional Flow Chart.
Video 1. How to Draw Double-headed Cross Functional Flowchart
Cross-Functional Flowcharts Solution offers you the best numerous collection of predesigned Cross Functional Flowchart examples, samples and templates, and Cross-Functional Flowcharts library with large quantity of ready-to-use vector stencils.
Example 1. Cross-Functional Flowcharts solution, examples and templates
Use the Cross-Functional Flowcharts Solution for ConceptDraw DIAGRAM to create your own professional looking and attractive Cross Functional Flowchart of any complexity quick, easy and effective.
Example 2. Double-headed Cross Functional Flowchart
All source documents are vector graphic documents. They are available for reviewing, modifying, or converting to a variety of formats (PDF file, MS PowerPoint, MS Visio, and many other graphic formats)
Processing Flow Chart is a simplified sketch used in chemical and process engineering to illustrate general plant streams, major equipment, and key control loops. ConceptDraw DIAGRAM enhanced with Flowcharts Solution is ideal software for designing ✔️ Processing Flow Charts, ✔️ Process Flow Charts, ✔️ Flow Chart Process Maps
The Critical Path Method (CPM) is an algorithm for scheduling a set of project activities. It is an important tool for effective project management. ConceptDraw PROJECT implements this method to provide the user with a wide set of project management tools.
Picture: Critical Path Method in ConceptDraw PROJECT
Once you have created your document in ConceptDraw DIAGRAM and you want to share it with your colleagues and friends, who uses MS Visio on their computers, you can easily export your document using ConceptDraw DIAGRAM export to Visio XML files (VDX) feature.
Now you can share your ConceptDraw documents with MS Visio users.
Picture: Export from ConceptDraw DIAGRAM Document to MS Visio® XML
Bubble diagrams solution extends ConceptDraw DIAGRAM software with templates, Using ConceptDraw Connectors, you can make a bubble chart in moments. Using ConceptDraw you will be able to make a bubble chart from the ready ConceptDraw library objects or make your own objects. The created diagram can represent ideas organization, in brainstorming processes, by teachers for explaining difficult ideas or for presentations.
Flowcharts visualize a process or algorithm of program as step/operation blocks of various shapes connected with arrowed lines showed the process flow direction. They are used to visualize business or technical processes and software algorithms.
Conceptdraw DIAGRAM - feature-rich flowchart software. It will allow you to create professional looking flowcharts.
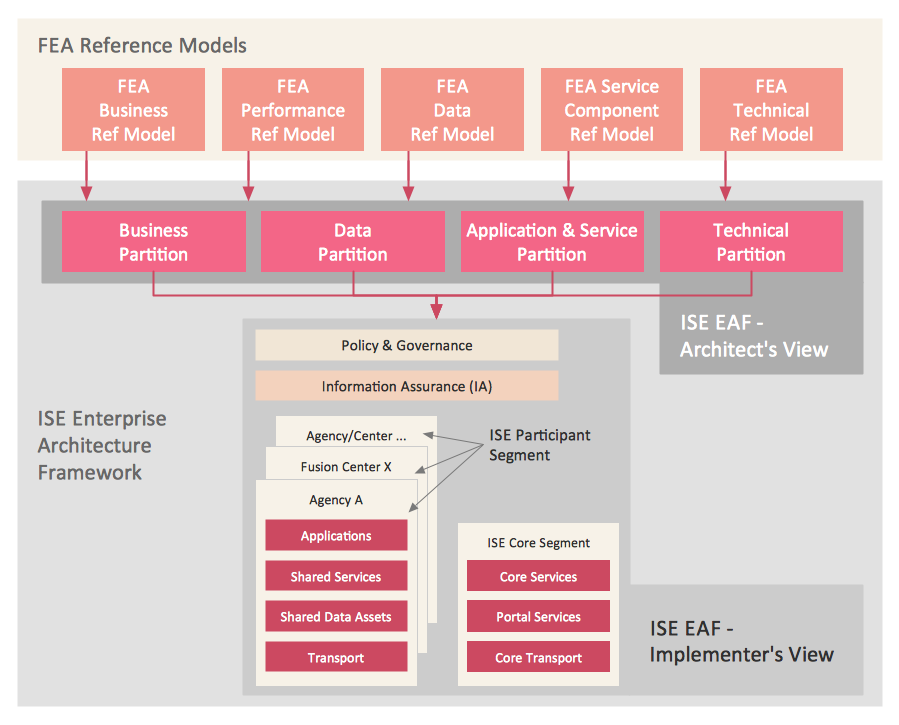
What is information architecture? Information architecture (IA) is a broad and abstract term. At the most general sense the information architecture describes the structure of a system, how the different pieces of information are related at the system and represents their relationships. The information architecture term was introduced by Richard Saul Wurman in 1975 and now is commonly used in the context of websites and intranets, information structures and computer systems.
ConceptDraw DIAGRAM extended with Enterprise Architecture Diagrams Solution from the Management Area is the best software for design information architecture and drawing Enterprise Architecture Diagrams.
Internal auditing is an independent, objective assurance and consulting activity designed to add value and improve an organization's operations.
ConceptDraw DIAGRAM diagramming and vector drawing software extended with Audit Flowcharts solution from the Finance and Accounting area perfectly suits for the Internal Audit Process. You can make sure this right now!
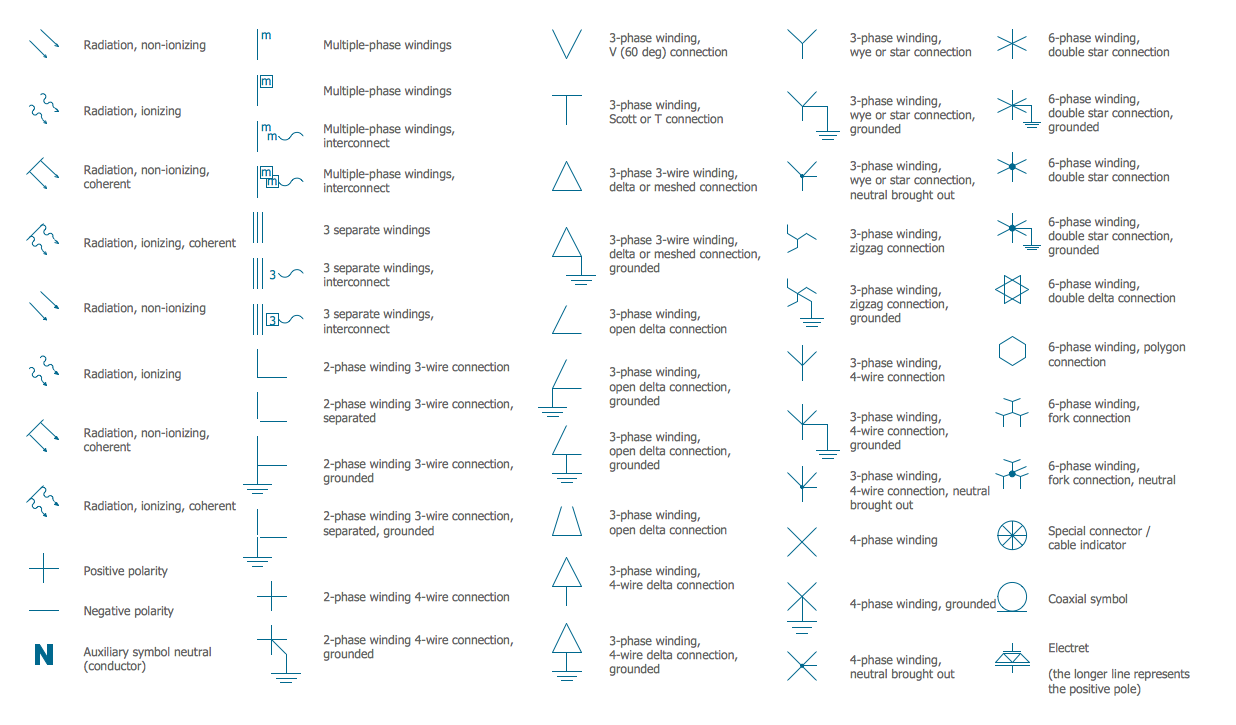
A qualifying symbol is graphics or text added to the basic outline of a device’s logic symbol to describe the physical or logical characteristics of the device.
26 libraries of the Electrical Engineering Solution of ConceptDraw DIAGRAM make your electrical diagramming simple, efficient, and effective. You can simply and quickly drop the ready-to-use objects from libraries into your document to create the electrical diagram.
The vector stencils library from the solution Information Model Diagrams contains specific data type symbols of the EXPRESS-G notation such as entity data type symbols, simple data type symbols, enumeration data type symbols, defined data type symbols, select data type symbols and specific attribute symbols for ConceptDraw DIAGRAM diagramming and vector drawing software. The Information Model Diagrams solution is contained in the Software Development area of ConceptDraw Solution Park.
When we think of an hierarchy, we intuitively imagine a pyramid. Thus, a lot of management tools use pyramid charts as examples or illustrations of various documents or models. You can create any type of triangle diagram using ConceptDraw DIAGRAM.
A triangle (pyramid) diagram is often used in marketing to show the data hierarchy. This pyramid diagram represents the Top Brand Model. It illustrate the model of rebranding strategy. It can be used by marketing agency dealing with rebranding strategies development. It’s critical for marketing diagrams to be both clear and eye catching. ConceptDraw Pyramid diagrams solution meet all these requirements and can be successfully applied for creating and presenting various marketing pyramidal diagrams.