Value Stream Mapping Symbols
Value Stream Mapping is a graphical technique that provides possibilities to improve analysis of a manufacturing process, at the stage of the transferring information or materials that required to deliver a product or service to the customer.
VSM symbols are the best for a production process designing.
Value Stream Mapping ensures a core analysis' items in a comprehensive graphical approach:
- The interplay between all of a manufacturing processes.
- The communications and materials during the complete production process.
- Efficiencies and losses of complex systems.
- Elaborate and implement actions that push forward organization's culture changes.
The entire Value Stream Mapping method uses a graphical representation of the manufacturing process, factors' pros and cons, that all stakeholders can easily understand.
The new Value Stream Mapping solution found in the ConceptDraw Solution Park continues to extend the range of ConceptDraw DIAGRAM. This solution extends software with several templates and samples, also value stream mapping symbols for drawing Value Stream Diagrams.
Value Stream Mapping Symbols
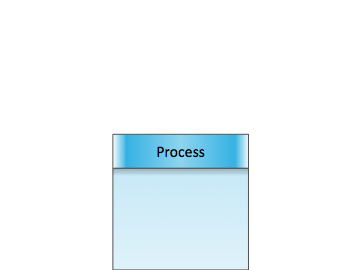
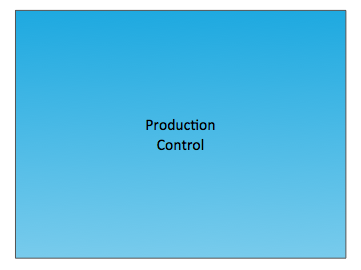 Production Control
Central production scheduling or control department, person or operation.
 Customer/Supplier
It is the usual starting point for material flow.
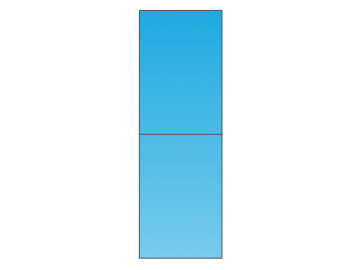
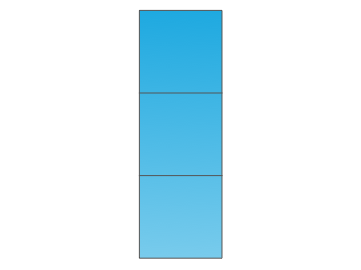
 Inventories
 Shipment
 Electronic Information Flow Electronic flow such as EDI, Internet, intranets, LANs, WANs.
 Information Flow
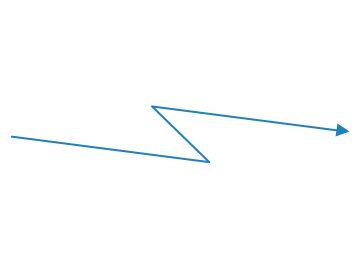
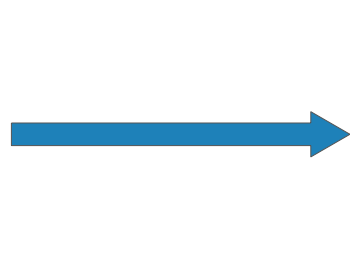
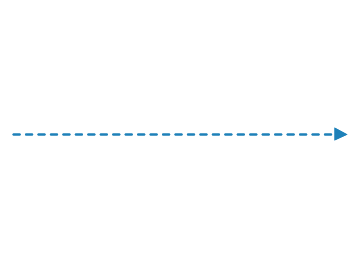
 Material Flow/ PUSH Arrow "Pushing" of Material from One Process to the Next Process.
 Manual Info
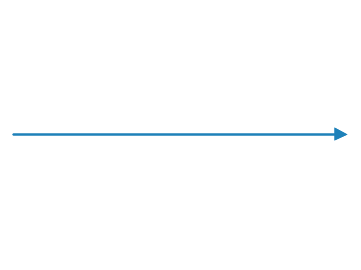
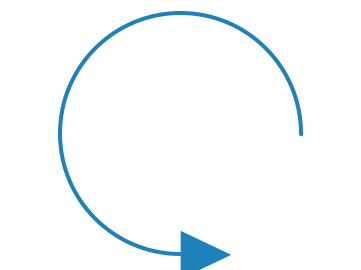
 Pull Arrow Pull movement between internal steps.

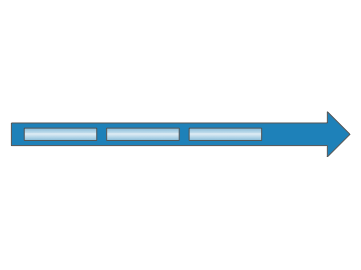
 Supermarket
 Safety Stock
 Material Pull
 Dedicated Process Process, operation, machine or department, through which material flows.
All these value stream mapping symbols from the Value Stream Mapping library of Value Stream Mapping Solution were professionally designed to facilitate a drawing process for ConceptDraw DIAGRAM users.

Example 1. Value Stream Mapping Symbols
Besides, all these objects are vector objects, so you can resize them without loss of quality, change their color to make your maps more bright and attractive.

Example 2. Value Stream Mapping Sample
This sample was created in ConceptDraw DIAGRAM using the value stream mapping symbols from the Value Stream Mapping Solution and shows the value stream in a manufacturing, production control and shipping processes. An experienced user spent 20 minutes creating this sample.
Use the Value Stream Mapping Solution for ConceptDraw DIAGRAM software to create your own professional looking Value Stream Maps quick, easy and effective.
All source documents are vector graphic documents. They are available for reviewing, modifying, or converting to a variety of formats (PDF file, MS PowerPoint, MS Visio, and many other graphic formats) from the ConceptDraw STORE. The Value Stream Mapping Solution is available for all ConceptDraw DIAGRAM or later users.
TEN RELATED HOW TO's:
If you have doubts about some situation, there are tools that might help you. First used in the Stanford Research Institute in the 60s, SWOT analysis is a great solution and if you need to build a strategy, this tool is very effective. As a result, you will get the clear idea of all the opportunities and threats you might face.
This matrix was build for a TOWS analysis performance. A TOWS analysis includes the same process of listing strengths, weaknesses, opportunities and threats as a SWOT analysis. But, unlike SWOT, TOWS analysis primarily takes into account threats and opportunities and then at least - weaknesses and strengths. This is also a is a strategic planning tool. Beyond making a matrix, the strategy manager should investigate ways the organization can take edge of opportunities and reduce threats by turning to advantage strengths and weaknesses. Making SWOT and TOWS analysis uses the same approach and outputs close results. ConceptDraw SWOT and TOWS Matrix Diagrams solution supplies templates of matrices, that help to list clearly the constituents of SWOT and TOWS analysis.
Picture: SWOT Analysis Solution - Strategy Tools
ConceptDraw DIAGRAM software supplied with HR Flowcharts Solution can effectively help in labour-intensive process of human resource development.
Picture: Human Resource Development
Related Solution:
This will let you create professional diagrams and charts using its simple RapidDraw option just in clicks. Take a look on a diagram you are looking for and create it fast and quickly.
Picture: Powerful Drawing Feature for Creating Professional Diagrams
The solution handles designs of any complexity, and the comprehensive library covers all key aspects of a transportation system. To further enhance your map design, there is the option to embed links, that can display station images or other relevant, important information. We have also included a set of samples in the solution, that show the possible real-world application — complex tube systems including the London Tube and New York City Subway show the level of detail possible when using the Metro Map Solution.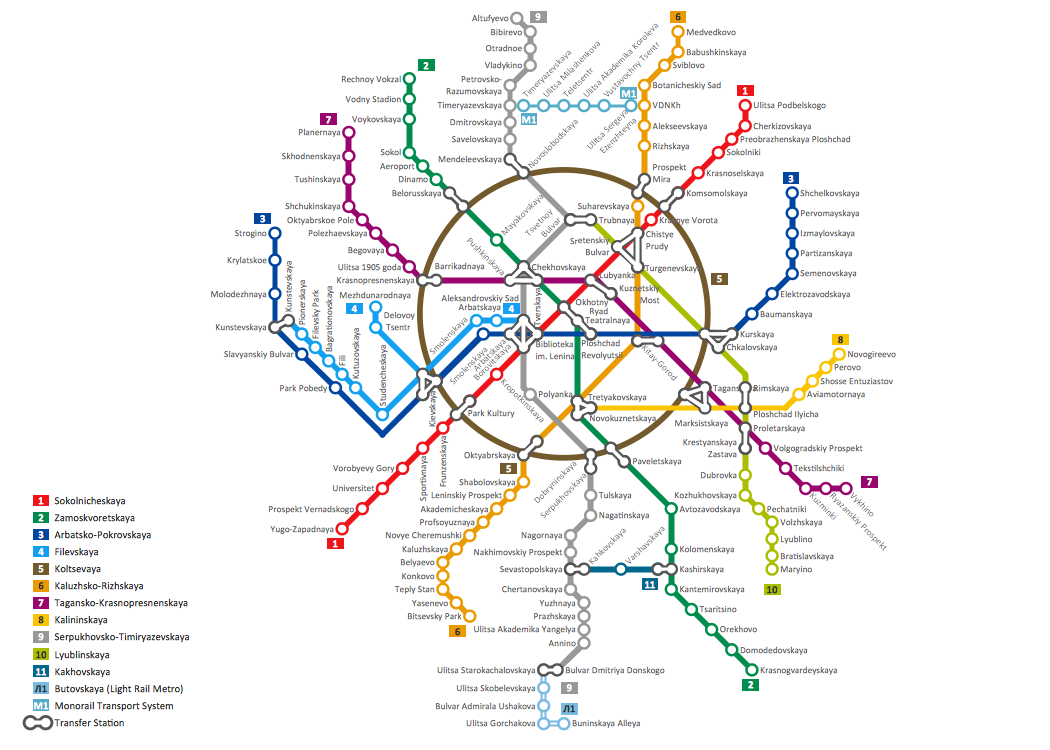
Picture: How to Draw Metro Map style infographics? Moscow, New York, Los Angeles, London
Related Solution:
ConceptDraw DIAGRAM is a software for making infographics illustrations. You can work with various components to build really impressive and easy-to-understand infographics design.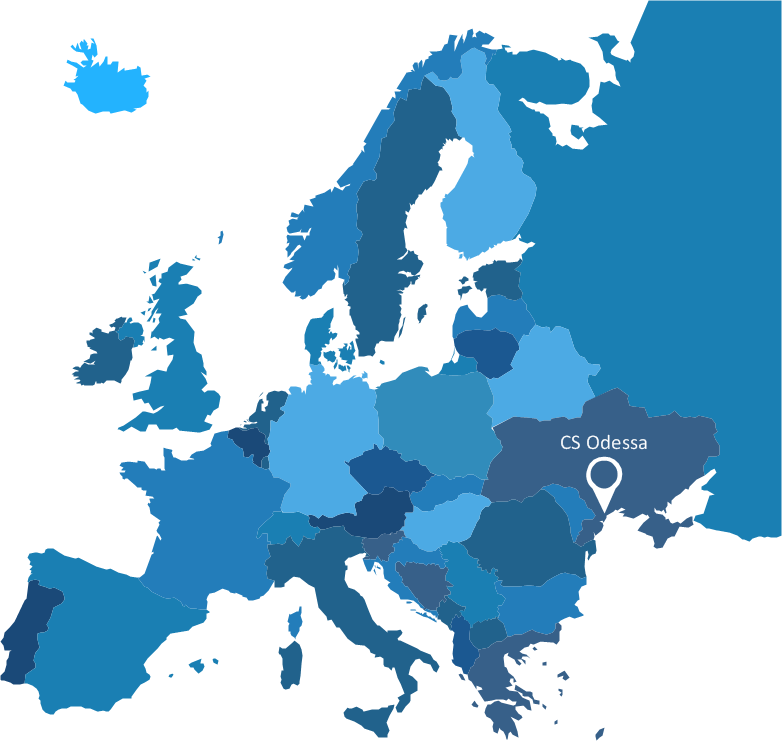
Picture: Spatial infographics Design Elements: Continental Map
The Value Stream Mapping solution found in the ConceptDraw Solution Park continues to extend the range of ConceptDraw DIAGRAM into a business graphics tool that can be used to document processes in any organization.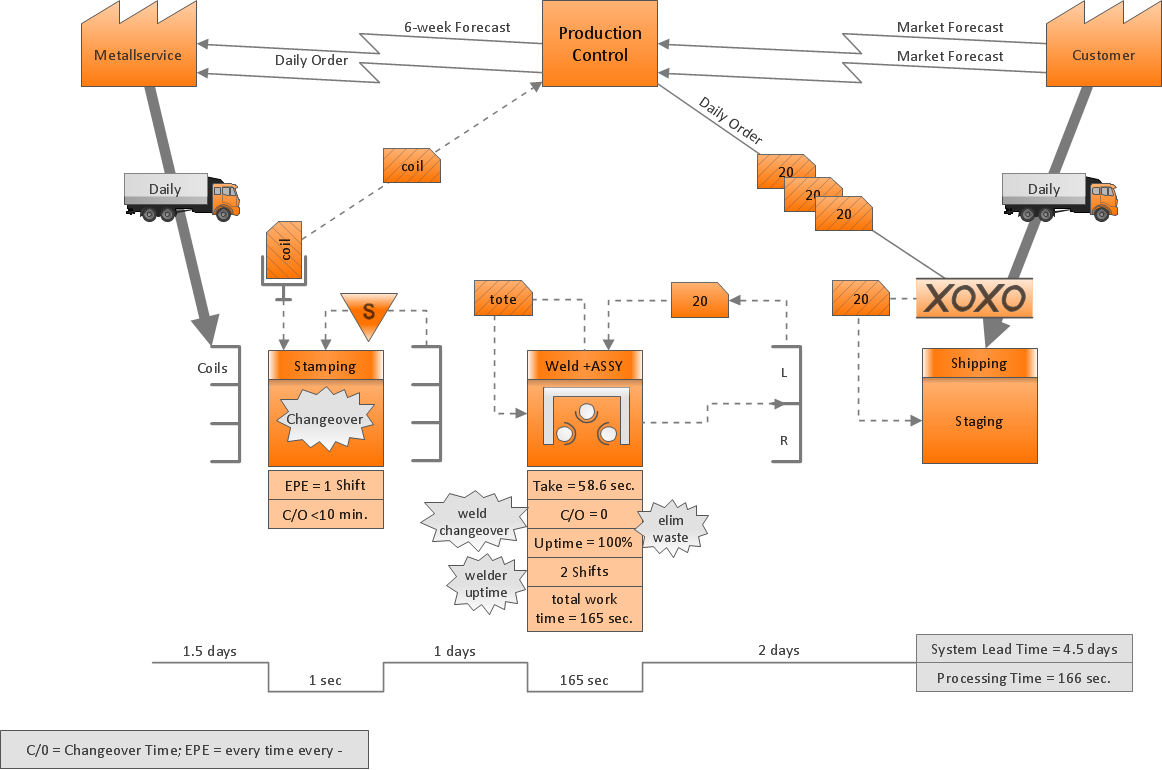
Picture: Value Stream Management
Related Solution:
Use Case Diagrams technology. Using visual graphical objects IDEF1 standard allows to model information interrelations.
Picture: IDEF1 standard
ConceptDraw is your tool for driving social integration and managing change across and streamline social media processes of your organisation.This tool keeps the entire team on the same page allowing you to realize your social media strategy, improve the quality of your answers, and minimize the time it takes to respond.
Picture: Social Media Response Management DFD Charts - software tools
Related Solution:
Constant improvement of key performance indicators that are related to quality is a step in the right direction for a company interested in market growth.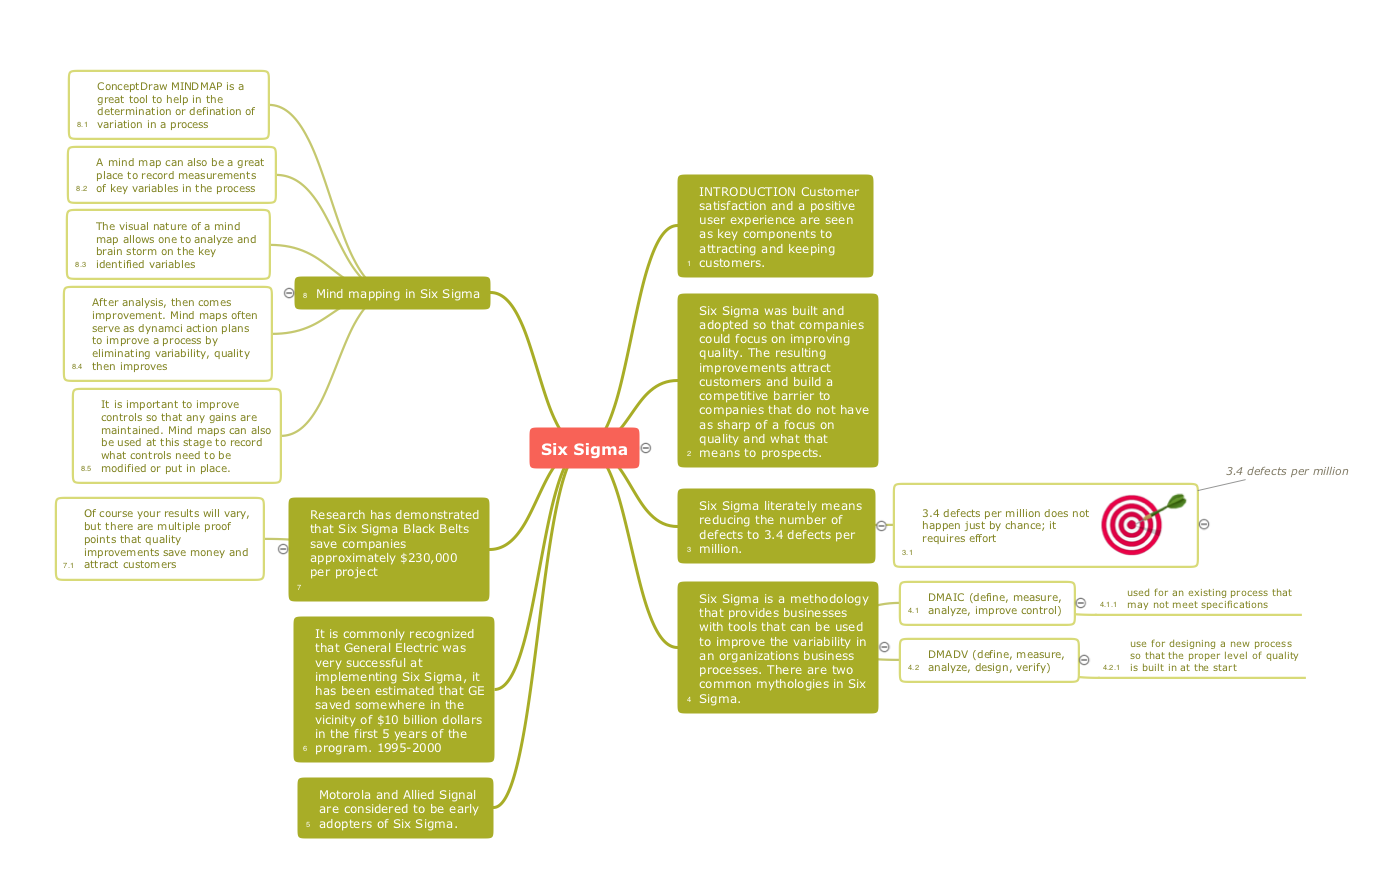
Picture: Quality Improvement
Related Solution:
The Quality Mind Map Solution extends ConceptDraw MINDMAP with the addition of a number of Quality Management Mind Maps (Presentations, Meeting Agendas, and problem-solving techniques).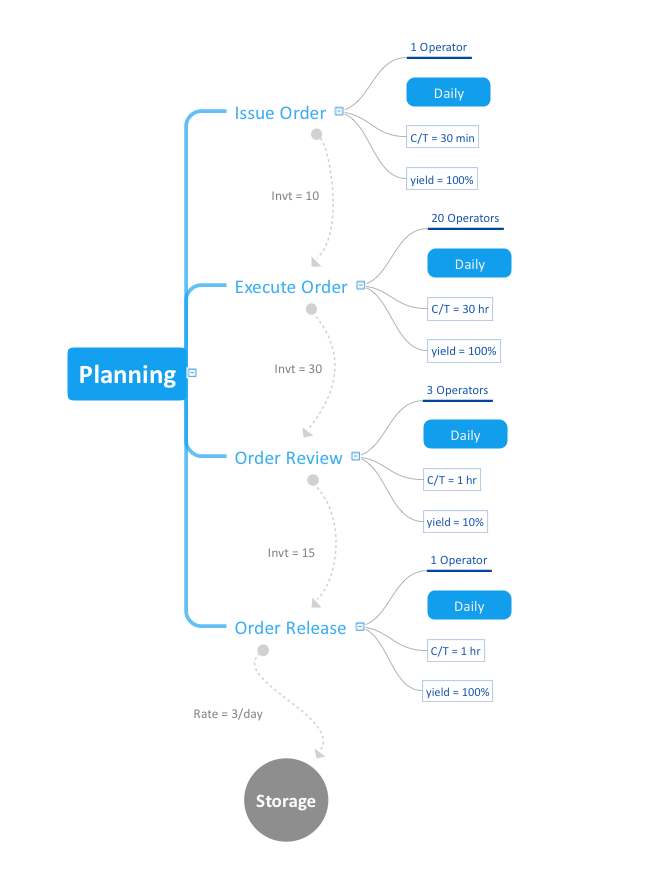
Picture: Quality Mind Map Solution
Related Solution:
