Geo Map — USA — Illinois
Maps of USA — State of Illinois
"Illinois is a state in the Midwestern United States. It is the 5th most populous and 25th most extensive state, and is often noted as a microcosm of the entire country. With Chicago in the northeast, small industrial cities and great agricultural productivity in central and northern Illinois, and natural resources like coal, timber, and petroleum in the south, Illinois has a diverse economic base and is a major transportation hub. The Port of Chicago connects the state to other global ports from the Great Lakes, via the Saint Lawrence Seaway, to the Atlantic Ocean; as well as the Great Lakes to the Mississippi River, via the Illinois River. For decades, O'Hare International Airport has been ranked as one of the world's busiest airports. Illinois has long had a reputation as a bellwether both in social and cultural terms and politics." [Illinois. Wikipedia]
The vector stencils library Illinois contains contours for ConceptDraw DIAGRAM diagramming and vector drawing software. This library is contained in the Continent Maps solution from Maps area of ConceptDraw Solution Park.
Use the Illinois library to draw thematic maps, geospatial infographics and vector illustrations for your business documents, presentations and websites.
Geo Map — USA — State of Illinois

Geo Map — USA — Illinois Contour

Geo Map - USA

Geo Map — USA Contour

Geo Map — Contours of Territories of the United States

See Also Territories of the United States Geo Maps :
TEN RELATED HOW TO's:
Great Britain, also known as Britain, is an island in the North Atlantic off the north-west coast of continental Europe. With an area of 209,331 km2 (80,823 sq mi), it is the largest island in Europe and the ninth-largest in the world.
How to design the Map of UK fast and easy? It is incredibly convenient to use special software. ConceptDraw DIAGRAM diagramming and vector drawing software offers the Map of UK Solution from the Maps Area of ConceptDraw Solution Park specially developed to make easier drawing the maps of UK counties, various UK related thematic maps and cartograms on their base.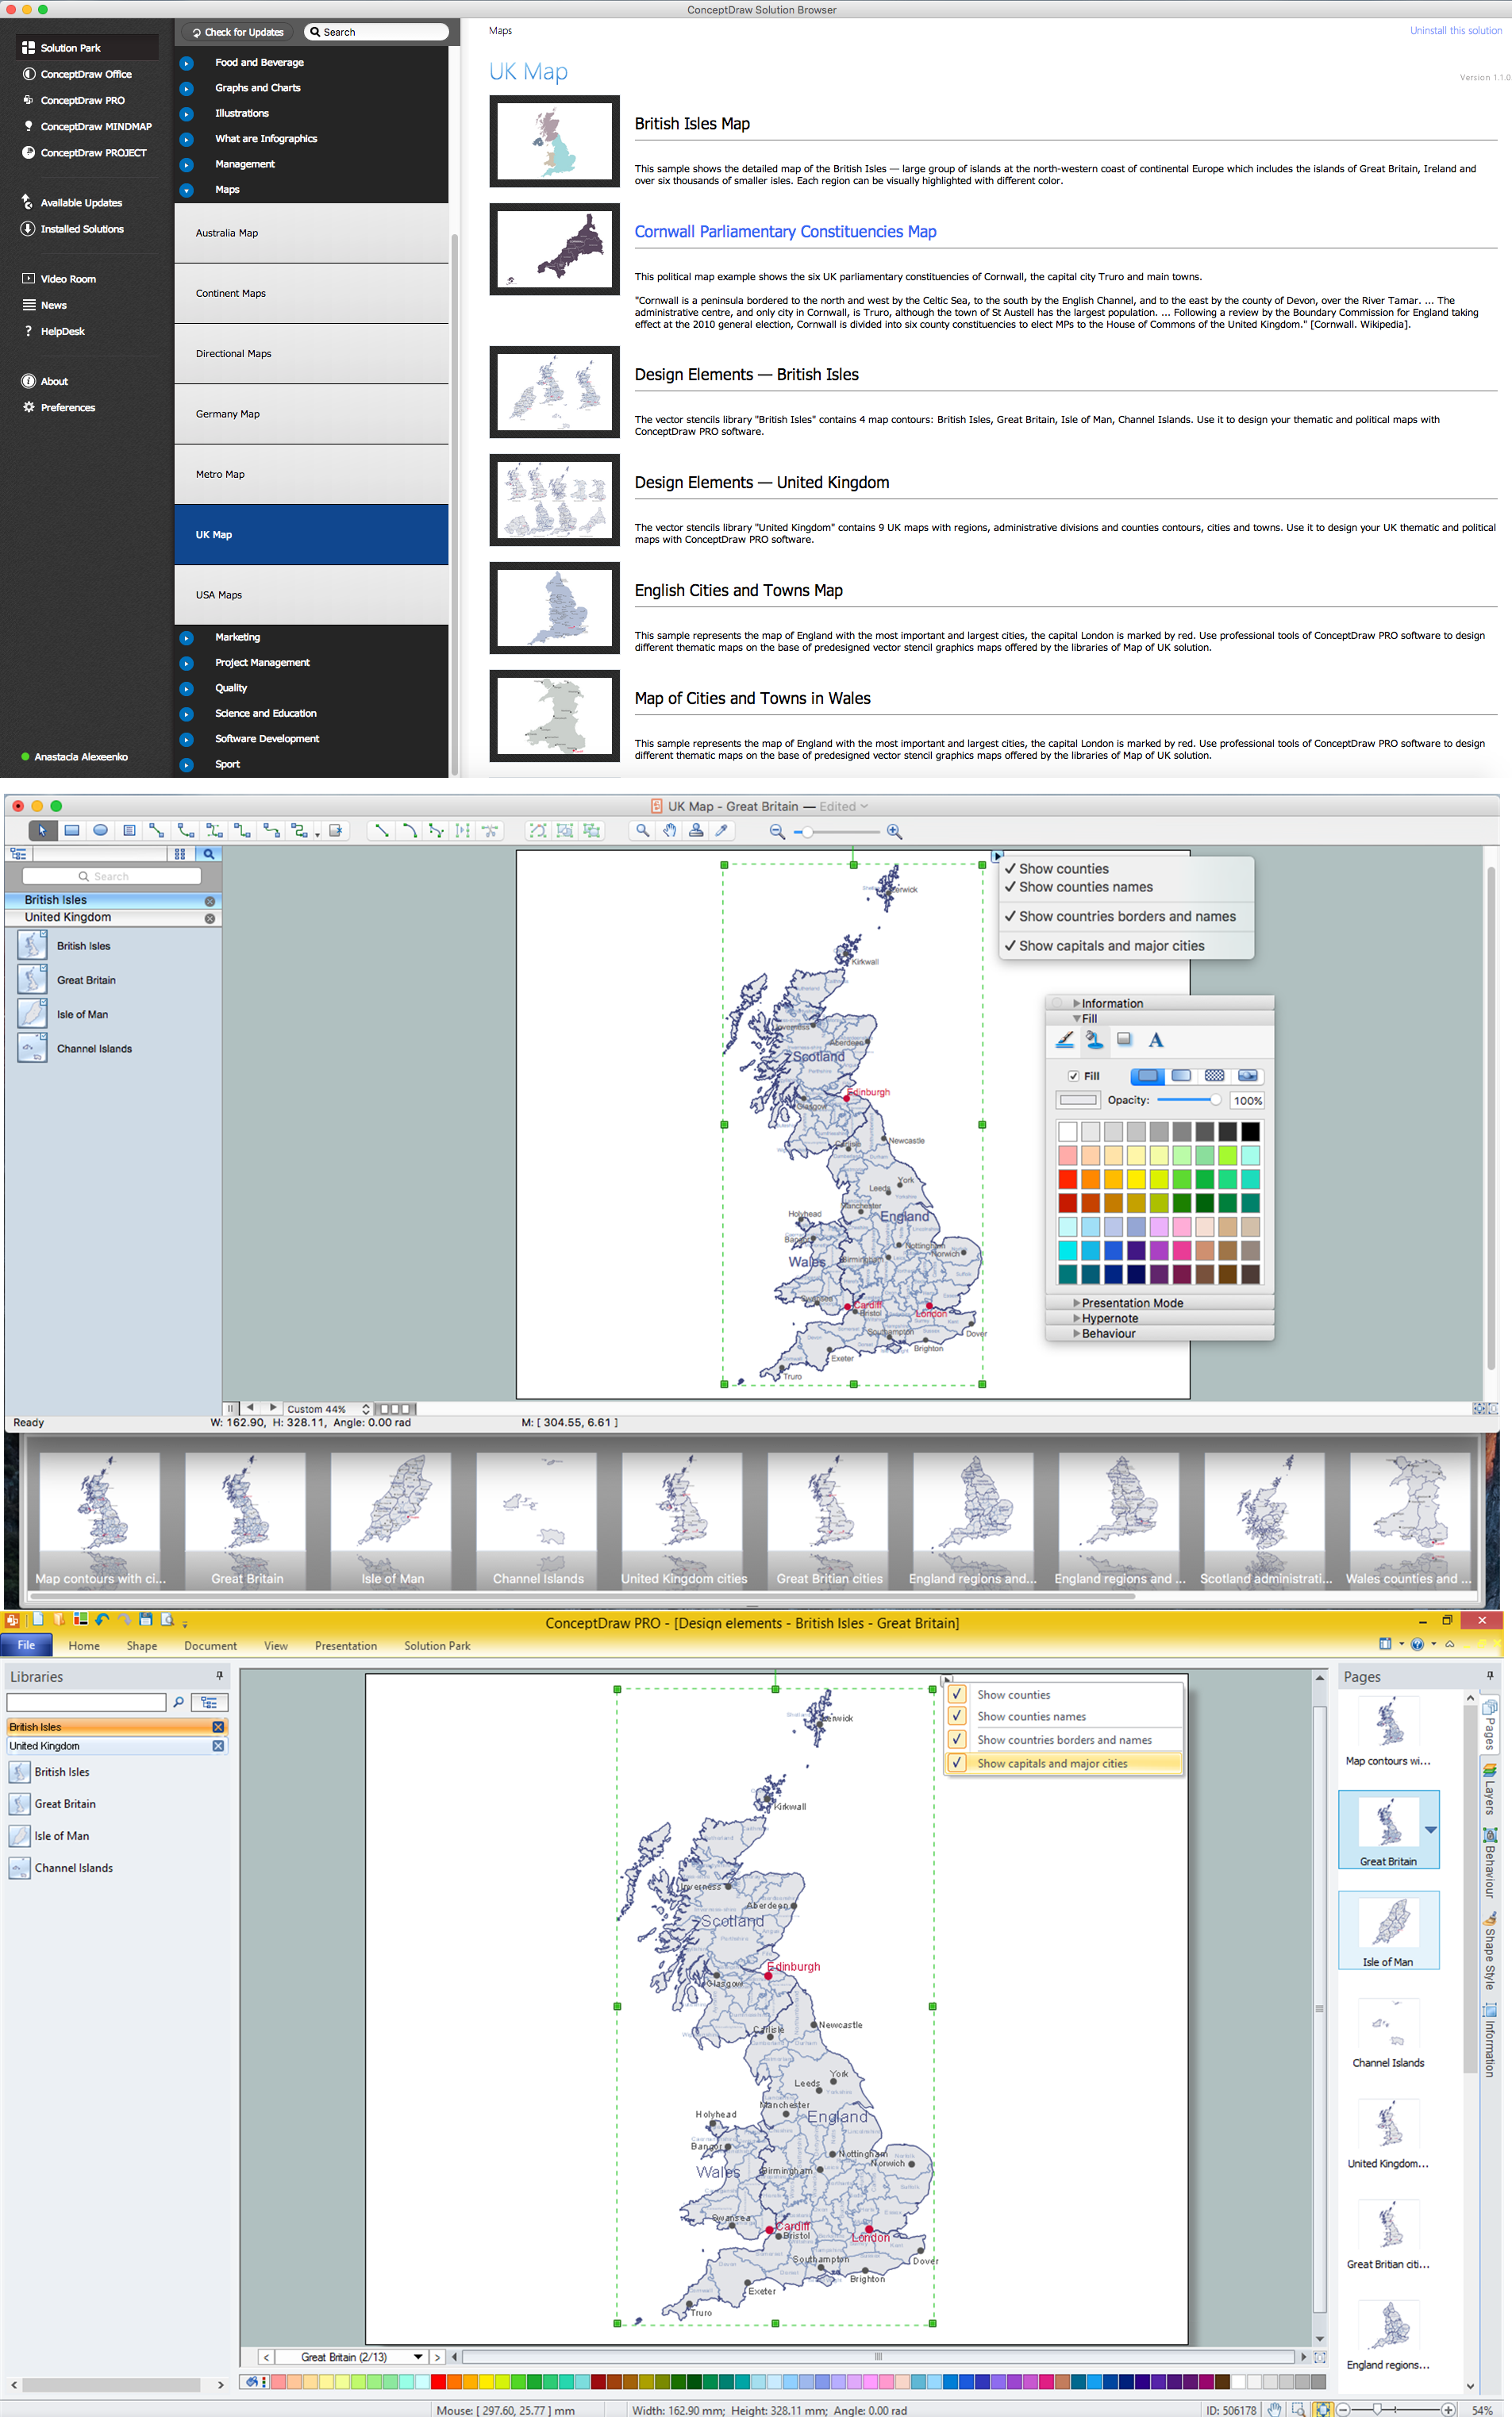
Picture: Map of UK — Great Britain
Related Solution:
Samples, templates and libraries contain vector clip art for drawing the Road Transport Illustrations.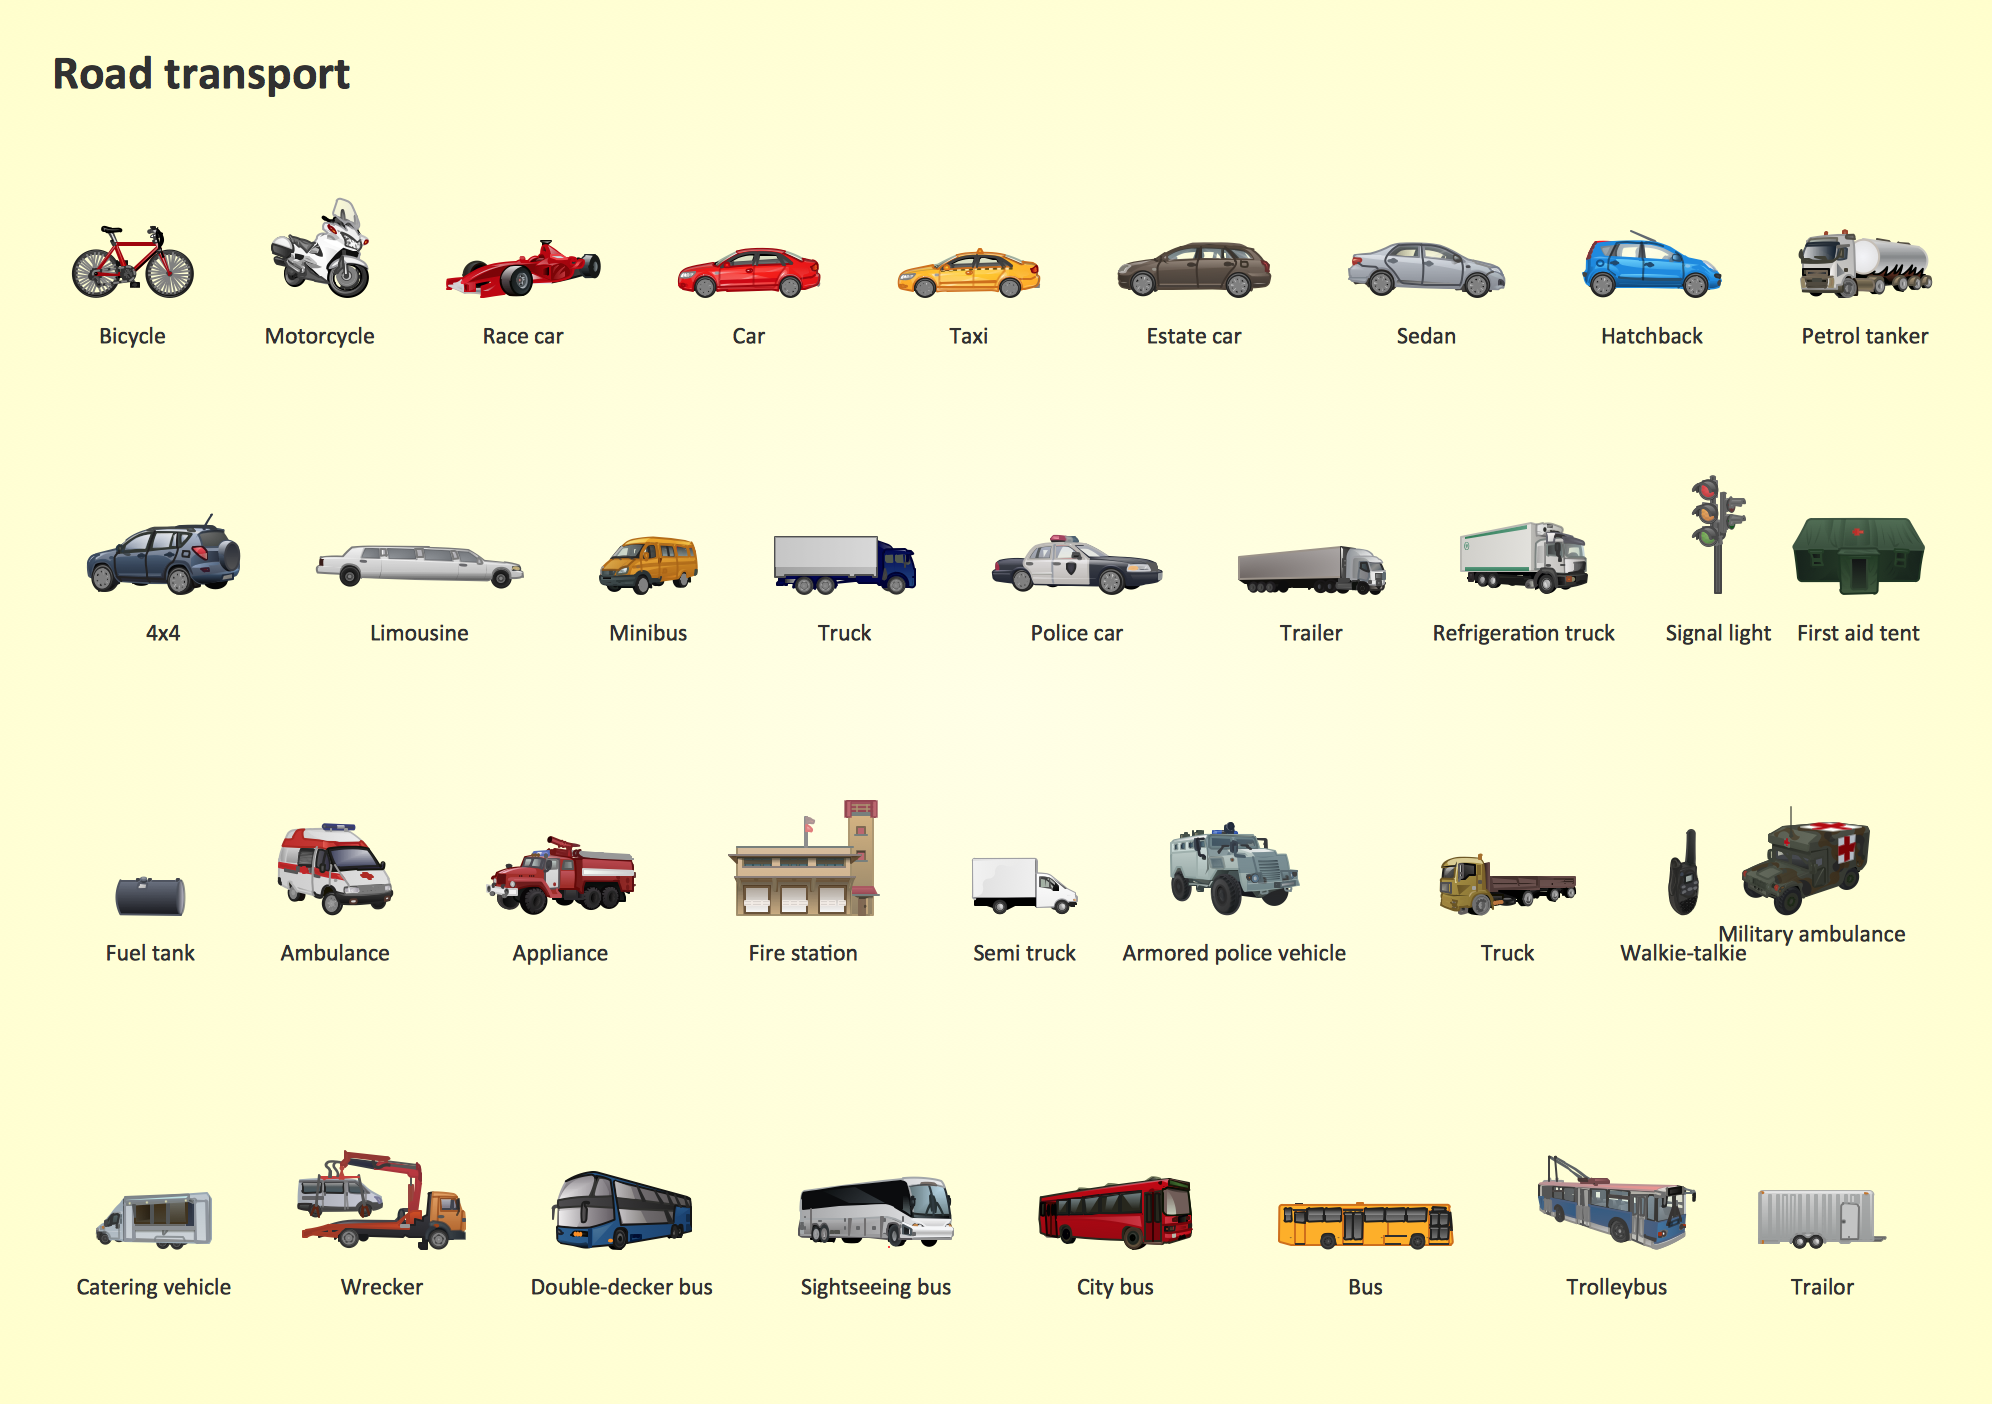
Picture: Road Transport - Design Elements
Related Solution:
Iowa is a U.S. state in the Midwestern United States, a region sometimes called the American Heartland.
The vector stencils library Iowa contains contours for ConceptDraw DIAGRAM diagramming and vector drawing software. This library is contained in the Continent Maps solution from Maps area of ConceptDraw Solution Park.
Picture: Geo Map — USA — Iowa
Related Solution:
Delaware is a U.S. state located on the Atlantic Coast in the Northeastern and Mid-Atlantic regions of the United States.
The vector stencils library Delaware contains contours for ConceptDraw DIAGRAM diagramming and vector drawing software. This library is contained in the Continent Maps solution from Maps area of ConceptDraw Solution Park.
Picture: Geo Map — USA — Delaware
Related Solution:
ConceptDraw DIAGRAM diagramming and vector drawing software aspires to help its users in the hiring process and offers a powerful HR Flowcharts Solution from the Management Area of ConceptDraw Solution Park.
Picture: Hiring Process
Related Solution:
ConceptDraw DIAGRAM is a professional software for building flowcharts quickly with auto-connect technology.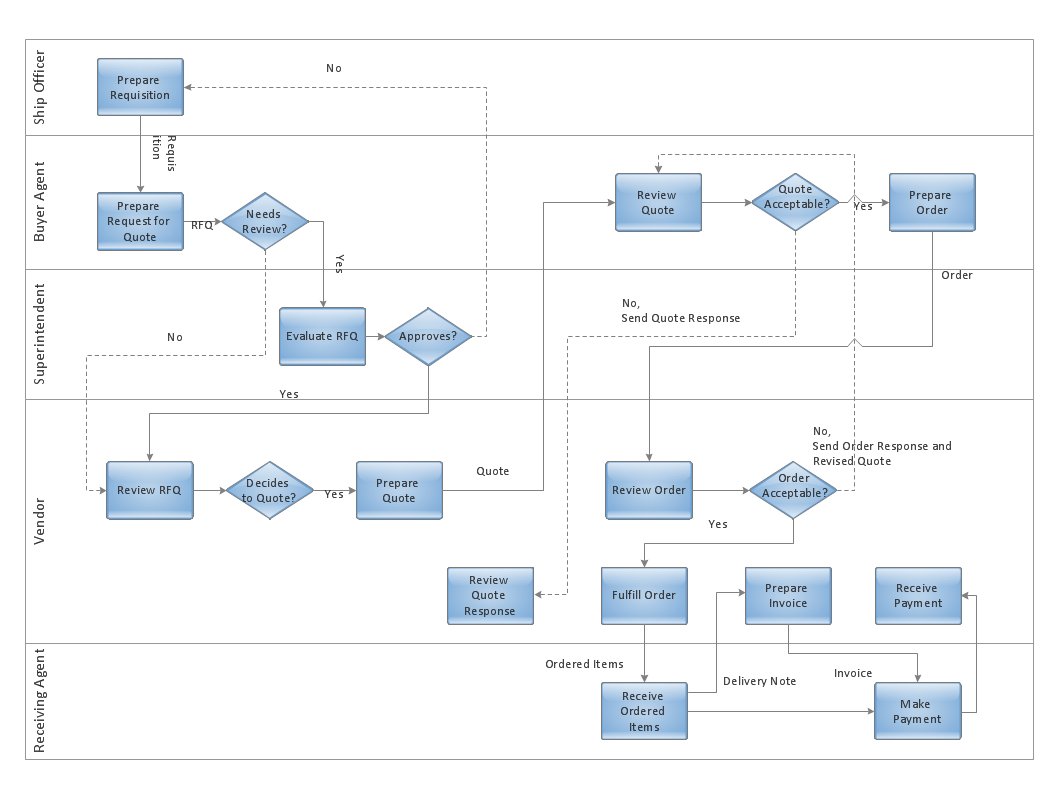
Picture: Build a Flowchart Quickly With AutoConnect
Related Solution:
Florida is a state in the southeastern region of the United States, bordered to the west by the Gulf of Mexico, to the north by Alabama and Georgia, to the east by the Atlantic Ocean, and to the south by the Straits of Florida.
The vector stencils library Florida contains contours for ConceptDraw DIAGRAM diagramming and vector drawing software. This library is contained in the Continent Maps solution from Maps area of ConceptDraw Solution Park.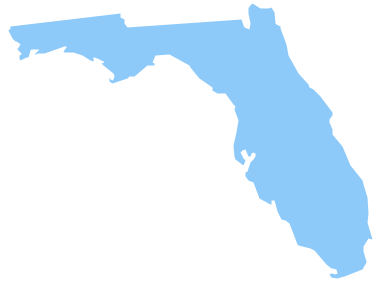
Picture: Geo Map — USA — Florida
Related Solution:
Connecticut is the southernmost state in the northeastern region of the United States known as New England.
The vector stencils library Connecticut contains contours for ConceptDraw DIAGRAM diagramming and vector drawing software. This library is contained in the Continent Maps solution from Maps area of ConceptDraw Solution Park.
Picture: Geo Map — USA — Connecticut
Related Solution:
The basis of the health is a proper nutrition. The healthy meal recipes will effectively help you in easy cooking healthy and at the same time delicious food.
Cooking masters and culinary experts who create recipes and publish them in modern magazins and on web sites, all they strive to make the recipes the most attractive and appetizing, and need help of powerful designing software. ConceptDraw DIAGRAM diagramming and vector drawing software extended with Health Food solution from the Food and Beverage area of ConceptDraw Solution Park - it is exactly what is needed for designing and decoration menu and healthy meal recipes of any complexity.
Picture: Healthy Meal Recipes
Related Solution:
A requisition form is one of the documents used for accounting in different manufacturing processes. There are two main types of requisition: a purchasing requisition and material requisition and difference between them is significant. Creating a flowchart might help you in understanding all the details of accounting process.
Flowcharts are a best visual method for dividing a large and complicated procedure into a several little clear pieces. The main value-ability of an effective flowchart is its simpleness. Material requisition flowcharts are used to document the process of relationships between the different departments and the purchasing department within an organization. The flow chart gives the step-by-step guide on how is carried out the procurement process of the materials necessary for the functioning of the organization. This type of flowchart along with many other business flowcharts, one can easy create using ConceptDraw Flowcharts solution.
Picture: Material Requisition Flowchart. Flowchart Examples
Related Solution:


