How to Prepare Learning Presentations for Training
Using the ConceptDraw Social Media Response solution improves quality of content in social media and helps build an active customer community. It allows companies to be more effective in timely messaging thanks to the ability for rapid response to a customer′s post in social media. This saves budget for companies who use social media for promoting and as a lead generation tool.
The Social Media Response solution creates interactive social media flow charts and action mind maps. The solution includes a video tutorial and a number of samples helping social media teams refine and organize their response process. There are materials to help trainers and consultants develop a social media strategy and provide training for social media groups on how to effectively accomplish their daily work.
Tips for preparing a learning presentation intended for training a team.
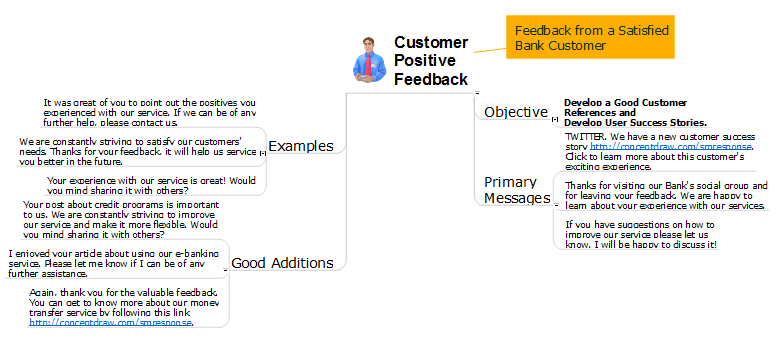
Sample 1. Customer Positive Feedback
See also Samples:
-
Mind Maps
-
Idea Communication
-
Marketing — Social Media
NINE RELATED HOW TO's:Design efficiently the technical flow charts in ConceptDraw DIAGRAM software for various fields and provide ✔️ clarity, ✔️ accuracy, ✔️ usability, ✔️ simple communication, analysis, and improvement Picture: Technical Flow Chart ExampleRelated Solution:UML Interaction Overview Diagram schematically shows a control flow with nodes and a sequence of activities that can contain interaction or sequence diagrams.
 Picture: Interaction Overview DiagramDon't let your first glance fool you. ConceptDraw is a lot easier to use than it looks. Use its cross-functional templates and library as basics to get started. All you need to know are a few basic steps and terms. ConceptDraw Arrows10 Technology is a new age in drawing software. Use it for process flows and its new rapid draw feature enables to draw an impressive charts in a seconds.
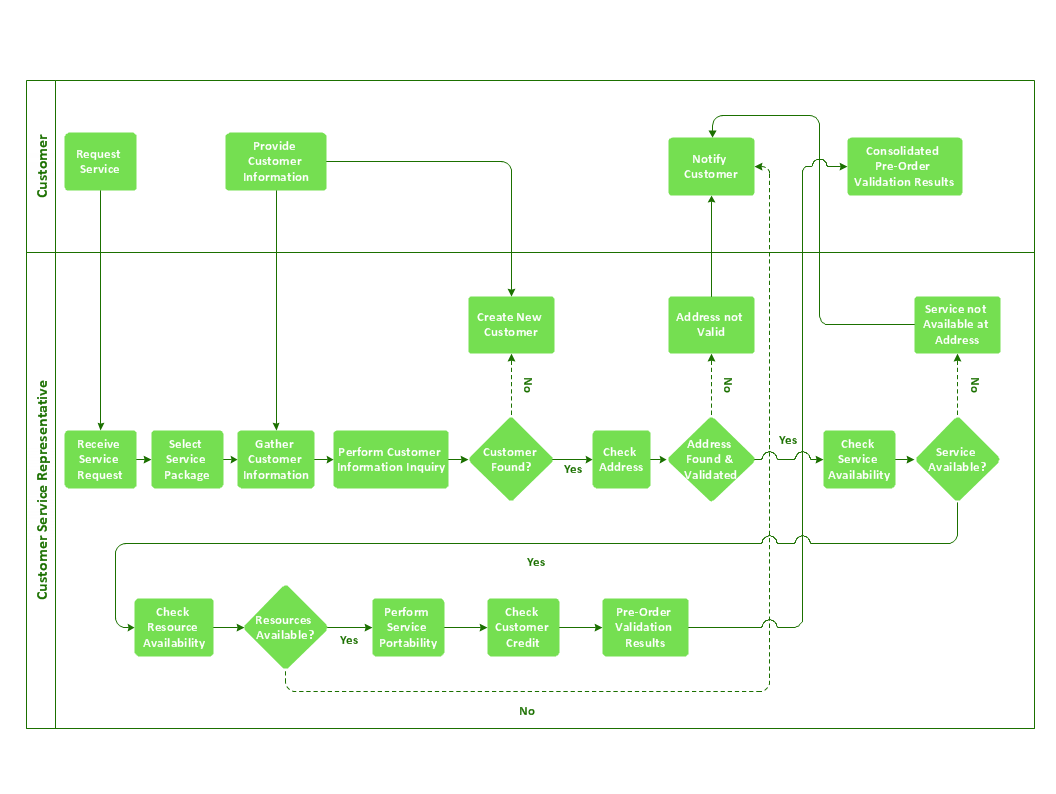 Picture: Cross-Functional Flowchart BasicsConceptDraw DIAGRAM is a powerful tool that helps you create a Cross Functional Flow Chart quickly and easily. Fine-tuning the objects in ConceptDraw DIAGRAM allows you to create a really professional finished article. ConceptDraw Arrows10 Technology gives drawing connectors a smart behavior that provides quick and precise placement, allows for easy changes and automatic rearrangement.
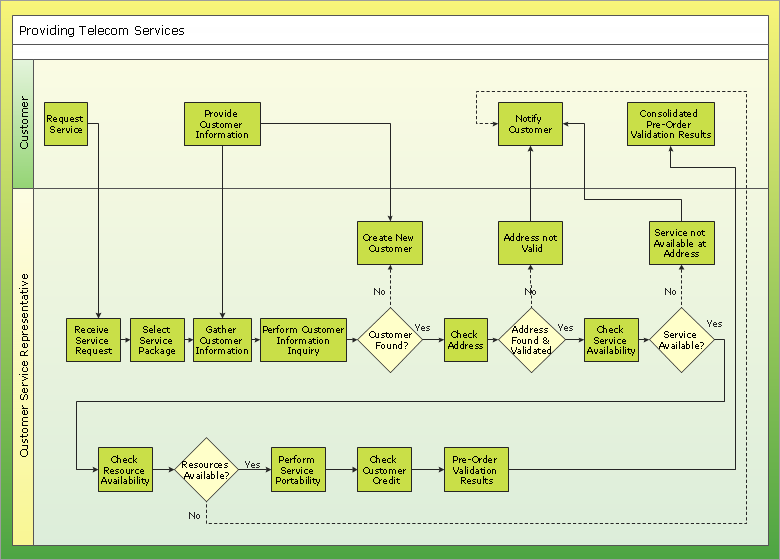 Picture: Double-headed Cross Functional FlowchartRelated Solution:ConceptDraw DIAGRAM has extensive export capabilities which allow you to export your drawing to
MS PowerPoint file formats. So, you can create effective presentations right from yourConceptDraw DIAGRAM documents.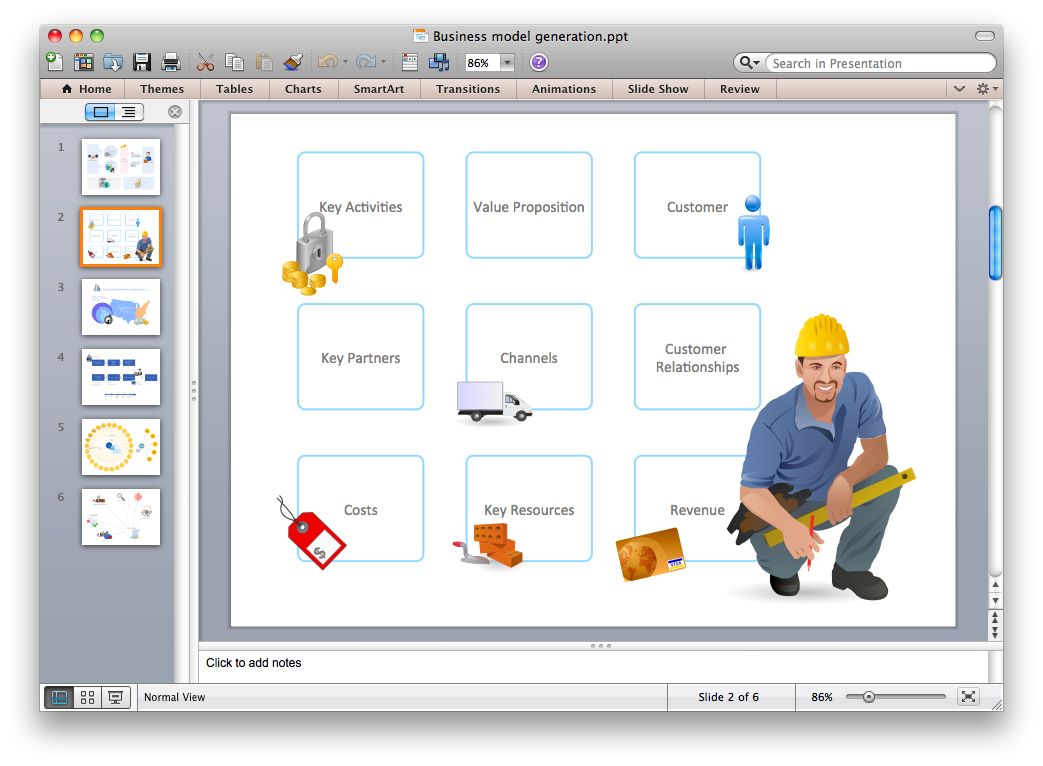 Picture: Export from ConceptDraw DIAGRAM Document to PPT or PPTX (MS PowerPoint®) FileUse ConceptDraw DIAGRAM diagramming and business graphics software to draw your own flowcharts of computer algorithms.
 Picture: Process Flow app for macOSRelated Solution:The Process Flowchart or Process Flowchart Diagram (PFD) is a visual representation relations between major parts of the system, the steps in a process, and even connections between various systems. The possibility to easy create professional-looking and attractive Process Flowcharts, Business Process Diagrams and Maps which visualize the steps of complex processes is provided by Business Process Diagram Solution from the Business Processes Area of ConceptDraw Solution Park and 16 libraries with 230 process flowchart symbols from BPMN 1.2 and BPMN 2.0.
 Picture: Process Flowchart SymbolsRelated Solution:ConceptDraw software has been developed for drawing any type of flowchart. Use RapidDraw - thi is flowchart maker technology for adding new objects to a flowchart quickly. This is technology of fast drawing technique focused on making great-looking flowcharts quickly. To get started using it download flowchart maker ConceptDraw DIAGRAM.
 Picture: Flowchart Program MacRelated Solution:Describing a workflow or approval process can take hours and be too complicated, especially since there are options to do it quickly and vividly. Diagrams called flowcharts replace long paragraphs of boring text and represent information in a graphic way. You can draw one on paper or you can use flowchart software to do it quickly and scalable. This kind of software is easy to use and you don’t need any special skills to start using it. In addition, there are a lot examples and predesigned templates on the Internet. Flowcharts are a best tool for staking out a huge and complex process into some small readable parts. Surely, flowcharts can be drawn manually but the use of standard symbols that make it clear for a wide audience makes a software tool preferred for this task. The core for a successful flowchart is its simplicity. That is why often before beginning making flowchart through software, people draw the sketch on a piece of paper. Designing an effective flowchart means the combination of the data needed to be shown and the simplicity with which you depict it.
 Picture: Flowchart Software: A Comprehensive GuideRelated Solution:ConceptDrawDIAGRAM 18