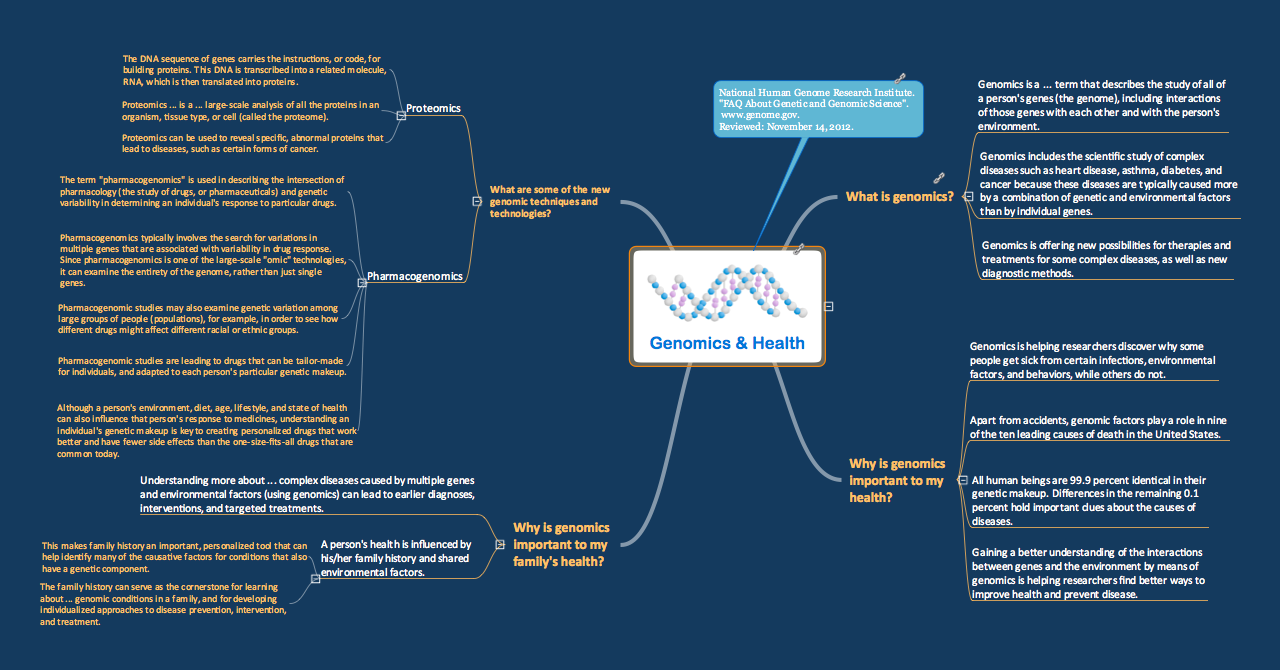
Sample 1. Genomics and Health mind map
for ConceptDraw eLearning for Skype solution
This map was created from content found at "FAQ About Genetic and Genomic Science" (National Human Genome Research Institute, www.genome.gov) and shows how simple in is to use a map structure to explain complex subjects.
The content from this map and maps similar to this can be used with the eLearning for Skype solution for ConceptDraw MINDMAP to present complex information in a simplified manner.
See also Samples:
TEN RELATED HOW TO's:
This sample was created in ConceptDraw DIAGRAM diagramming and vector drawing software using the UML Class Diagram library of the Rapid UML Solution from the Software Development area of ConceptDraw Solution Park.
This sample describes the use of the classes, the generalization associations between them, the multiplicity of associations and constraints. Provided UML diagram is one of the examples set that are part of Rapid UML solution.
Picture: UML Class Diagram Generalization ExampleUML Diagrams
Related Solution:
Astronomy solution provides the Stars and Planets library with wide variety of solar system symbols. You can find here vector objects of solar system, of stars and planets of the universe.
To quickly draw any astronomy illustration: create new document and simply drag the needed solar system symbols from the Stars and Planets library, arrange them and add the text. You can also use the predesigned templates and samples from the ConceptDraw STORE as the base for your own sun solar system illustrations, astronomy and astrology drawings.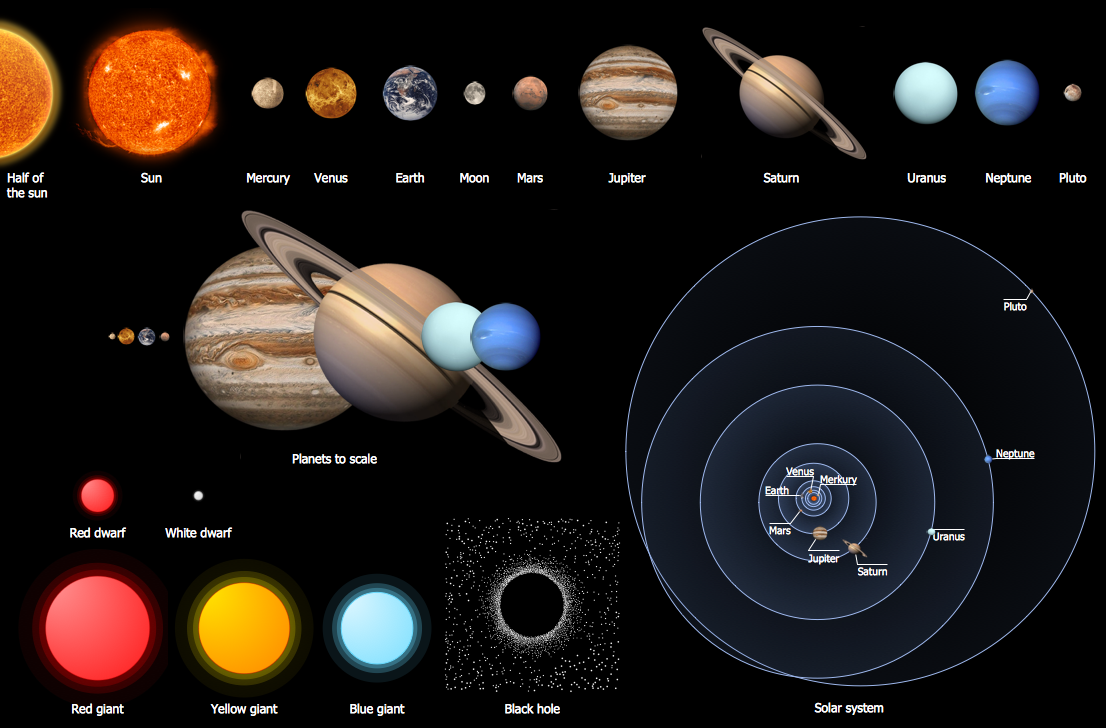
Picture: Solar System Symbols
Related Solution:
Biology is incredibly interesting and useful natural science which studies all living things on the earth (people, animals, plants), structure, functions, interactions, evolution of living organisms. Biologists of the whole world use actively illustrations and drawings in your science and education activity. To facilitate their task of biology drawing, ConceptDraw DIAGRAM diagramming and vector drawing software was extended with Biology solution from the Science and Education area. Now, ConceptDraw DIAGRAM is a powerful biology drawing software.
Picture: Biology Drawing Software
Related Solution:
It makes it easy to share your notes with coworkers, associates, classmates, and friends.
Picture: The Mind Map Evernote Possibilities
Related Solution:
Succeed with ConceptDraw DIAGRAM and ConceptDraw MINDMAP software in ✔️ SWOT analysis, ✔️ creating visually appealing SWOT Matrices and SWOT Mind Maps, ✔️ strategic planning, ✔️ decision-making, ✔️ risk management, ✔️ market positioning, ✔️ company development, ✔️ identify emerging trends and customer needs, ✔️ identifying and eliminating external challenges, ✔️ communication and collaboration, ✔️ resource allocation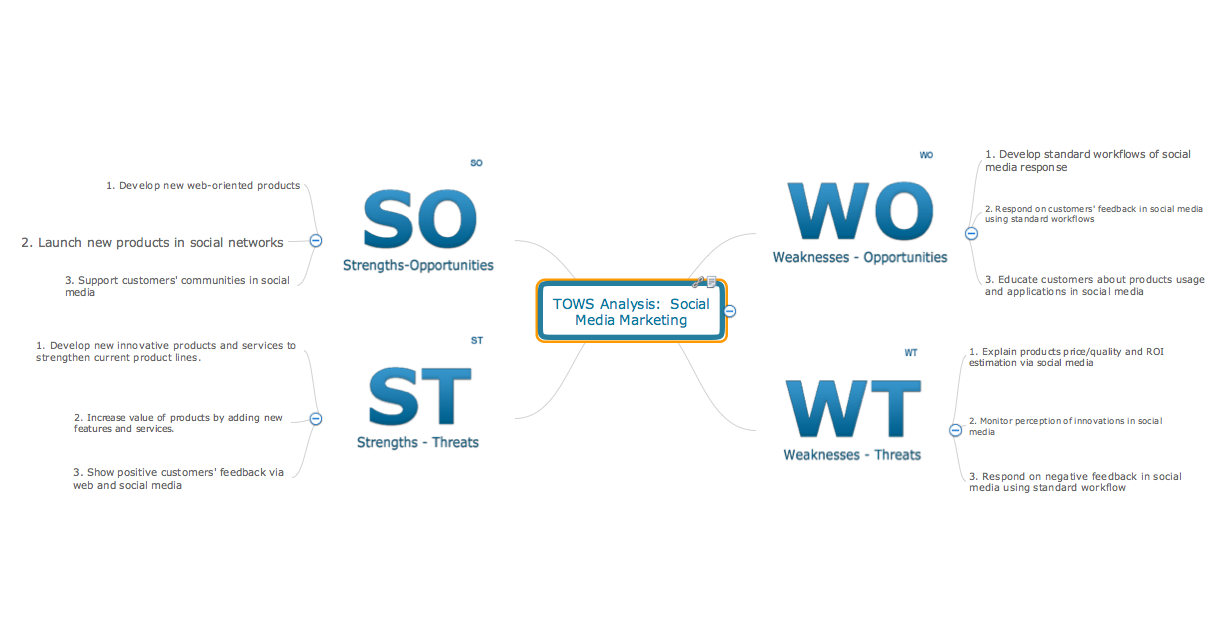
Picture: SWOT Analysis Marketing Tool: A Comprehensive Guide
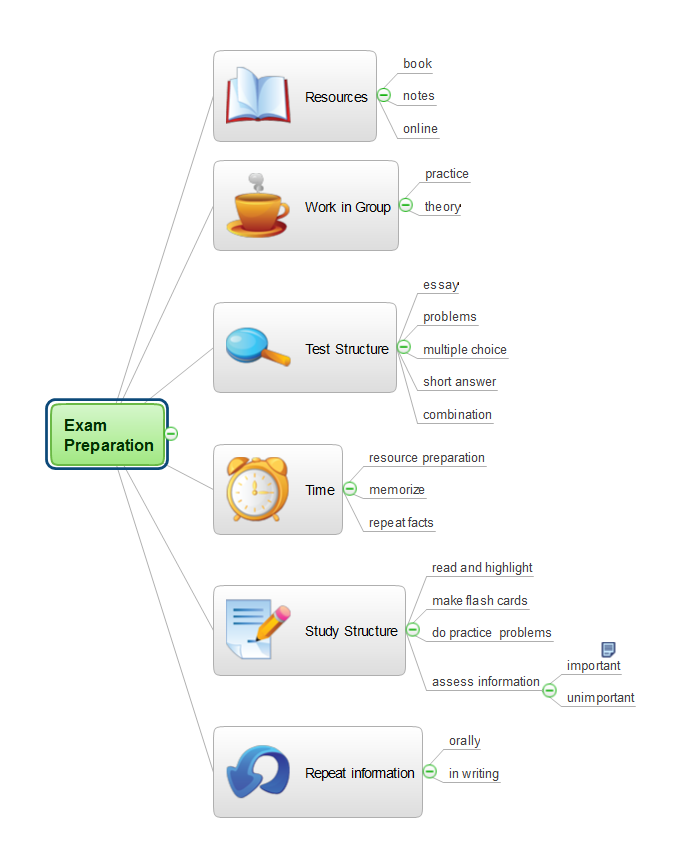
Picture: Exam Preparation Mind Map
Related Solution:
Example of Organizational Chart - Lots of organization chart examples created by ConceptDraw Organizational Chart Software. Include company organizational chart, hospital organizational chart, hotel Organizational chart, corporate organizational chart samples etc
Picture: Example of Organizational Chart
Related Solution:
While creating flowcharts and process flow diagrams, you should use special objects to define different statements, so anyone aware of flowcharts can get your scheme right. There is a short and an extended list of basic flowchart symbols and their meaning. Basic flowchart symbols include terminator objects, rectangles for describing steps of a process, diamonds representing appearing conditions and questions and parallelograms to show incoming data.
This diagram gives a general review of the standard symbols that are used when creating flowcharts and process flow diagrams. The practice of using a set of standard flowchart symbols was admitted in order to make flowcharts and other process flow diagrams created by any person properly understandable by other people. The flowchart symbols depict different kinds of actions and phases in a process. The sequence of the actions, and the relationships between them are shown by special lines and arrows. There are a large number of flowchart symbols. Which of them can be used in the particular diagram depends on its type. For instance, some symbols used in data flow diagrams usually are not used in the process flowcharts. Business process system use exactly these flowchart symbols.
Picture: Flowchart Symbols: Meaning and Examples
Related Solution:
Use ConceptDraw MINDMAP for creative thinking, planning, organization, problem solving, presentations, decision making, note taking, team brainstorming and other tasks.
Picture: Applications
You can use text with any conceptDraw connectors to describe relationships between objects.
Add text to connectors the same way you add text to any object - doubleclick a connector and type.
Picture: ConceptDraw Arrows10 Technology