Interactive Training Tool
Interactive Training via Skype
On present time remote learning is the trend in numerous of disciplines that people want to learn. For distance training vitally to have simple online conference tools. For making educational process interactive you need to train via Skype and you need for this our best software tool ConceptDraw MINDMAP . ConceptDraw Remote Presentation for Skype solution makes the remote learning, distance training and webinars similar to university educational process. Also you can share presentation imported from PowerPoint with ConceptDraw MINDMAP .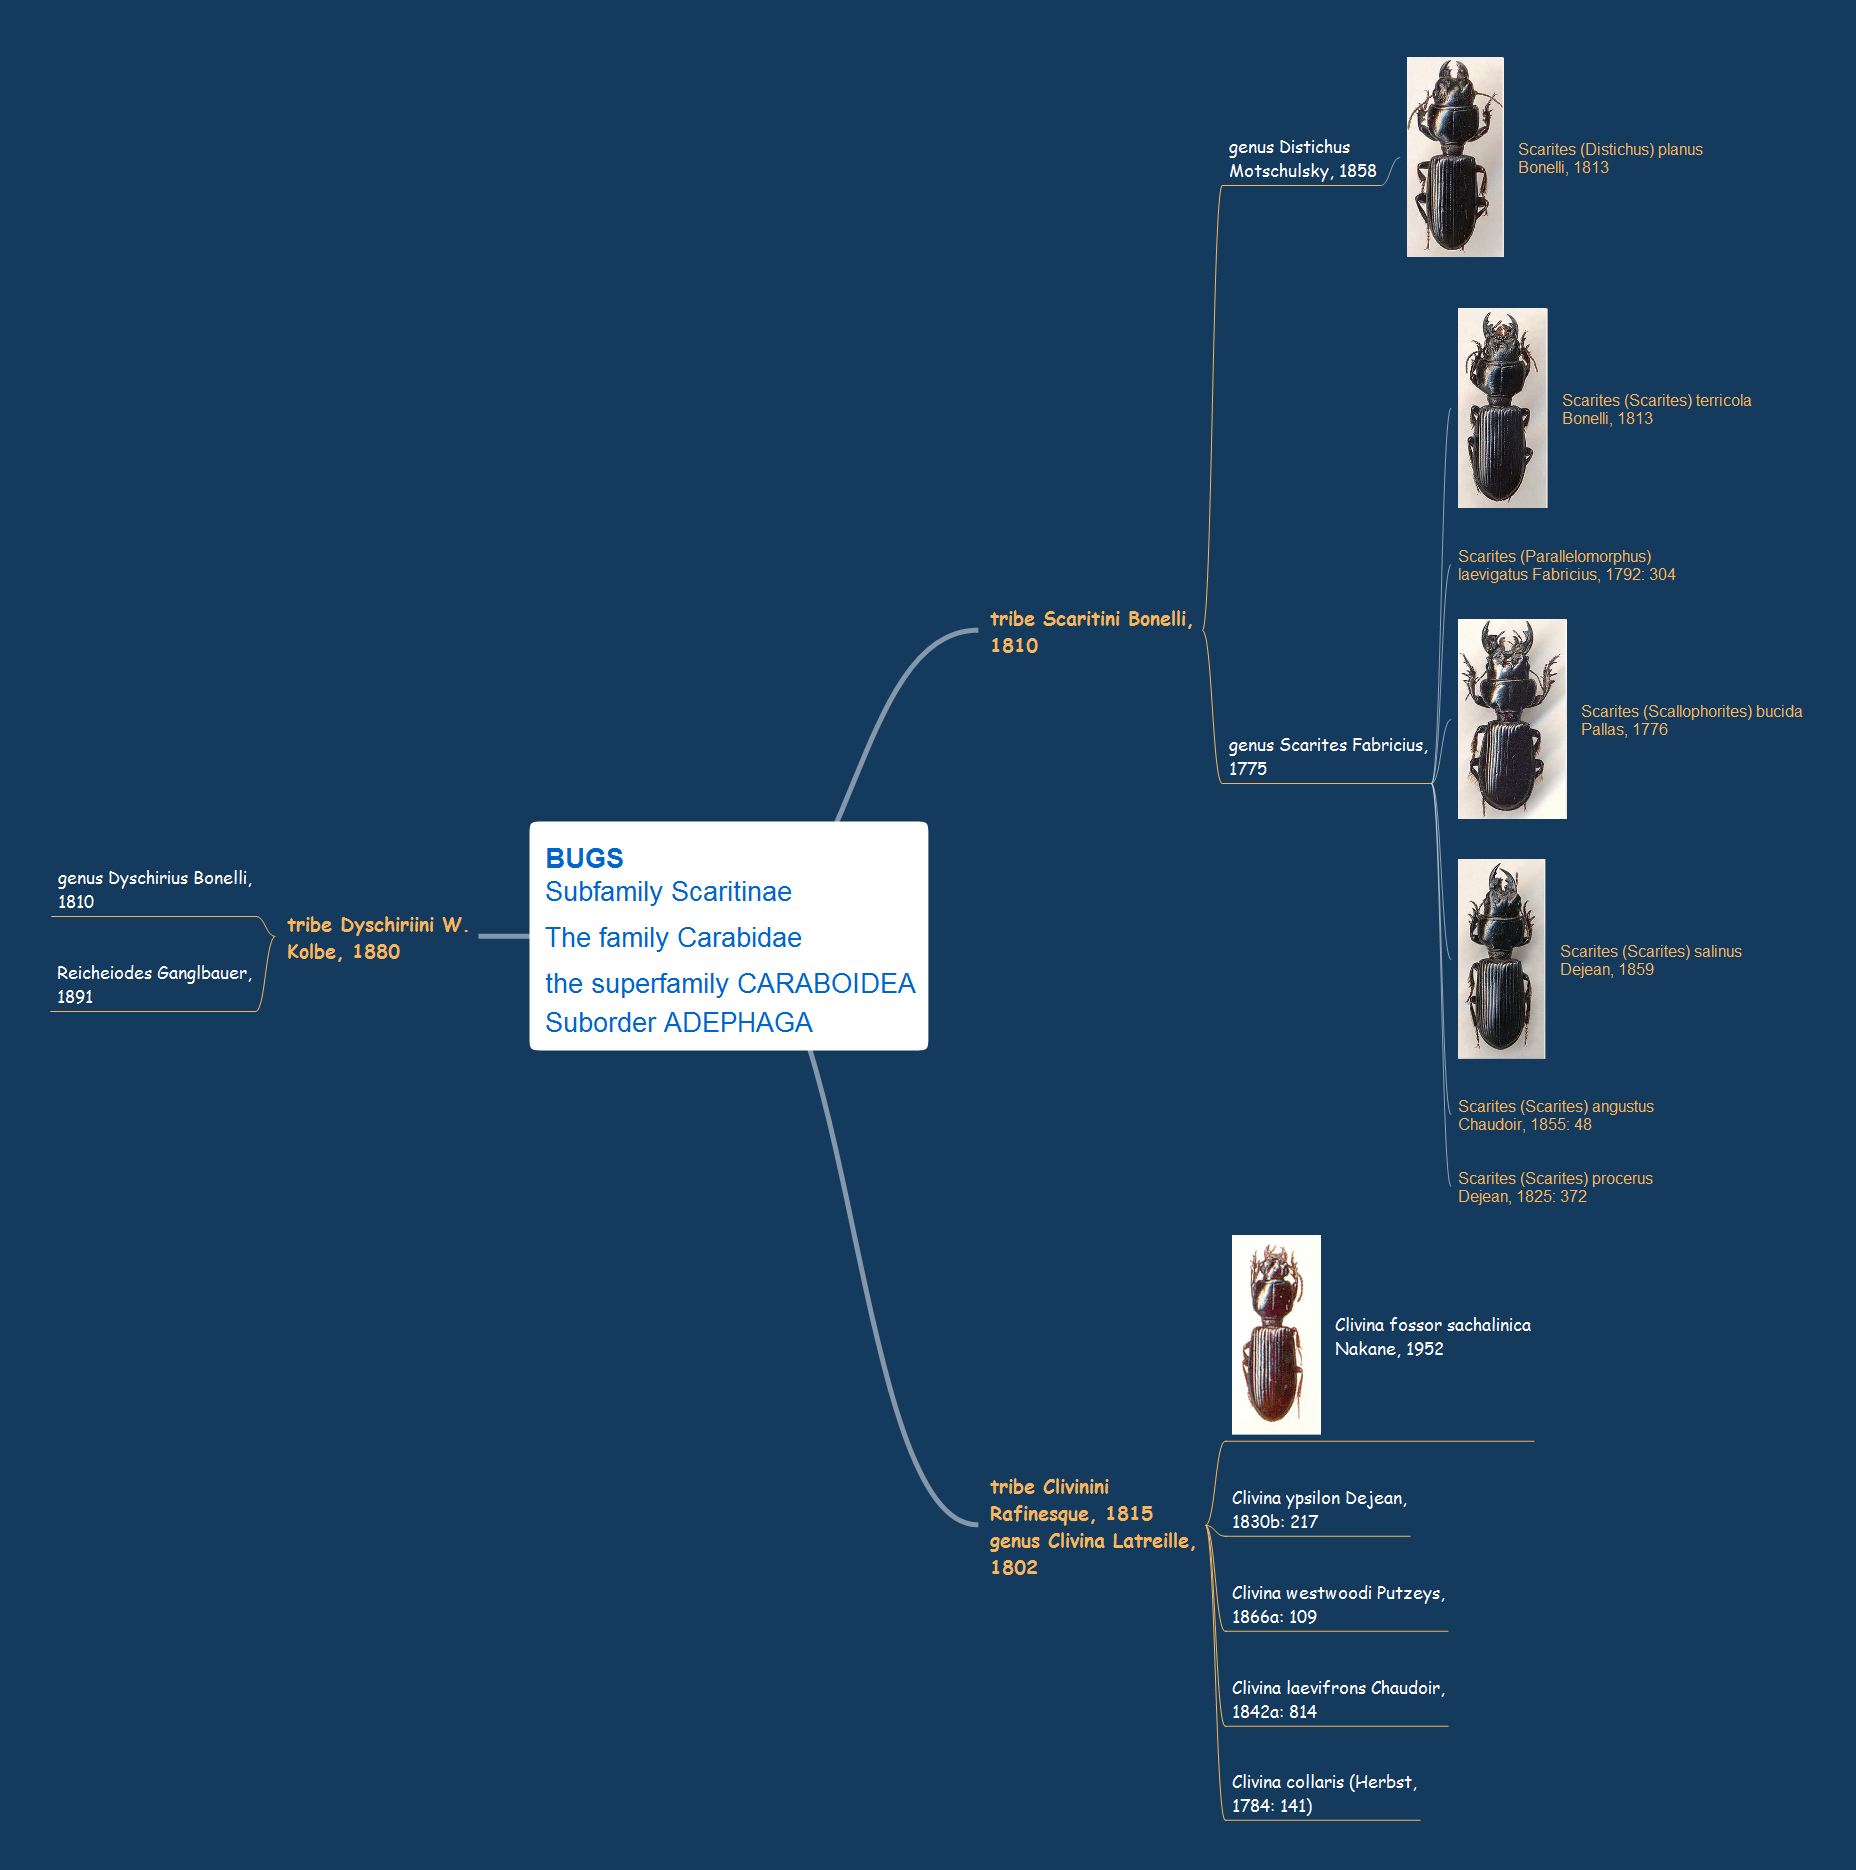 "Bugs subfamily Scaritinae" mind map sample is created using ConceptDraw MINDMAP mind mapping software. This example helps to learn how to create learning mind map presentation and show it via Skype. Use this mindmap example for implementation of Remote Presentation for Skype solution from ConceptDraw Solution Park.
TEN RELATED HOW TO's:
An example flowchart of marketing analysis shows main steps you have to challenge writing a marketing analysis.
Picture: Flowchart Example: Flow Chart of Marketing Analysis
Related Solution:
To create an Audit Process FlowChart you only need Conceptdaw Software.
Picture: Basic Audit Flowchart. Flowchart Examples
Related Solution:
Interactive Training via presentations is used widely in education. This is a frequently used tool on training, especially for remote training via Skype.
Picture: Interactive Training Tool
Related Solution:
When trying to figure out the nature of the problems occurring within a project, there are many ways to develop such understanding. One of the most common ways to document processes for further improvement is to draw a process flowchart, which depicts the activities of the process arranged in sequential order — this is business process management. ConceptDraw DIAGRAM is business process mapping software with impressive range of productivity features for business process management and classic project management. This business process management software is helpful for many purposes from different payment processes, or manufacturing processes to chemical processes. Business process mapping flowcharts helps clarify the actual workflow of different people engaged in the same process. This samples were made with ConceptDraw DIAGRAM — business process mapping software for flowcharting and used as classic visio alternative because its briefly named "visio for mac" and for windows, this sort of software named the business process management tools.
This flowchart diagram shows a process flow of project management. The diagram that is presented here depicts the project life cycle that is basic for the most of project management methods. Breaking a project into phases allows to track it in the proper manner. Through separation on phases, the total workflow of a project is divided into some foreseeable components, thus making it easier to follow the project status. A project life cycle commonly includes: initiation, definition, design, development and implementation phases. Distinguished method to show parallel and interdependent processes, as well as project life cycle relationships. A flowchart diagram is often used as visual guide to project. For instance, it used by marketing project management software for visualizing stages of marketing activities or as project management workflow tools. Created with ConceptDraw DIAGRAM — business process mapping software which is flowcharting visio alternative or shortly its visio for mac, this sort of software platform often named the business process management tools.
Picture: Process Flowchart: A Step-by-Step Comprehensive Guide
Related Solution:
If you want to find a way to understand complex things in minutes, you should try to visualize data. One of the most useful tool for this is creating a flowchart, which is a diagram representing stages of some process in sequential order. There are so many possible uses of flowcharts and you can find tons of flow charts examples and predesigned templates on the Internet. Warehouse flowchart is often used for describing workflow and business process mapping. Using your imagination, you can simplify your job or daily routine with flowcharts.
Warehouse flowcharts are used to document product and information flow between sources of supply and consumers. The flowchart provides the staged guidance on how to manage each aspect of warehousing and describes such aspects as receiving of supplies; control of quality; shipment and storage and corresponding document flow. Warehouse flowchart, being actual is a good source of information. It indicates the stepwise way to complete the warehouse and inventory management process flow. Also it can be very useful for an inventory and audit procedures.
Picture: Flow Chart Example: Warehouse Flowchart
Related Solution:
When developing the Classroom Seating Chart it is necessary to take into account the characteristics of the taken premises. Each seating place must to be comfortable and each pupil must to see good the teacher and the chalkboard. Let's design the Classroom Seating Chart in ConceptDraw DIAGRAM software extended with School and Training Plans Solution from the Building Plans Area.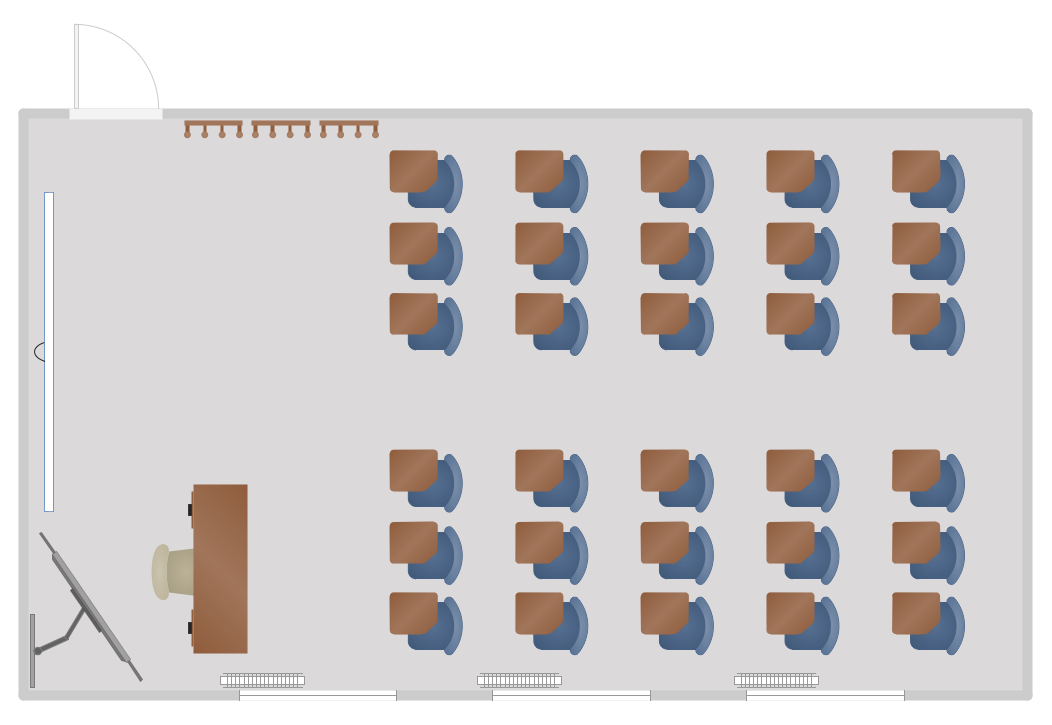
Picture: Classroom Seating Chart
Related Solution:
You want create a Subway Train Map fast and easy? Use the excellent tool - ConceptDraw DIAGRAM diagramming and vector drawing software. Extended with Metro Map Solution from the Maps Area, it is the best for drawing various types of metro maps.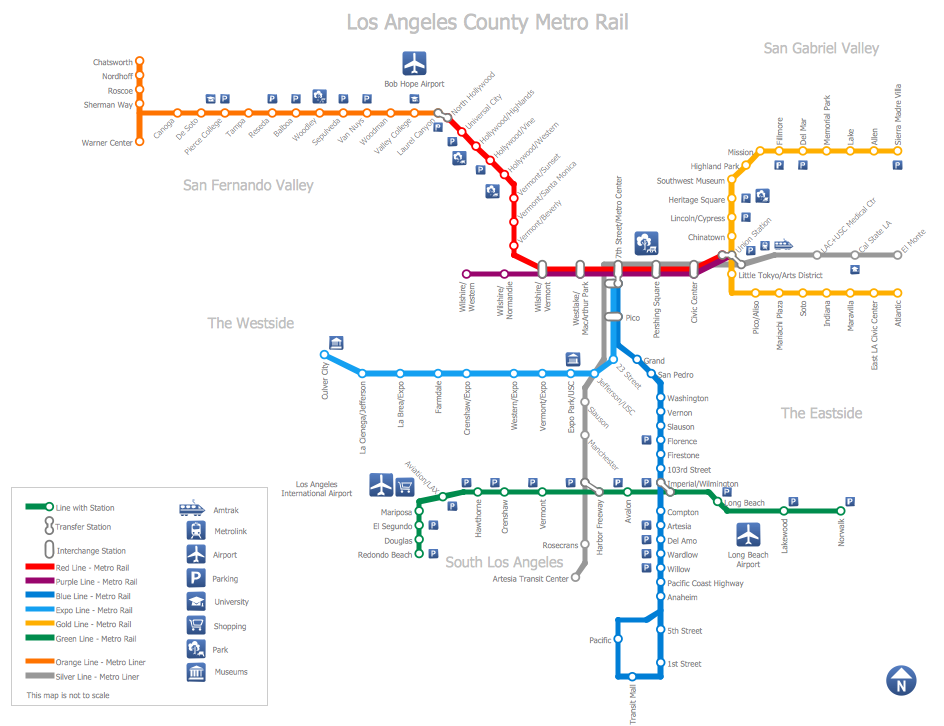
Picture: Subway Train Map
Related Solution:
Drawing of Metro Train Map is usually complex process, but we want to make it easier and offer you the ConceptDraw DIAGRAM software with its Metro Map Solution from the Maps Area of ConceptDraw Solution Park.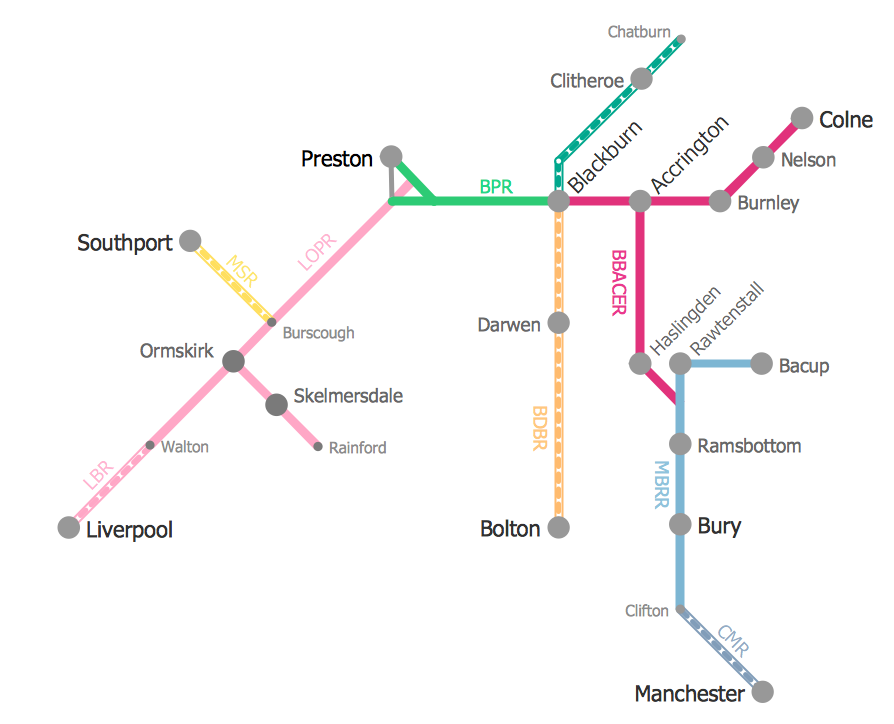
Picture: Metro Train Map
Related Solution:
While creating flowcharts and process flow diagrams, you should use special objects to define different statements, so anyone aware of flowcharts can get your scheme right. There is a short and an extended list of basic flowchart symbols and their meaning. Basic flowchart symbols include terminator objects, rectangles for describing steps of a process, diamonds representing appearing conditions and questions and parallelograms to show incoming data.
This diagram gives a general review of the standard symbols that are used when creating flowcharts and process flow diagrams. The practice of using a set of standard flowchart symbols was admitted in order to make flowcharts and other process flow diagrams created by any person properly understandable by other people. The flowchart symbols depict different kinds of actions and phases in a process. The sequence of the actions, and the relationships between them are shown by special lines and arrows. There are a large number of flowchart symbols. Which of them can be used in the particular diagram depends on its type. For instance, some symbols used in data flow diagrams usually are not used in the process flowcharts. Business process system use exactly these flowchart symbols.
Picture: Flowchart Symbols: Meaning and Examples
Related Solution:
ConceptDraw DIAGRAM diagramming and vector drawing software enhanced with powerful HR Flowcharts Solution perfectly suits for Human Resource Management.
Picture: Human Resource Management
Related Solution:
ConceptDraw
MINDMAP 16