Rail transport - Design elements
Rail transport - Design elements libraryThe vector stencils library Rail transport contains clipart of railway transport for ConceptDraw DIAGRAM diagramming and vector drawing software. Use it to draw illustrations of trains and transportation of passengers and goods by railroads. This design elements library is included in Aerospace and Transport solution from Illustration area of ConceptDraw Solution Park. The Rail transport library contains 8 wheeled vehicle images:
|
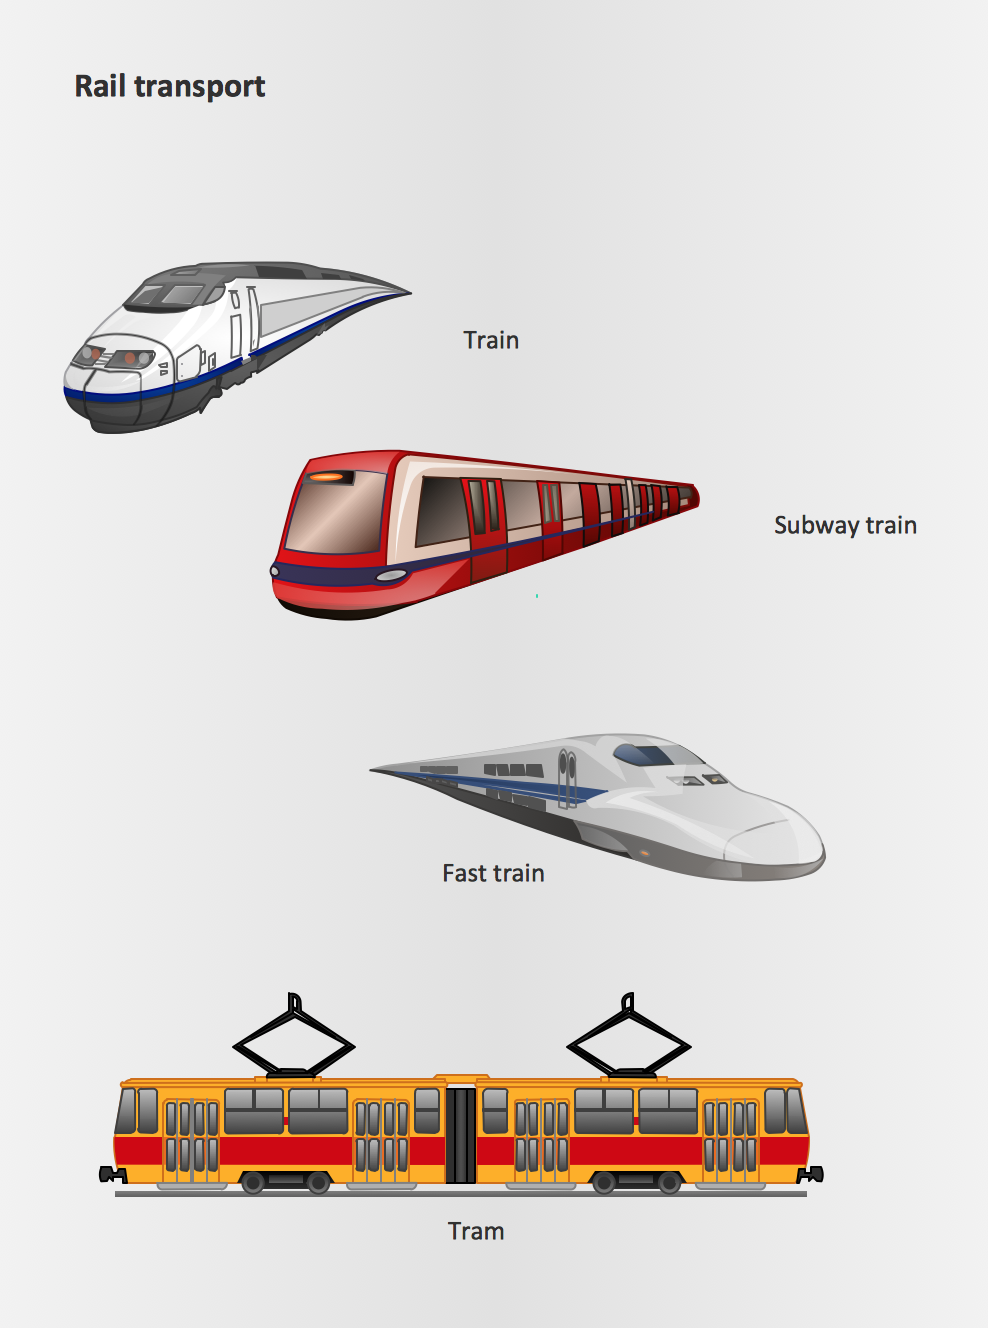
Pic.1 Rail Transport - Design Elements
See also Samples:
- Illustration - Aerospace and Transport
- Illustration - Artwork
- Illustration - Audio, video, media
- Illustration - Business and finance
- Illustration - Computers and communications
- Illustration - Manufacturing
- Illustration - Nature
- Illustration - People
- Illustration - Presentation clipart
- Illustration - Safety and security
- Science & Education — illustrations
TEN RELATED HOW TO's:
Drawing the diagrams we try to find in help the powerful software and now we have the ConceptDraw DIAGRAM. The ability easily create the SDL diagrams is made possible thanks to unique Specification and Description Language (SDL) Solution from the Industrial Engineering Area of ConceptDraw Solution Park. This solution extends ConceptDraw DIAGRAM 2 libraries - SDL Connectors and SDL Diagrams that contain 70 predesigned SDL flowchart symbols.
Picture: SDL Flowchart Symbols
Related Solution:
Interactive Training via presentations is used widely in education. This is a frequently used tool on training, especially for remote training via Skype.
Picture: Interactive Training Tool
Related Solution:
This sample was created on the Mac in ConceptDraw DIAGRAM diagramming and vector drawing software using the UML State Machine Diagram library of the Rapid UML Solution from the Software Development area of ConceptDraw Solution Park.
Picture: UML Diagram for Mac
Related Solution:
You have some interesting design home office ideas and you want to inscribe them as soon as possible? ConceptDraw DIAGRAM software extended with Office Layout Plans Solution from the Building Plans Area will help you.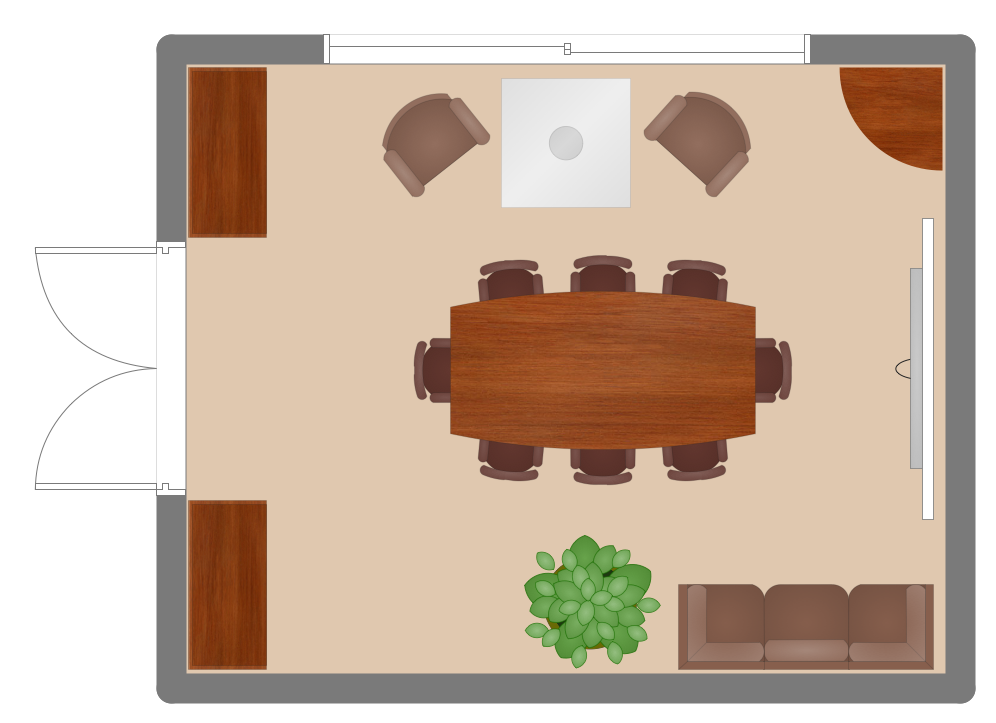
Picture: Home Office Ideas
Related Solution:
Choose which of business design elements you love best.
Design your own style with Business and Finance Solutions from ConceptDraw DIAGRAM.
We created a full set of elements, business samples, templates and libraries with vector clip art for drawing the Business Illustrations.
Mark your report or presentation, pay an attention of audience on your drawings with vector business design elements.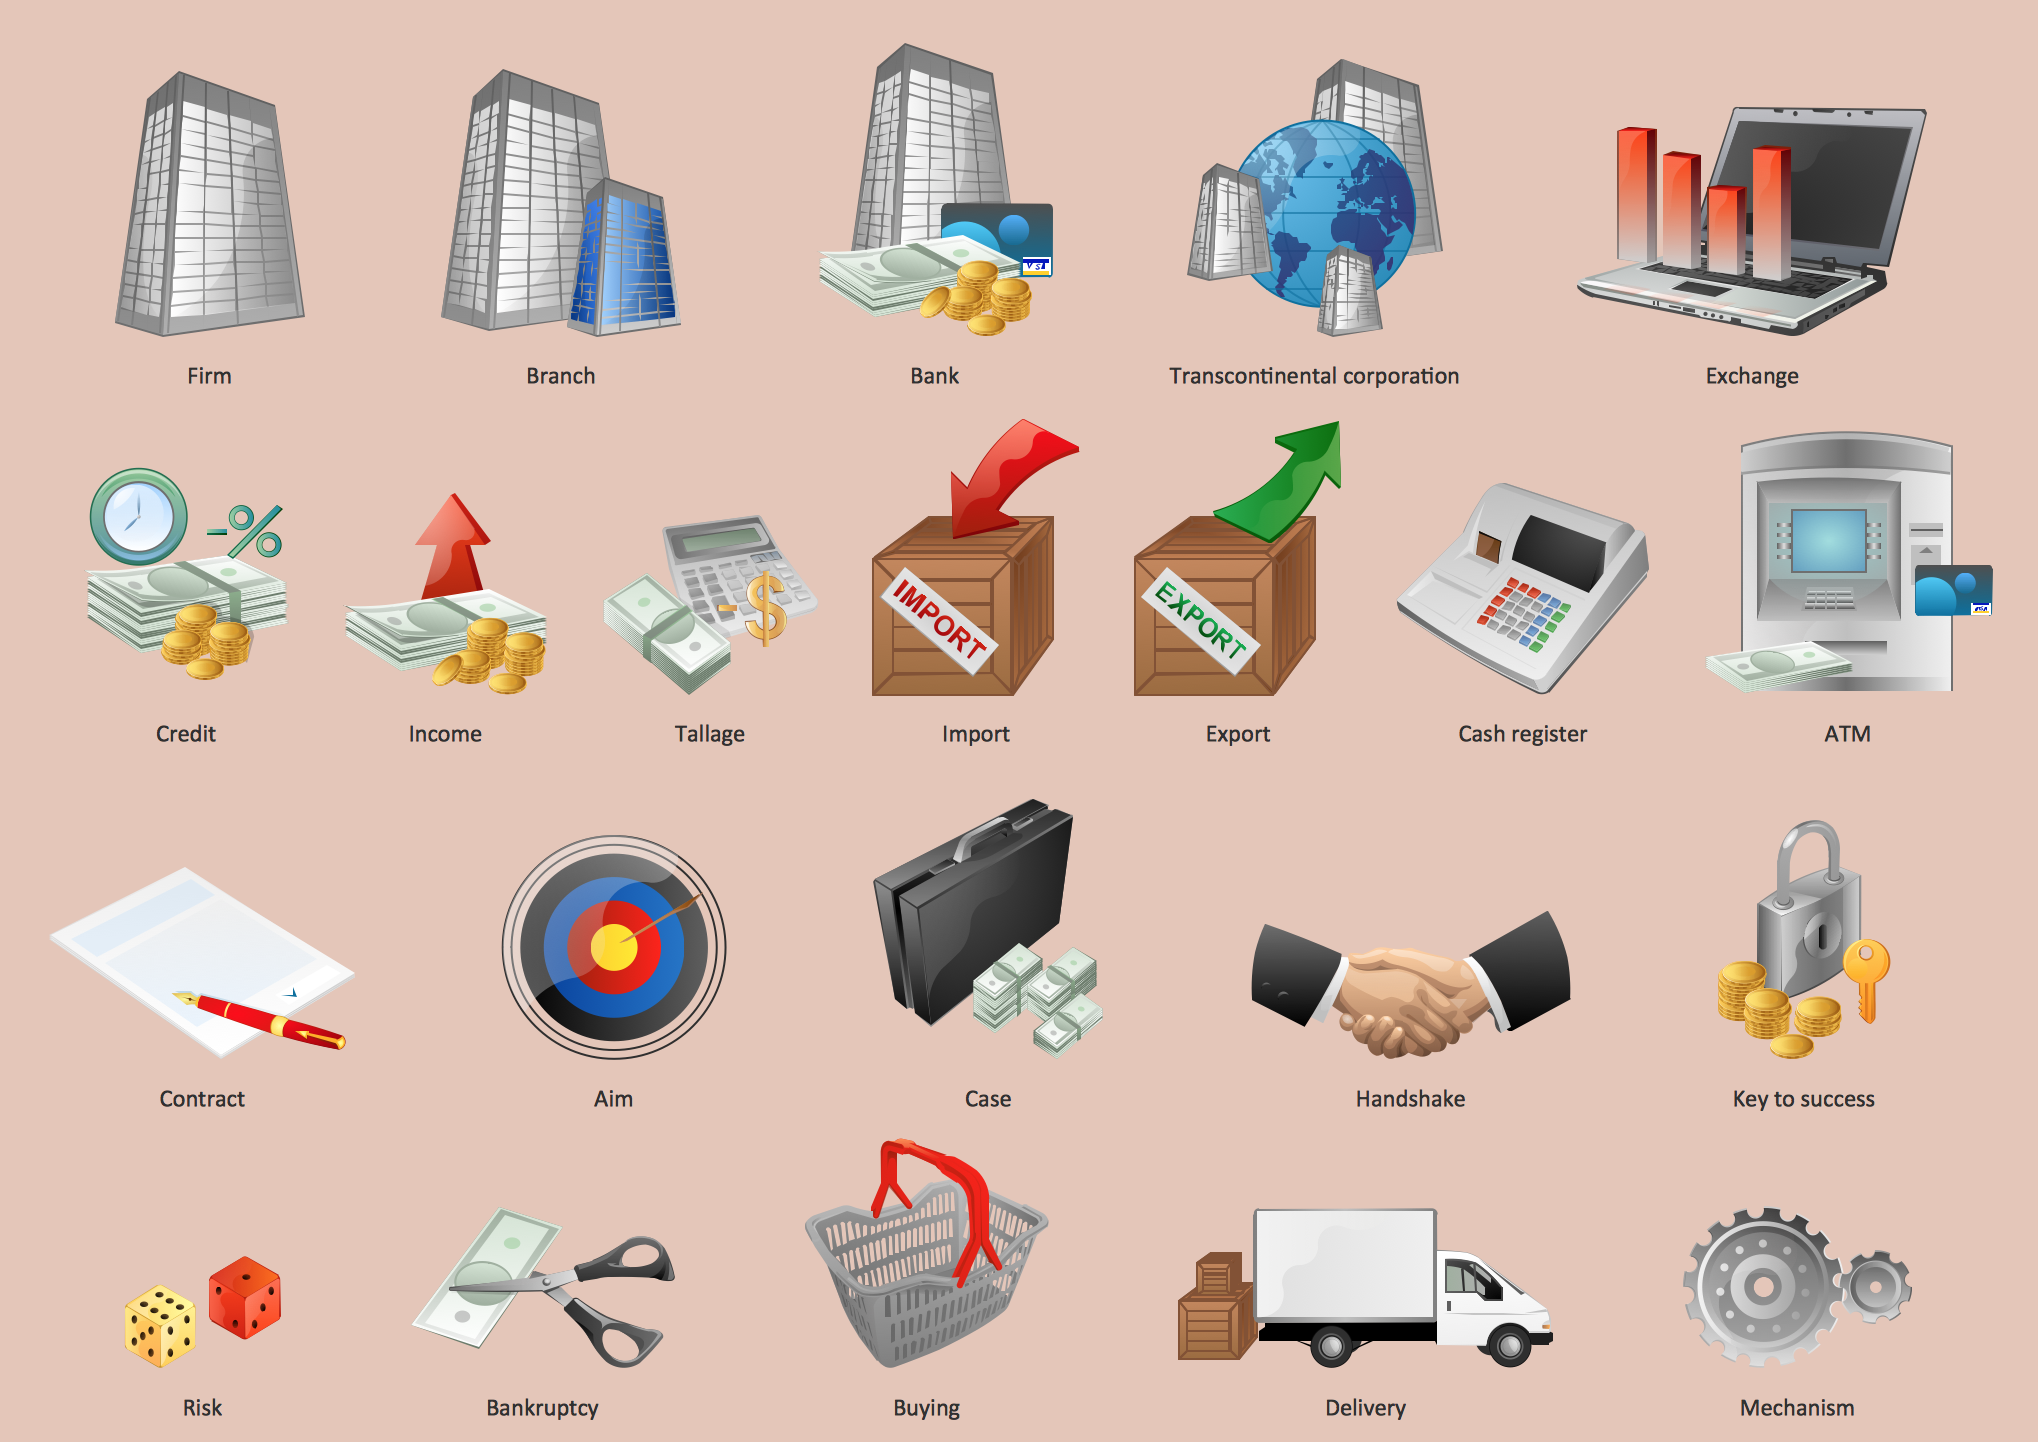
Picture: Business - Design Elements
Related Solution:
This sample was created in ConceptDraw DIAGRAM software using the Flowcharts solution.
Picture:
Copying Service Process Flowchart.
Flowchart Examples
Related Solution:
Structure of a software product might get very complex and complicated, if software engineers did not pay much attention to the architecture of the product. It will take a few minutes to create UML diagrams with ConceptDraw DIAGRAM , because this software is just perfect for diagramming. You can alter ready-to-use templates, or make your own, whatever you need.
This illustration represent the example of UML diagram made by using ConceptDraw Rapid UML solution. This activity diagram displays the stages of the software development process similar to a flow chart. This diagram depicts the states of elements in the software system. It can be applied to represent software and coding logic. This UML diagram was drawn with the help of the ConceptDraw Rapid UML solution which supplies the kit of vector libraries, containing the symbols of the Unified Modeling Language notations.
Picture: UML Diagrams with ConceptDraw DIAGRAM
Related Solution:
The Education Information is multifariuos and can be often represented in various forms. Еру the most successful ways of presentation the information and data are various illustrations, diagrams and colorful education infographics which you can easily make in ConceptDraw DIAGRAM software extended with Education Infographics Solution from the Business Infographics Area.
Picture: Education Information
Related Solution:
Block diagrams solution extends ConceptDraw DIAGRAM software with templates, samples and libraries of vector stencils for creating the block diagram.
Create block diagrams, electrical circuit diagrams, schematics, and more in minutes with ConceptDraw DIAGRAM.
Picture: Create Block Diagram
UML Package Diagram illustrates the functionality of a software system.
ConceptDraw has 393 vector stencils in the 13 libraries that helps you to start using software for designing your own UML Diagrams. You can use the appropriate stencils of UML notation from UML Package library.
Picture: UML Package Diagram. Design Elements
Related Solution:
ConceptDraw
DIAGRAM 18