Electrical Symbols — VHF UHF SHF
Ultra high frequency (UHF) is the ITU designation for radio frequencies in the range between 300 MHz and 3 GHz, also known as the decimetre band as the wavelengths range from one meter to one decimetre. Radio waves with frequencies above the UHF band fall into the SHF (super-high frequency) or microwave frequency range. Lower frequency signals fall into the VHF (very high frequency) or lower bands. UHF radio waves propagate mainly by line of sight; they are blocked by hills and large buildings although the transmission through building walls is strong enough for indoor reception. They are used for television broadcasting, cell phones, satellite communication including GPS, personal radio services including Wi-Fi and Bluetooth, walkie-talkies, cordless phones, and numerous other applications.

Pic. 1. VHF UHF SHF Library
ConceptDraw DIAGRAM is a powerful software for creating professional looking electrical diagram quick and easy. For this purpose you can use the Electrical Engineering solution from the "Engineering" area of ConceptDraw Solution Park.
Electrical Engineering Solution for ConceptDraw DIAGRAM provides the stencils libraries of ready-to-use predesigned 926 vector symbols, templates and samples that make your electrical drawing quick, easy and effective.
26 libraries of the Electrical Engineering Solution of ConceptDraw DIAGRAM make your electrical diagramming simple, efficient, and effective. You can simply and quickly drop the ready-to-use objects from libraries into your document to create the electrical diagram.

Pic. 2. Electrical Engineering symbols
Electrical diagram software will assist you in drawing your electrical diagrams with minimal effort and makes it very easy for beginners.
Electrical symbols and smart connectors help present your electrical drawings, electrical schematic, wiring diagrams and blue prints.
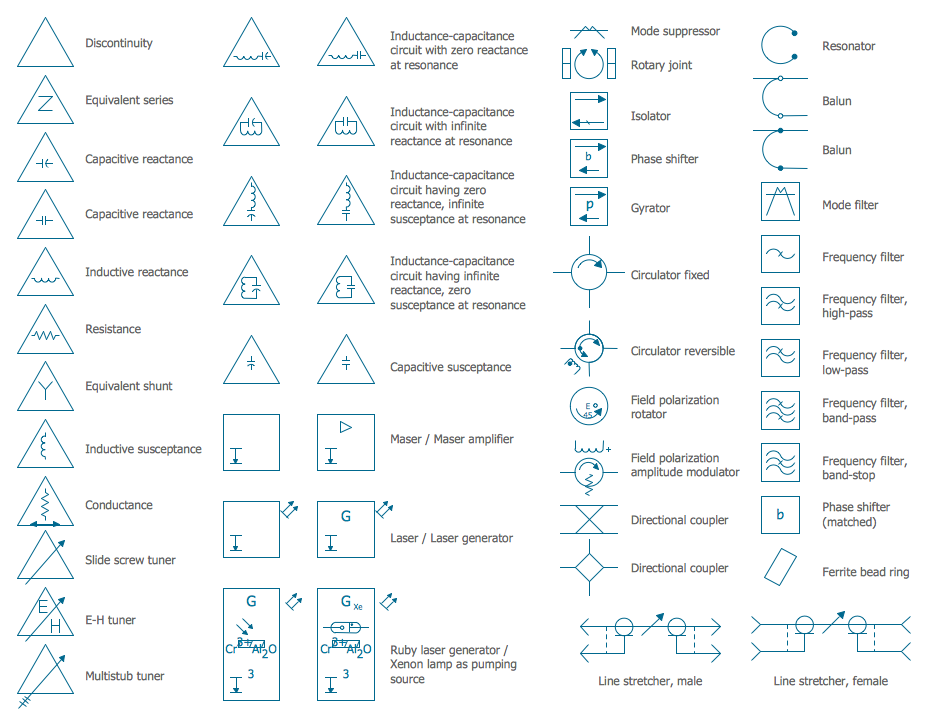
Pic. 3. Electrical Symbols — VHF UHF SHF
Most of the electrical symbols can be changed in their appearance, styles and colors according to users' requirements. Electrical symbols are used to represent various electrical and electronic devices in a schematic diagram of an electrical or electronic circuit.
The following table lists some VHF UHF SHF electrical symbols in our electrical diagram software.
| Symbol |
Meaning |
| Electrical Symbols — VHF UHF SHF |
 | Discontinuity |
 | Equivalent series |
 | Capacitive reactance |
 | Capacitive reactance 2 |
 | Inductive reactance |
 | Resistance |
 | Inductance capacitance |
 | Inductance capacitance 2 |
 | Inductance capacitance 3 |
 | Inductance capacitance 4 |
 | Inductance capacitance 5 |
 | Inductance capacitance 6 |
 | Inductance capacitance 7 |
 | Inductance capacitance 8 |
 | Equivalent shunt |
 | Capacitive susceptance |
 | Capacitive susceptance 2 |
 | Inductive susceptance |
 | Conductance |
 | Slide screw tuner |
 | E-H tuner |
 | Multistub tuner |
 | Directional coupler |
 | Directional coupler 2 |
 | Mode suppressor |
 | Rotary joint |
 | Isolator |
 | Phase shifter |
 | Gyrator |
 | Circulator fixed |
 | Circulator reversible |
 | Field polarization rotator |
 | Field polarization amplitude modulator |
 | Resonator |
 | Balun |
 | Balun 2 |
 | Mode filter |
 | Frequency filter |
 | Frequency filter, high-pass |
 | Frequency filter, low-pass |
 | Frequency filter, band-pass |
 | Frequency filter, band-stop |
") | Phase shifter (matched) |
 | Ferrite bead ring |
 | Line stretcher, male |
 | Line stretcher, female |
 | Maser |
 | Maser, amplifier |
 | Laser |
 | Laser, generator |
 | Ruby laser |
 | Ruby laser, Xenon lamp |
A laser is a device that emits light through a process of optical amplification based on the stimulated emission of electromagnetic radiation. The term "laser" originated as an acronym for "light amplification by stimulated emission of radiation".
How to Create an Electrical Diagram Using VHF UHF SHF Library
TEN RELATED HOW TO's:
The ConceptDraw vector stencils library Cisco Telepresence contains videoconference equipment symbols for drawing the computer network diagrams.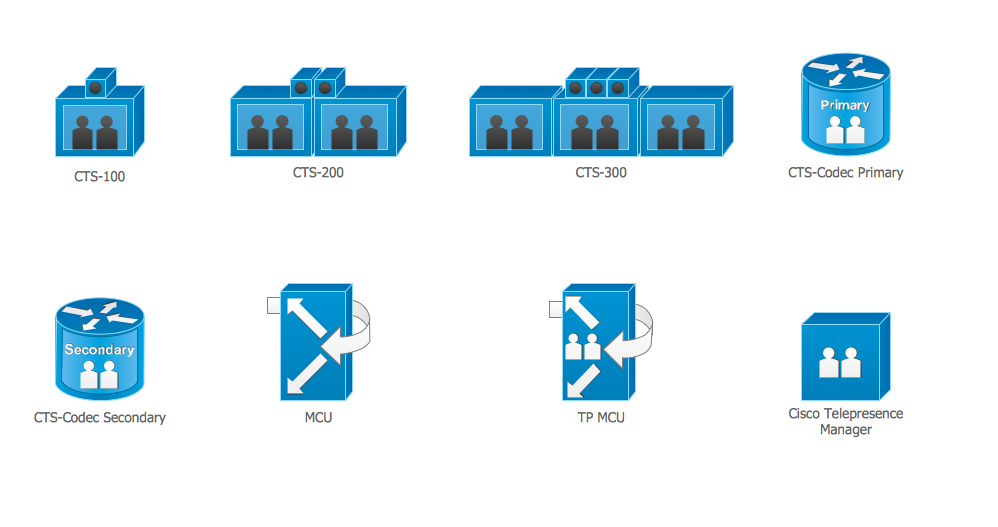
Picture: Cisco Telepresence. Cisco icons, shapes, stencils and symbols
Related Solution:
When trying to figure out the nature of the problems occurring within a project, there are many ways to develop such understanding. One of the most common ways to document processes for further improvement is to draw a process flowchart, which depicts the activities of the process arranged in sequential order — this is business process management. ConceptDraw DIAGRAM is business process mapping software with impressive range of productivity features for business process management and classic project management. This business process management software is helpful for many purposes from different payment processes, or manufacturing processes to chemical processes. Business process mapping flowcharts helps clarify the actual workflow of different people engaged in the same process. This samples were made with ConceptDraw DIAGRAM — business process mapping software for flowcharting and used as classic visio alternative because its briefly named "visio for mac" and for windows, this sort of software named the business process management tools.
This flowchart diagram shows a process flow of project management. The diagram that is presented here depicts the project life cycle that is basic for the most of project management methods. Breaking a project into phases allows to track it in the proper manner. Through separation on phases, the total workflow of a project is divided into some foreseeable components, thus making it easier to follow the project status. A project life cycle commonly includes: initiation, definition, design, development and implementation phases. Distinguished method to show parallel and interdependent processes, as well as project life cycle relationships. A flowchart diagram is often used as visual guide to project. For instance, it used by marketing project management software for visualizing stages of marketing activities or as project management workflow tools. Created with ConceptDraw DIAGRAM — business process mapping software which is flowcharting visio alternative or shortly its visio for mac, this sort of software platform often named the business process management tools.
Picture: Process Flowchart: A Step-by-Step Comprehensive Guide
Related Solution:
Electrical maintenance - troubleshooting electrical circuit.
The diagrams are a big help when workers try to find out why a circuit does not work correctly.
26 libraries of the Electrical Engineering Solution of ConceptDraw DIAGRAM make your electrical diagramming simple, efficient, and effective. You can simply and quickly drop the ready-to-use objects from libraries into your document to create the electrical diagram.
Picture: Electrical Symbols — Maintenance
Related Solution:
ConceptDraw DIAGRAM is a Wireless Network Drawing Mac OS software.
Picture: Wireless Networking for Mac
Related Solution:
Accounting is a cornerstone of any business, it’s basement. If you want to have a visual representation of your finance management, use audit flowchart symbols to document the money flow. Although some would say that accounting is boring, it is very a responsible duty.
The audit flowchart symbols is supplied with ConceptDraw Audit Flowcharts solution as a vector objects library. Together with Conceptdraw Drawing capabilities it forms the helpful tool for audit process planning and setting the steps of audit by designing audit flow charts. Audit Flow charts are used to organize fiscal information tracking process as well as in accounting, finance and investment management.
Picture: Audit Flowchart Symbols
Related Solution:
Drawing the diagrams we try to find in help the powerful software and now we have the ConceptDraw DIAGRAM. The ability easily create the SDL diagrams is made possible thanks to unique Specification and Description Language (SDL) Solution from the Industrial Engineering Area of ConceptDraw Solution Park. This solution extends ConceptDraw DIAGRAM 2 libraries - SDL Connectors and SDL Diagrams that contain 70 predesigned SDL flowchart symbols.
Picture: SDL Flowchart Symbols
Related Solution:
Job duties in small companies are usually spread randomly among workers, causing lots of problems and misunderstanding. One of the ways to restore order in business processing is to create a cross-functional flowchart with swim lanes that would represent every step in production system. Another advantage of using swim lanes flowchart is that it represents not only processes, but people responsible for them.
Swim lane diagram is a kind of a process flow diagram. Its special feature is that it joins the features of process flow diagrams with organizational charts. Thus, a swim lane diagram display a participant of the business process in a conjunction with general flow of the business system. A swim lane diagram is looks similar to a swimming pool's lanes. Lanes can be horizontal and vertical. The lanes are pointed out relatively to resource name, which is assigned on implementation of the given part of the business process. ConceptDraw Business Process Mapping solution delivers the ability to design develop swim lanes flowcharts using the vector graphic objects of Swim Lanes library.
Picture: Swim Lane Diagrams
Related Solution:
Apply Electrical Engineering solution for ConceptDraw DIAGRAM and numerous electric circuit symbols to 🔸 develop and illustrate all types of electrical circuits as ✔️ electrical circuit diagrams, ✔️ electrical schematics, ✔️ electrical diagram drawings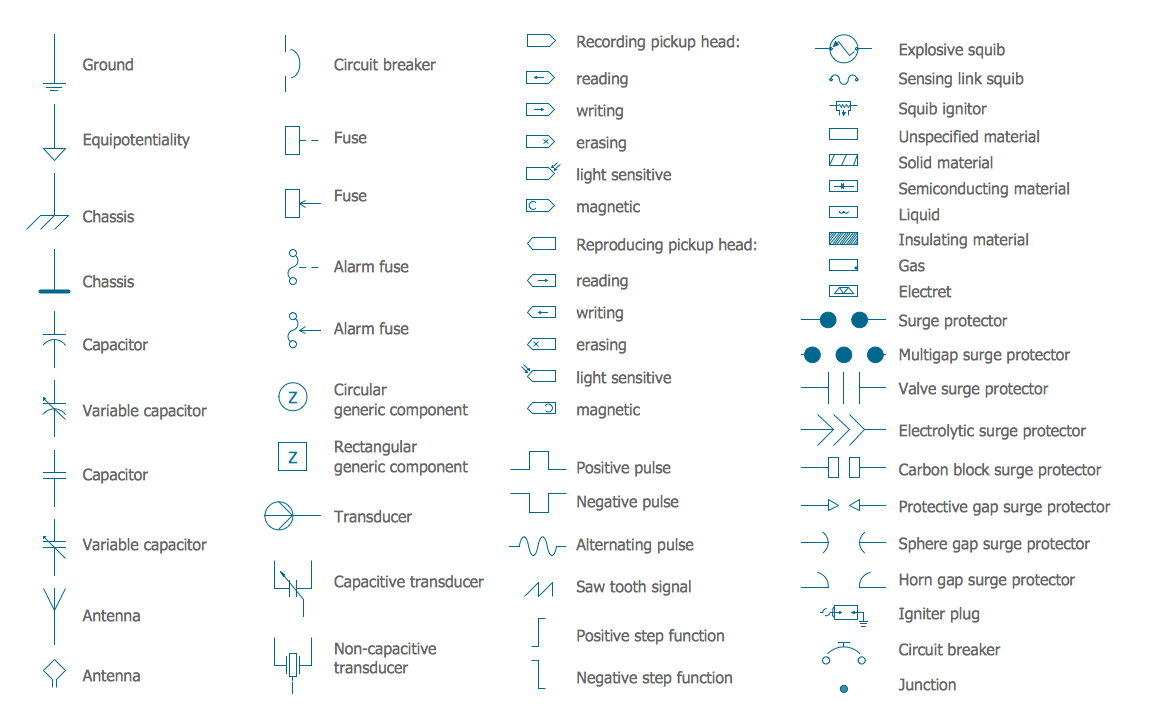
Picture: Electrical Circuits — Electrical Symbols
Related Solution:
While creating flowcharts and process flow diagrams, you should use special objects to define different statements, so anyone aware of flowcharts can get your scheme right. There is a short and an extended list of basic flowchart symbols and their meaning. Basic flowchart symbols include terminator objects, rectangles for describing steps of a process, diamonds representing appearing conditions and questions and parallelograms to show incoming data.
This diagram gives a general review of the standard symbols that are used when creating flowcharts and process flow diagrams. The practice of using a set of standard flowchart symbols was admitted in order to make flowcharts and other process flow diagrams created by any person properly understandable by other people. The flowchart symbols depict different kinds of actions and phases in a process. The sequence of the actions, and the relationships between them are shown by special lines and arrows. There are a large number of flowchart symbols. Which of them can be used in the particular diagram depends on its type. For instance, some symbols used in data flow diagrams usually are not used in the process flowcharts. Business process system use exactly these flowchart symbols.
Picture: Flowchart Symbols: Meaning and Examples
Related Solution:
A circuit diagram is sometimes also called an elementary diagram, electronic schematic or electrical diagram circuits. It is essential in construction of any electronic equipment. Among many digital drawing tools available, ConceptDraw DIAGRAM is a leading circuits and logic diagram software, affording for easy and quick creation of even the most advanced and complex diagram designs. This makes it a perfect choice for computer science and any kind of electronic engineering.
This drawing includes the graphic symbols that may be in use while creating a logic circuit diagram. The diagrams of such kind are used in the electronics industry. The logic symbol depicts a device that realizes a Boolean type functions. Practically a logic symbol means transistor, diodes, relays, and other mechanical or optical details which provide function of closing or opening "gates". Totally the logic circuits can involve millions of gates. ConceptDraw Electrical Engineering solution gives the opportunity to create a circuit diagrams both simple and difficult.
Picture: Circuits and Logic Diagram Software
Related Solution:


 . To connect elements using this tool, drag the connector from one connect dot to another.You can use Layers to place connections on different layers.

