Sample 1. Spatial infographics - Europe map template.
Solution Spatial Infographics from ConceptDraw Solution Park extends ConceptDraw DIAGRAM ector diagramming and business graphics software with easy-to-use spatial infographics drawing tools.
This solution contains spatial infographics samples, map templates to be filled in, and libraries of vector stencils for main design elements of spatial infographics.
Use this solution to draw your own geospatial infographics documents with thematic maps, road maps, directional maps and transport maps.
NINE RELATED HOW TO's:
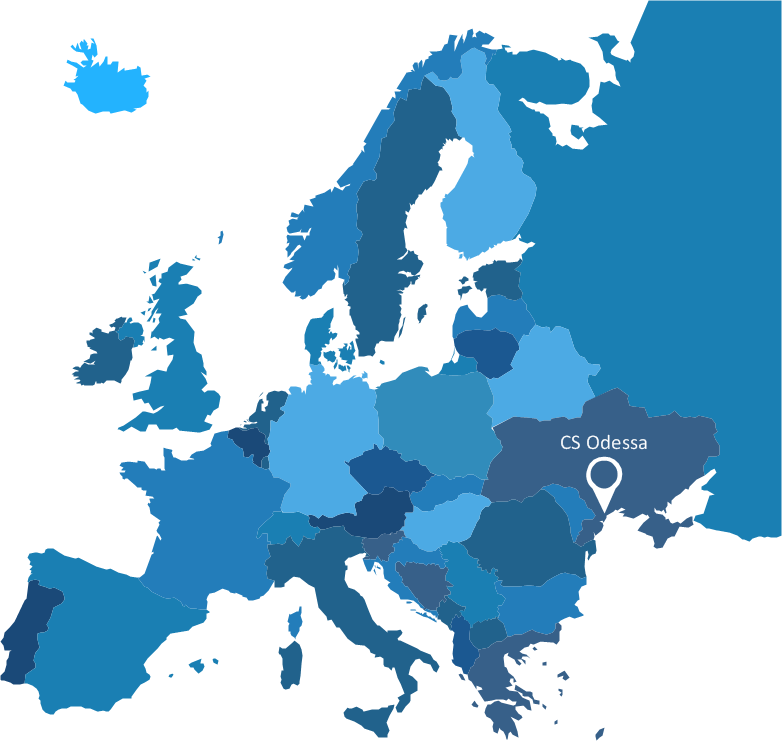
Great examples of Infographic Maps, they are needed for inspiration.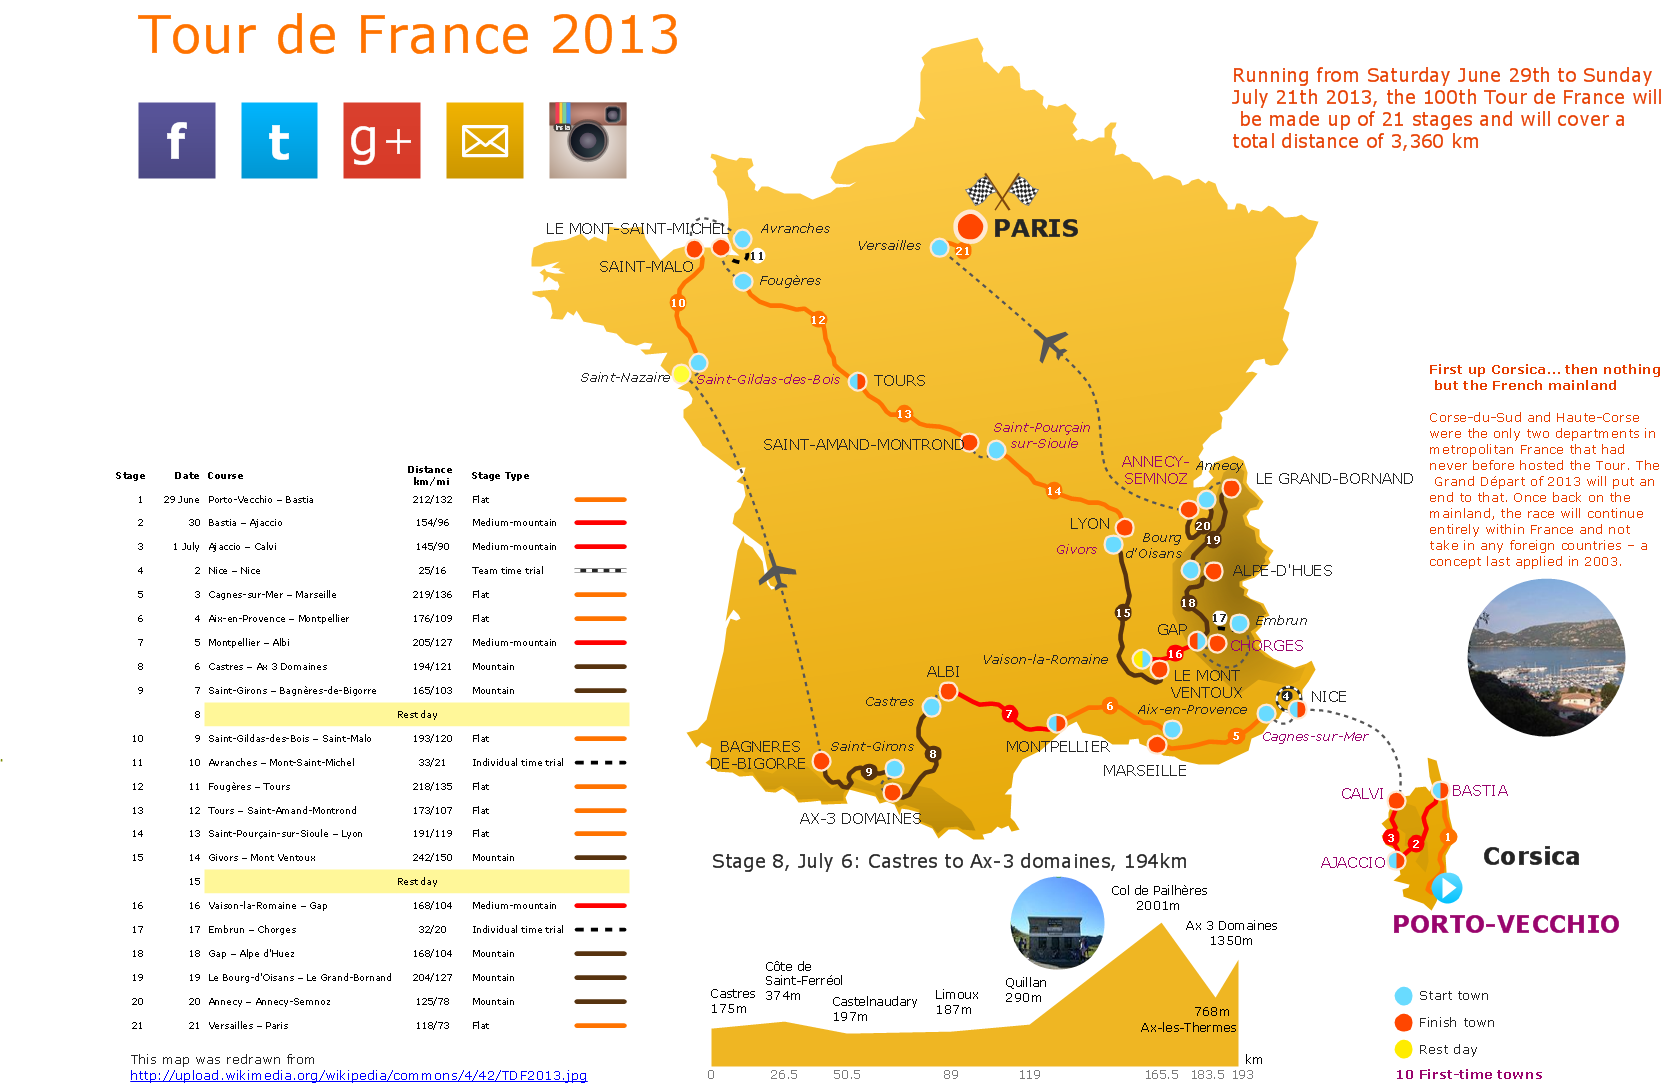
Picture: Superb Examples of Infographic Maps
The vector stencils library Portugal contains contours for ConceptDraw DIAGRAM diagramming and vector drawing software. This library is contained in the Continent Maps solution from Maps area of ConceptDraw Solution Park.
Picture: Geo Map - Europe - Portugal
Related Solution:
Design versatile maps based on the South America continent map effortlessly. 🔸 Create stunning and detailed South America maps and use them in ✔️ presentations, ✔️ educational materials, ✔️ websites, ✔️ business documents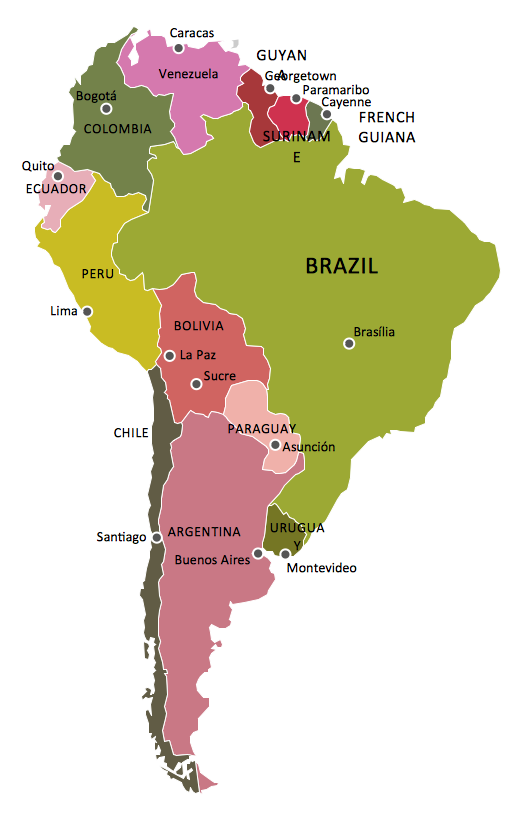
Picture: Geo Map — South America Continent
Related Solution:
A concept map is a way of representing relationships between ideas, images, or words.
How to draw a Concept Map quick, easy and effective? ConceptDraw DIAGRAM offers the unique Concept Maps Solution from the Diagrams Area that will help you!
Picture: Concept Map
Related Solution:
Geo Map Software - Full Geographic Reach of Your Business with Geo Map Shapes.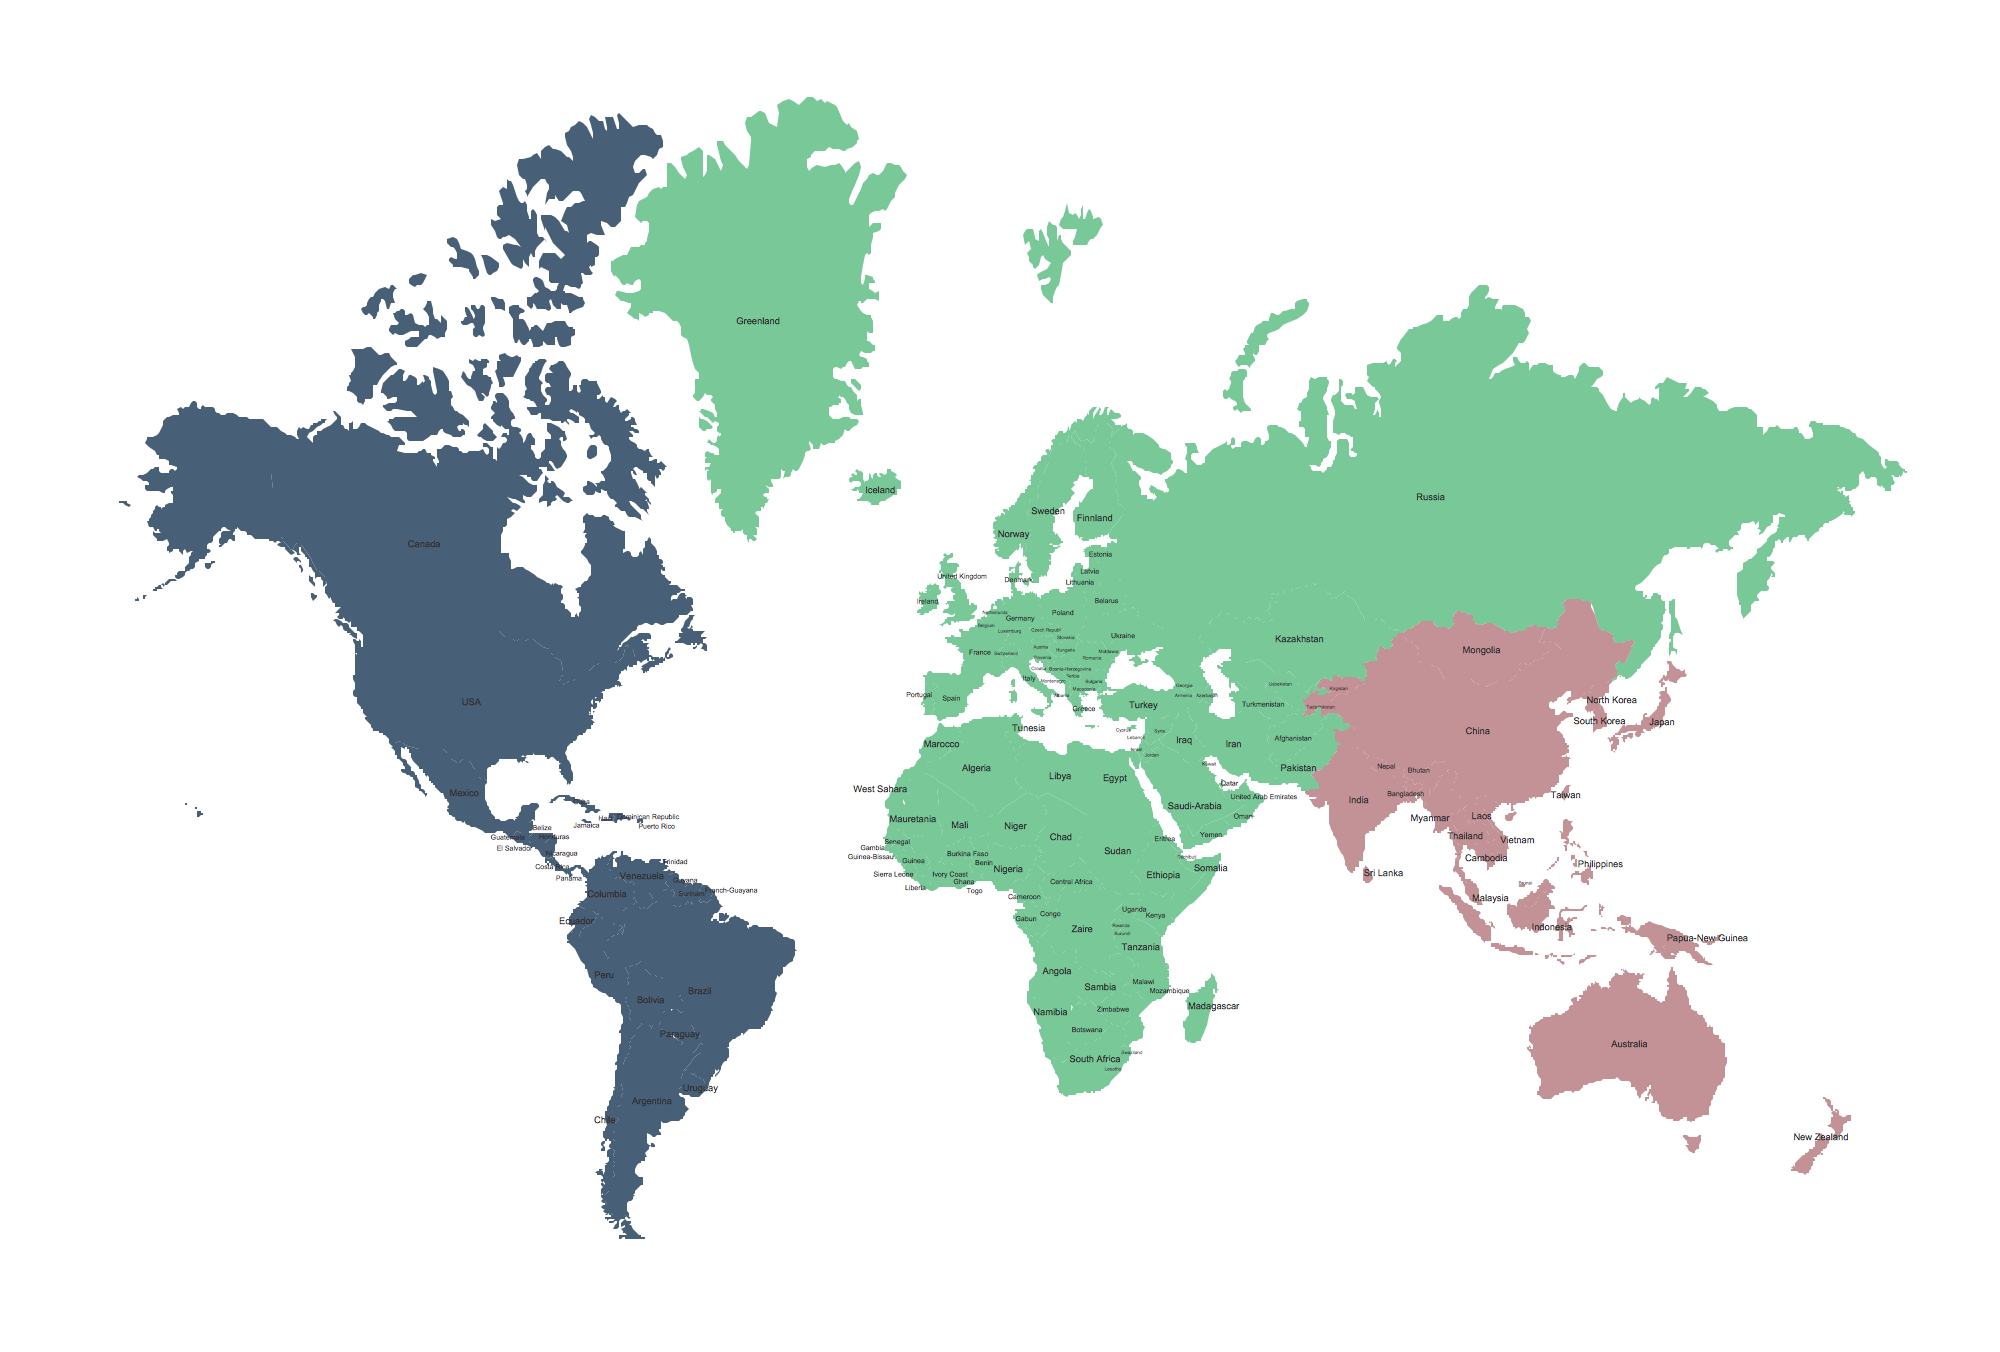
Picture: Geo Map Software
Related Solution:
Some organization hold offices for years and decades, or even build their own campuses. However, if it’s time for your organization to move to another building, drawing software for designing office layout plan would come in handy. With such software you can save a lot of time and create a new layout or try to save old layout in a new building.
This office layout plan is an example of a typical office furniture and equipment arrangement. This drawing provides a graphic view of the office area and its facilities including furniture and office equipment. It can be used as template which represent, desks, files, and other pieces of equipment that can be re-arranged according the certain requirements to office space and facilities. The vector graphic objects that represent various office layout elements such as special office furniture and equipment can help you to shape a number of creative ideas and develop your office layout plan.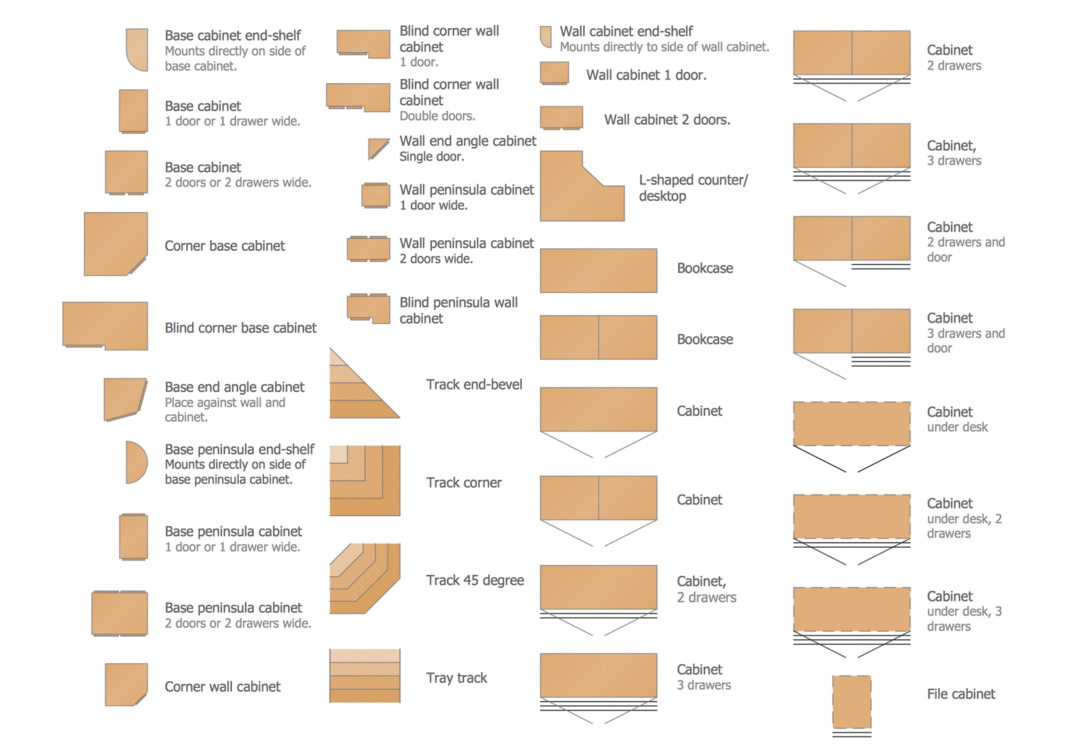
Picture: Building Drawing Software for Design Office Layout Plan
Related Solution:
A continent is a large area of land washed by the seas. There are 7 continents on the Earth: Asia, Africa, North America, South America, Antarctica, Europe, and Australia. If you want create the 7 Continents Map, we offer you incredibly useful tool for this - ConceptDraw DIAGRAM diagramming and vector drawing software extended with Continent Maps Solution from the Maps Area of ConceptDraw Solution Park.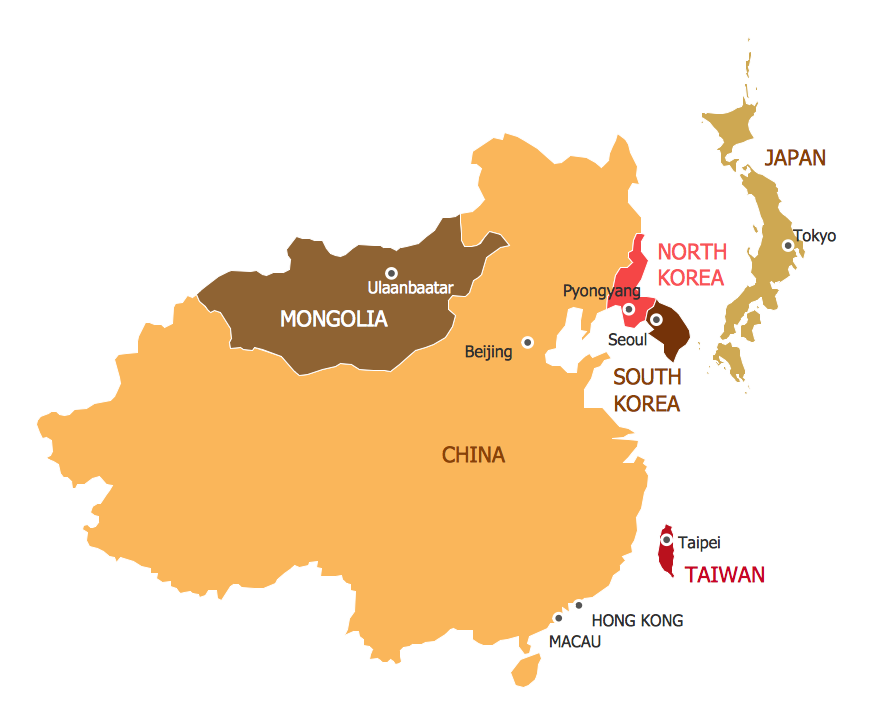
Picture: 7 Continents Map
Related Solution:
ConceptDraw DIAGRAM diagramming and vector drawing software enhanced with Continent Maps Solution from the Maps Area is the best for drawing geographic, topography, political, and many other kinds of maps for any of seven earth continents and also world continents map of any detailing.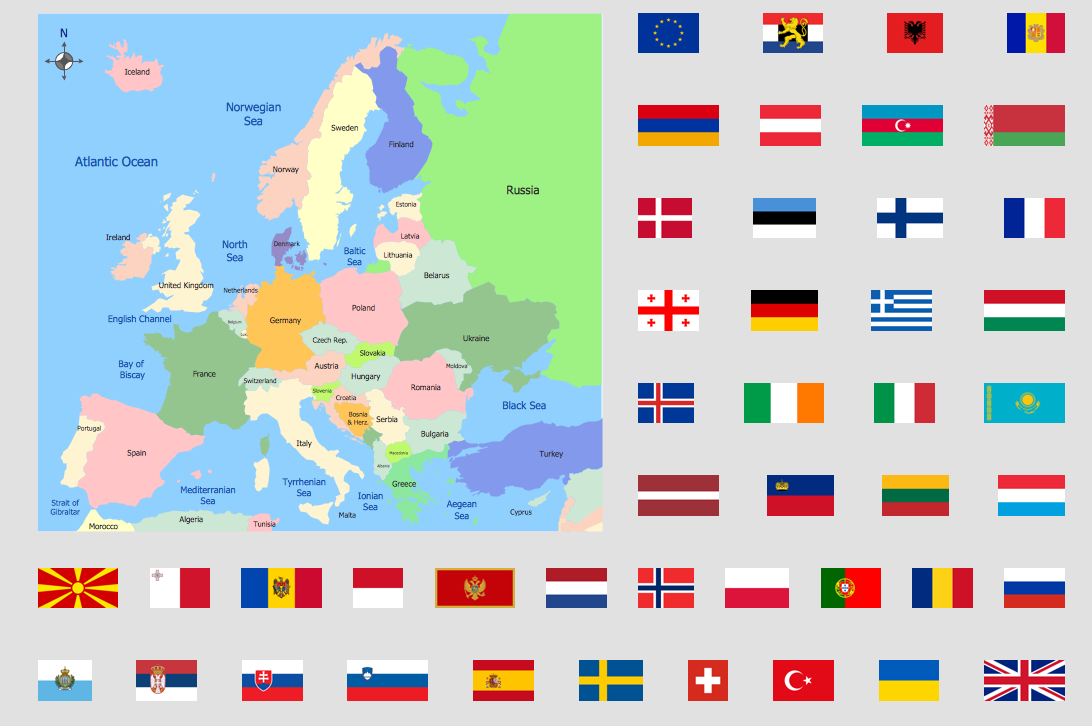
Picture: World Continents Map
Related Solution:
You want create a Subway Train Map fast and easy? Use the excellent tool - ConceptDraw DIAGRAM diagramming and vector drawing software. Extended with Metro Map Solution from the Maps Area, it is the best for drawing various types of metro maps.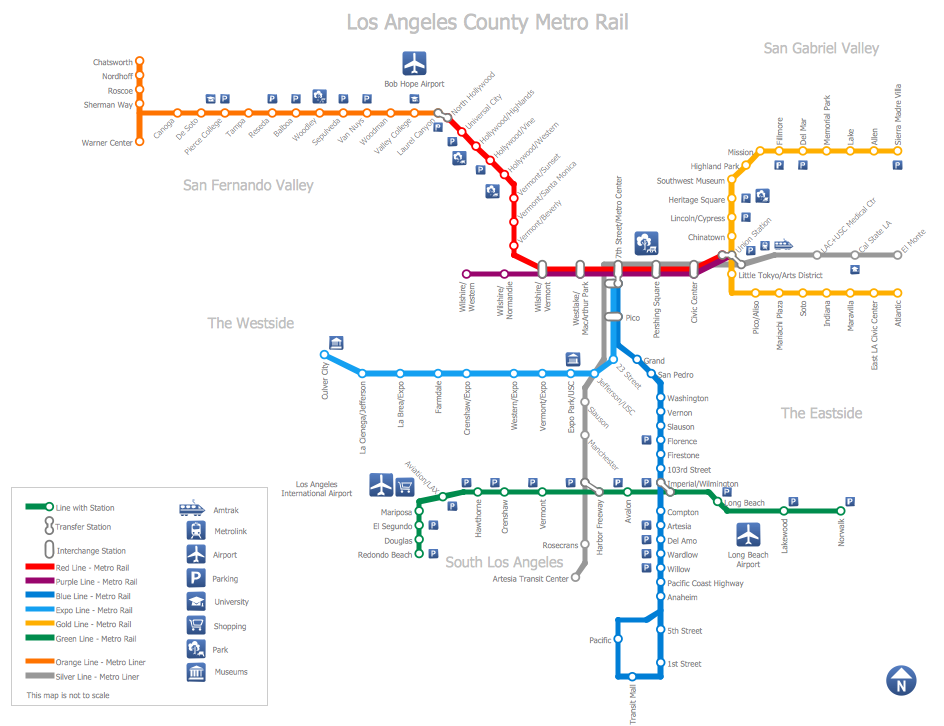
Picture: Subway Train Map
Related Solution: