Geo Map — South America Continent
South America is a well-known continent, which is located mostly in the southern hemisphere and also known as a subcontinent of the Americas. This continent is bordered on the north and east by the Atlantic Ocean and on the west by the Pacific Ocean. The Caribbean Sea and North America lie to the northwest of it.
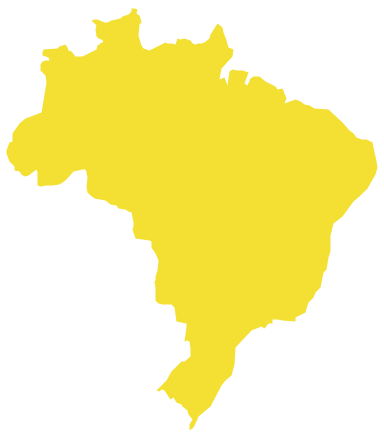
On world map South America extends on an area of 17840000 square kilometers or 6 890 000 square miles and its population is more than 385,7 million people. South America is in fourth place in the world after Asia, Africa, and North America due to the size of its area and it is in fifth place due to its population, after Asia, Africa, Europe, and North America. Nowadays, Brazil is the most populous South American country. There live more than half of the continent's people, followed by Colombia, Venezuela, Argentina, and Peru.
Most of the population of the South America continent live near its western or eastern coasts. Although the interior and the far south are sparsely populated. The geography of western South America is dominated by the Andes Mountains. The eastern part contains both highland regions and large lowlands, where are the rivers Amazon, Parana flow, and Orinoco.
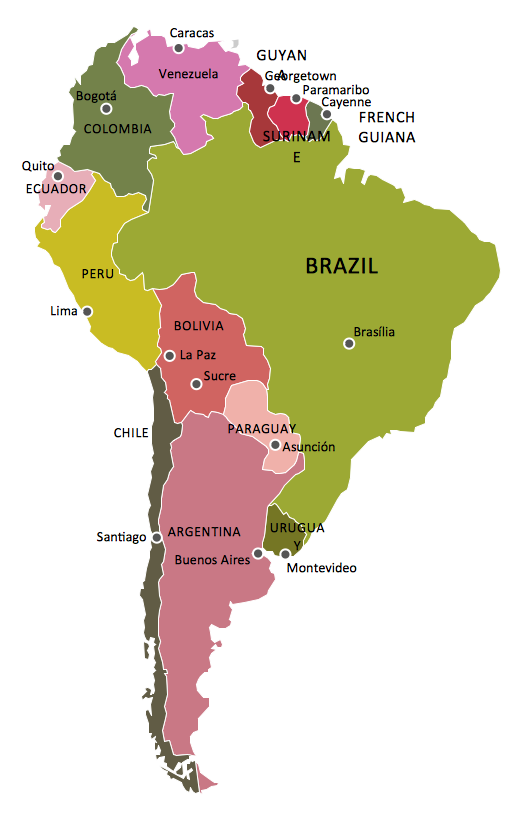
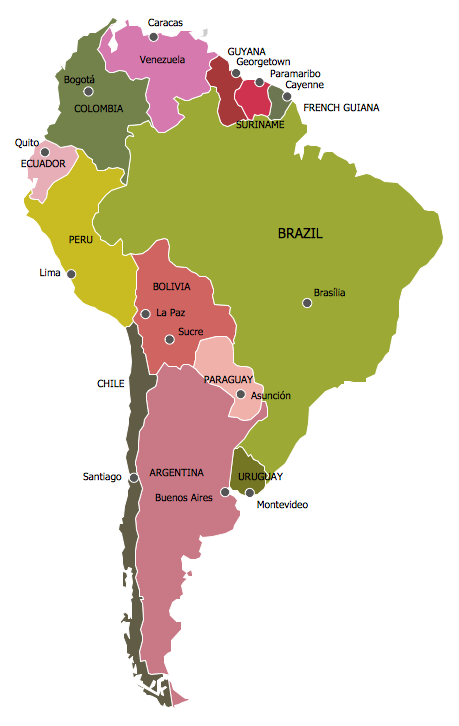
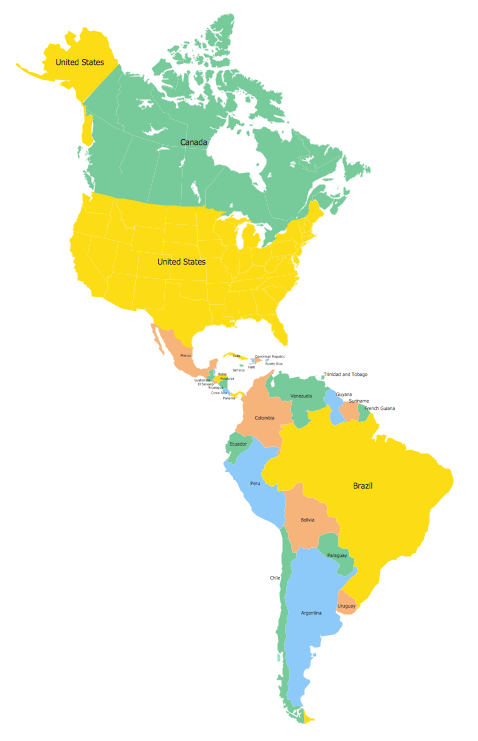
Example 1. Geographic Map South America
Talking about the populace of South America, there are five of the top ten areas located in only one Brazil. These areas have a population of more than 4 million people. These areas are: Sao Paulo, Rio de Janeiro, Belo Horizonte, and others. Thus, the Bueno Aires region includes more than 13 million people, which is over 13131431 inhabitants on the territory of 3830 square kilometers or 1480 square miles. In Brazil in Sao Paulo, there are 21090792 inhabitants in a total area of 7947 square kilometers or 3068 square miles. In Rio de Janeiro on the area of 6744 square kilometers or 2604 square miles all together above 13131431 people. In Belo Horizonte, which is also in Brazil, there are more than 5829923 people in an area of 9467 square kilometers (3655 square miles).
Another very populous region in Brazil is Porto Alegre, which in total includes 4258926 inhabitants in an area of 10232 square kilometers (or 3951 square miles). Brasilia region includes 4201737 inhabitants in an area of only 56433 square kilometers or 21789 square miles. In Peru, the most popular place for people to live is Lima where 9904727 inhabitants on the territory of 1088 square miles or 2819 square kilometers. In Colombia, there are all together in only Bogota 9286225 inhabitants in an area of 4200 square kilometers or 1600 square miles. In Santiago, Chile, there are 6683852 inhabitants in an area of 15403 square kilometers or 5947 square miles. In Caracas, Venezuela, there are all in total 5322310 inhabitants in an area of 4715 square kilometers or 1820 square miles. Colombia has all together 4 megaregions, which comprise 72% of its total population. The next on the list is Venezuela, then Argentina and Peru.
South America Countries and Regions
South America includes twelve sovereign states, which are Argentina, Bolivia, Brazil, Chile, Colombia, Ecuador, Guyana, Paraguay, Peru, Suriname, Venezuela, and Uruguay. A part of France, which is a French Guiana is also in South America as well as a non-sovereign area, including a British Overseas territory and the Falkland Islands. A part of South America are also the nearby ABC islands — Aruba, Bonaire, Curacao, as well as Panama, Trinidad and Tobago.
South America also includes the federal dependencies of Venezuela. Generally and geo-politically the overseas territories of the Caribbean and the island states are grouped as a part or subregion of North America. Other islands that are part of South America are the Galapagos Islands, which belong to Ecuador, Easter Island, Robinson Crusoe Island, Chiloe, and Tierra del Fuego. In the Atlantic region, Brazil owns Fernando de Noronha, Trindade and Martin Vaz as well as the Saint Peter and Saint Paul Archipelago. But the Falkland Islands are governed by the United Kingdom of Great Britain. The South Sandwich Islands and South Georgia are also known as part of South America or, sometimes, they are mentioned as part of Antarctica.

Example 2. Languages of South America
Exploring the Geographical Diversity of South America Through Maps
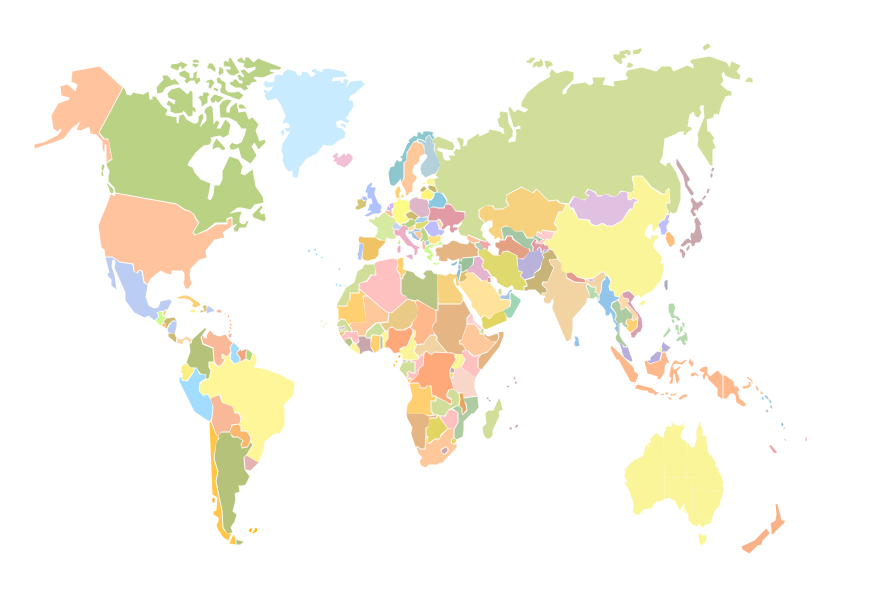
Exploring the geographical diversity of a continent through maps provides a comprehensive understanding of its landscapes, climate zones, population distribution, natural resources, marine and coast ecosystems, environmental challenges, and other unique characteristics. The geographical diversity of South America is vast and complex. It comprises a range of climates, landscapes, and ecosystems.
Maps and flowcharts solve different visual tasks. Geographic maps show locations and regions, while flowchart symbols are used to represent steps, decisions, inputs, and workflow logic in business and technical documentation.
Maps help to illustrate key points and their detailed analysis reveals the details and insights, helps to explore geographical diversity, better understand the continent's features, economic importance, geopolitical dynamics using world map sketch with continents, and regional variations, indicate regions rich in natural resources and develop methods to preserve this richness, explore fields critical for economic planning, develop region's economy, etc.
Among the most informative maps to explore the South American continent's diversity are:
| Maps | Show |
|---|---|
| Political | country borders and regional divisions |
| Topographical | the physical challenges of the terrain and elevation changes from the high peaks of the Andes (the longest mountain range in the world) to the lowlands of the Amazon. The Andes Mountains influence significantly the region's climate and ecosystems; marine location and major port cities like Rio de Janeiro and Buenos Aires play great value in economics |
| Natural resources | the areas rich in minerals like oil, copper, gold, silver, iron ore, and tin in South America, for example, Venezuela's oil reserves, Chile's copper mines, etc |
| Climate | indicate the climate diversity of different regions and parts of the continent, from tropical rainforests in the north to arid desert Atakame in the west |
| Population density | outline high concentrations in coastal areas and major cities and extremely low populations in interior regions |
| Thematic | focus on biodiversity and other important details, reveal specifics of flora and fauna, and other insights |
Geographical Insights for South America: A Detailed Map Analysis
Geographical insights for South America comprise its geographical features, regional variations, and spatial relationships and have wide practical applications in different fields including urban planning, building, natural resource exploration, economics, geopolitics, environmental management, tourism development, etc. The comprehensive study of South America provides an approach to understanding the geographical dynamics of the entire continent and individual countries. It includes the in-depth exploration of different aspects and characteristics of the continent, such as landscape, topography, climate, natural resources, demographics, economic activities, and is realized through research methods and analysis of various types of maps of the continent. This helps to indicate geographic patterns, trends, and spatial relationships between different phenomena. The most used maps include physical maps, political map political map of South America, economic maps, satellite imagery, different thematic maps, soil maps, climate maps, and others.

Example 3. Continent Maps Solution
Simplify Your Mapping: Software for Easy South America Map Creation
Creating a geographic map of South America can be a hard job for beginners, but having the appropriate software for making designs and drawings, you can create map of South America or geo mao of its particular region including a separate country or a big city with description of the landscape, mountains, rivers, waterfalls, etc. in minutes.
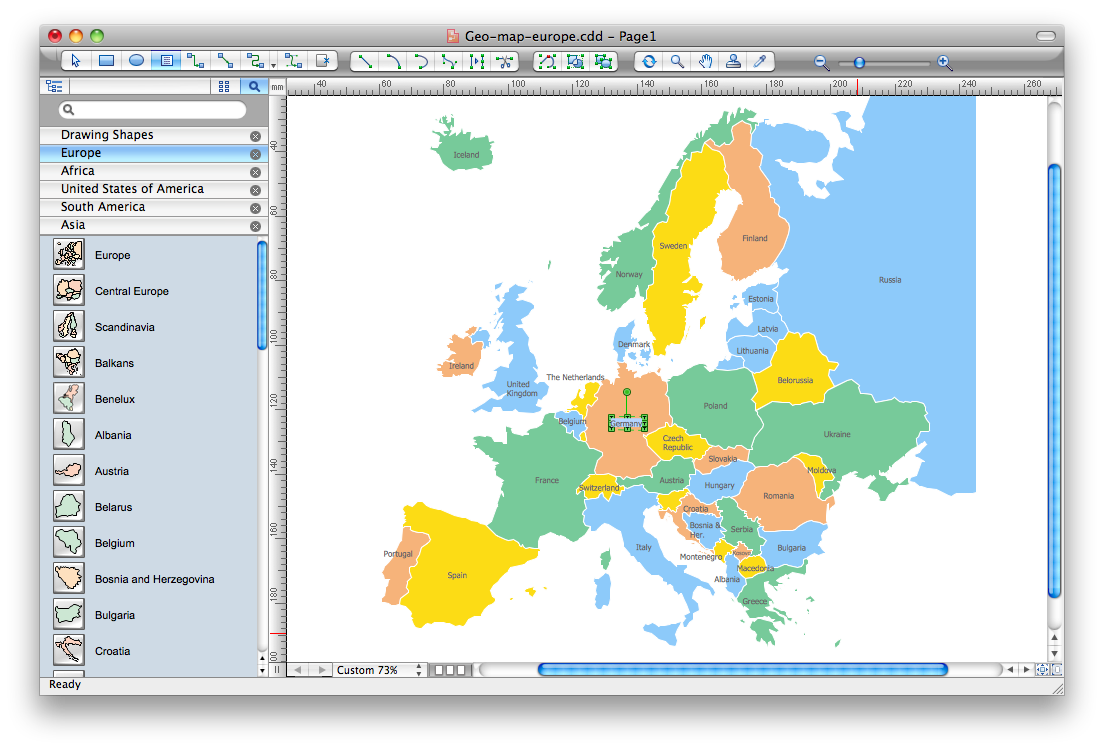
ConceptDraw DIAGRAM application provides you with a chance to draw a great-looking and exact map of any continent you need, including South America quickly and easily. Another application, ConceptDraw STORE, helps to work with ConceptDraw DIAGRAM software and other products from ConceptDraw Suite and download any solution you need, including the Continent Maps solution. Exactly this solution is your powerful assistant in making any map of any part of South America as well as the whole continent itself efficiently. You can also find the Continent Maps solution on this site in the Maps area of ConceptDraw Solution Park.
Benefits of Using ConceptDraw DIAGRAM to Draw South America Map
ConceptDraw DIAGRAM makes the design of accurate maps an easy task for both professionals and beginners. The large collection of previously created templates and samples included in the Continent Maps solution is a reliable base for easy drawing map over South America. Start with the appropriate template or sample to receive a really good-looking resulting map describing any country of South America or the entire continent.
The huge collection of pre-made map contours of the South America continent and its component parts — contours of South American countries is offered in the South America library of the Continent Maps solution.
The beneficial opportunity is designing both small and simple maps and large detailed with many clarifications and additional information. Scaling maps without loss of quality and using the multipage option are also useful functionalities. The included legend helps to clarify the used designations.

Example 4. South America Map with Capitals Template in ConceptDraw DIAGRAM
How to Draw the South America Map Using ConceptDraw DIAGRAM Software
The Continent Maps solution includes the vector design elements library called South America. It contains the pre-made South America countries map contours for use in ConceptDraw DIAGRAM vector drawing and diagramming software while creating the geo maps of the South American countries. There are all together 29 map contours:
- South America political division map,
- Central America political map,
- state map contours of South American countries,
- state map contours of Central American countries.

Example 5. Design Elements of South America Continent
It is always better to have ready contours previously created by the IT professionals, including the web designers, rather than to try to make your own maps from scratch. Use the map contours from the South America library to design thematic maps of South American countries using the ConceptDraw DIAGRAM sketch map app.
The Continent Maps solution for ConceptDraw DIAGRAM software provides also the Flags library with a variety of flags for different countries including the countries of South America.

Example 6. South America Flags
Follow the simple steps to design the South America map free in ConceptDraw DIAGRAM software.
Step 1
Run ConceptDraw DIAGRAM software, create a new document, and open the Continent Maps solution in the Solutions panel.
Step 2
Drag and drop the needed South America map contours from the South America library from the Continent Maps solution and arrange them in the corresponding order on a map.
Step 3
Add text to your map. On your desire, you can also change the color of any map object using the tools from a Format panel, add flags from the solution’s Flags library or any other desired elements from other libraries of the ConceptDraw Solution Park collection. The flags elements are also editable, you can change their size and edit them the way you like.
Step 4
Share your map with colleagues or other stakeholders via e-mail, export to different formats (PDF, graphic formats, MS Visio, SVG, EPS), or make a Power Point presentation in one click in ConceptDraw DIAGRAM.
Variety of South America Maps. Examples
The Continent Maps solution gives rich opportunities for ConceptDraw DIAGRAM users and provides a wide variety of examples, samples and templates that can become your powerful assistance in drawing the South America countries on world map, South America map and any map based on it. You can illustrate the diversity of languages used in various regions and countries using the colors or your own designations, indicate regions with flags, add information about landscape specifics, natural resources, etc.

Example 7. South America Maps Examples
Use Cases
The examples you see on this page are multifarious and demonstrate the opportunities of ConceptDraw DIAGRAM software and Continent Maps solution. They show the whole map of South America and its separate countries. Each map is scaled, with the option to customize the level of detail and depict only the borders of the countries or include their names, capitals with names, and major cities. You can add flags and other elements as well as additional information as notes or callouts. It is possible to change the coloring of your map and separate countries and add a legend with a description of the used colors. Starting with one of the templates included in the Continent Maps solution is the easiest way of drawing.

Example 8. South America Continent Contour
Conclusion
Use ConceptDraw DIAGRAM vector drawing software with Continent Maps solution and its pre-made map contours to draw the map of South America and stunning thematic maps base on the basic continent’s map, geospatial infographics, and vector illustrations for educational and marketing materials, business documents, presentations, reports, and websites.
See also Geo Maps of South America Countries :