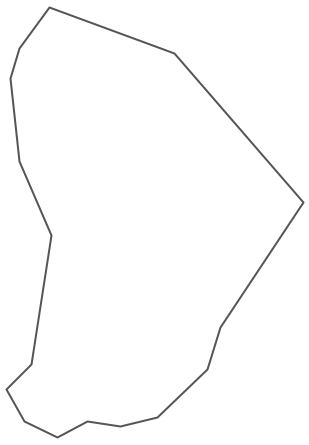
Geo Map - South America - French Guiana
Maps of South America - Guiana
"French Guiana, officially just Guiana, is an overseas department and region of France on the north Atlantic coast of South America. It borders Brazil to the east and south, and Suriname to the west. Its 83,534 km2 (32,253 sq mi) area has a very low population density of only 3 inhabitants per km2, with half of its 250,109 inhabitants in 2013 living in the metropolitan area of Cayenne, its capital. By land area, it is by far the largest overseas region of France. As an overseas region, it is inside the European Union, and its official currency is the Euro." [French Guiana. Wikipedia]
The vector stencils library French Guiana contains contours for ConceptDraw DIAGRAM diagramming and vector drawing software. This library is contained in the Continent Maps solution from Maps area of ConceptDraw Solution Park.
Use the French Guiana library to draw thematic maps, geospatial infographics and vector illustrations for your business documents, presentations and websites.
Geo Map - South America - Guiana

Geo Map - South America - French Guiana Contour
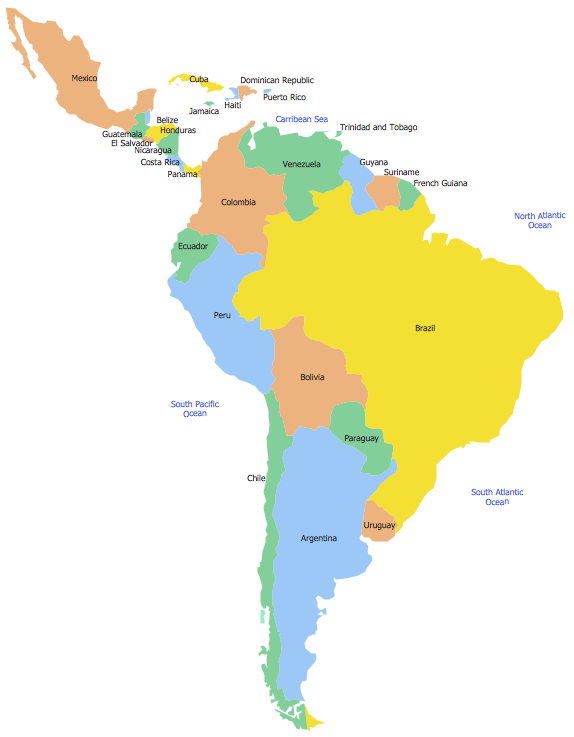
Geo Map - South America
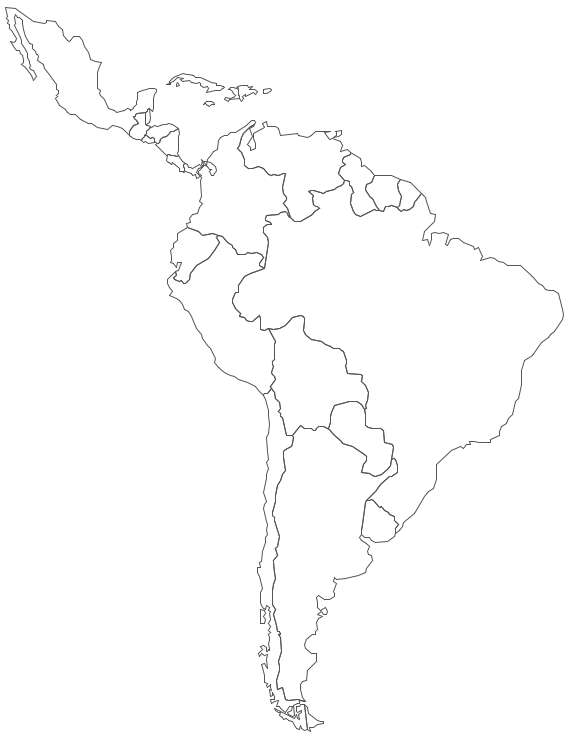
Geo Map - South America Contour
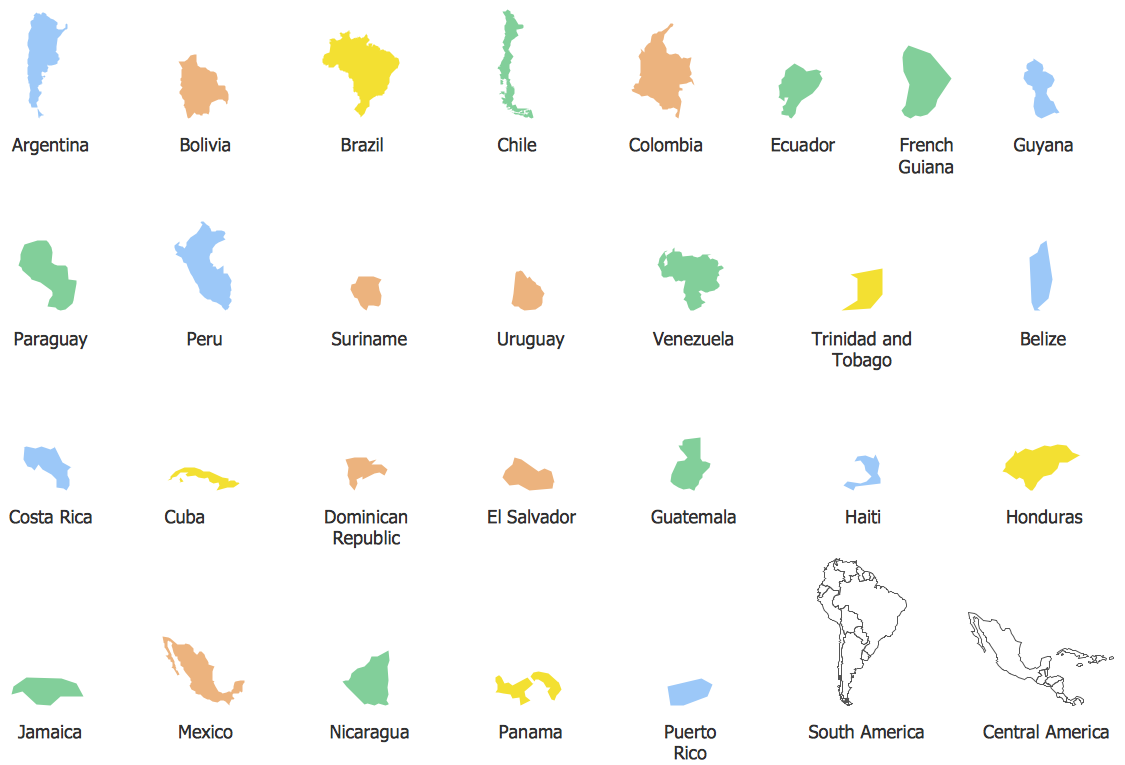
Geo Map - contours of South America countries
See also Geo Maps of South America Countries :
FIVE RELATED HOW TO's:
Panama, officially Republic of Panama, is the southernmost country of Central America and the whole of North America.
The vector stencils library Panama contains contours for ConceptDraw DIAGRAM diagramming and vector drawing software. This library is contained in the Continent Maps solution from Maps area of ConceptDraw Solution Park.
Picture: Geo Map - South America - Panama
Related Solution:
The vector stencils library Estonia contains contours for ConceptDraw DIAGRAM diagramming and vector drawing software. This library is contained in the Continent Maps solution from Maps area of ConceptDraw Solution Park.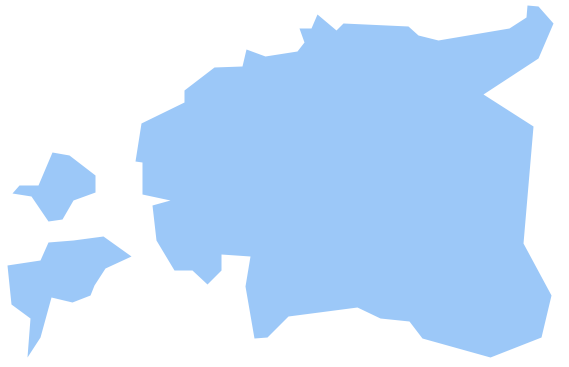
Picture: Geo Map - Europe - Estonia
Related Solution:
The vector stencils library Sweden contains contours for ConceptDraw DIAGRAM diagramming and vector drawing software. This library is contained in the Continent Maps solution from Maps area of ConceptDraw Solution Park.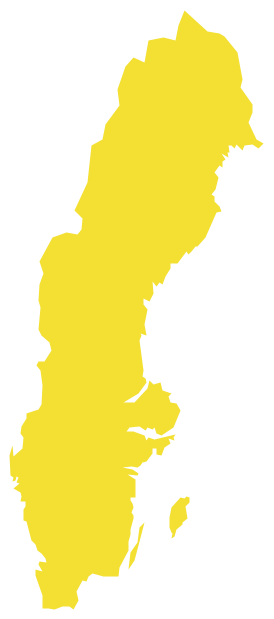
Picture: Geo Map — Europe — Sweden
Related Solution:
Colombia, officially the Republic of Colombia, is a unitary, constitutional republic comprising thirty-two departments.
The vector stencils library Colombia contains contours for ConceptDraw DIAGRAM diagramming and vector drawing software. This library is contained in the Continent Maps solution from Maps area of ConceptDraw Solution Park.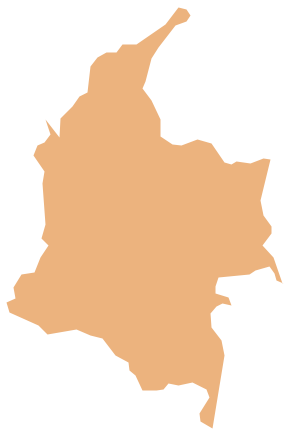
Picture: Geo Map - South America - Colombia
Related Solution:
Greece is strategically located at the crossroads of Europe, Asia, and Africa.
The vector stencils library Greece contains contours for ConceptDraw DIAGRAM diagramming and vector drawing software. This library is contained in the Continent Maps solution from Maps area of ConceptDraw Solution Park.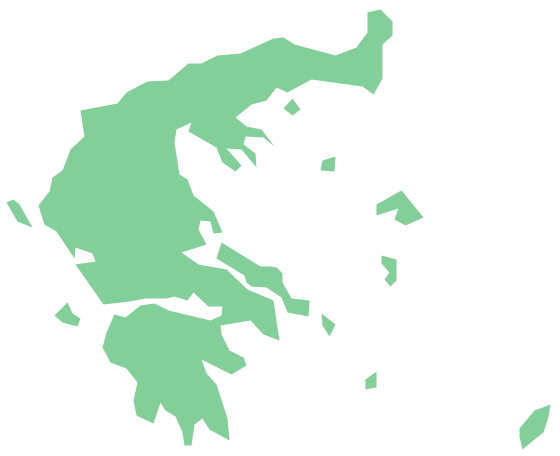
Picture: Geo Map — Europe — Greece
Related Solution:



