Campus Area Networks (CAN).
Computer and Network Examples
The modern education system, one way or another, aims to form students' abilities to work with information. It is no coincidence that the prior areas of education development pay special attention to form skills of information processing, which later becomes the mainstay of professional activity of graduates in the information society, a necessary component of information culture. In such circumstances, students will acquire the necessary knowledge to express themselves creatively, learn to evaluate the accuracy of the information, develop critical thinking, and distinguish information and knowledge.
Local networks are common in the education field. Most schools and other educational institutions have computers connected to a local network. At the same time, modern technologies allow to connect even the computers that are on different continents, and not only in the same room or building. Numerous educational institutions have branches in different countries, with computer connected via local network. Moreover, local area networks can connect computers from different colleges or universities.
Using Internet, any student can get public access to education materials that can be presented in the form of simple textbooks (e-text), as well as in the form of complex interactive systems, computer models of virtual learning environments, etc. The number of users and information sources of Internet is continuously increasing. In addition, there is a constant quality of telecommunications services improvement. Because of this, not only companies and organizations operating in the economic and other fields have a high-quality access to the Internet, but also educational institutions.
Many systems are susceptible to vulnerabilities that can take full control of critical resources (e-mail systems, network equipment management and others). Critical vulnerabilities are often associated with the use of outdated versions of software and operating systems.
Studies have shown that the modern corporate networks are quite vulnerable to attacks from internal and external intruders. The ability to access the critical resources of most examined systems leads to the conclusion about the necessity of the information security measures improvement, particularly in the area of password policies, web application protection, providing regular security updates and protection of privileged accounts. For safety deficiencies early detection, system administrator should regularly conduct security analysis, including the form of penetration testing.
A Campus Area Network (CAN) is a computer network that links the buildings and consists of two or more local area networks (LANs) within the limited geographical area. It can be the college campus, enterprise campus, office buildings, military base, industrial complex. CAN is one of the type of MAN (Metropolitan Area Network) on the area smaller than MAN.
The Campus networks usually use the:
- LAN technologies,
- such as Ethernet,
- Token Ring,
- Fiber Distributed Data Interface (FDDI),
- Fast Ethernet,
- Gigabit Ethernet
- Asynchronous Transfer Mode (ATM).
ConceptDraw DIAGRAM is a powerful diagramming and vector drawing software that allows quick and easy draw the Campus Area Networks.

Example 1. Computer and Networks area
Computer and Networks Area provides solutions that contain the libraries with a great number of predesigned vector stencils, a set of professional looking examples that you can change for your needs.

Example 2. Computer and Networks examples

Example 3. Computer and Networks symbols for drawing Campus Area Network
All these allow you create the Campus Area Network of any complexity in a few minutes.

Example 3. Campus Area Network (CAN).
This example was created in ConceptDraw DIAGRAM using the Computer and Networks Area of ConceptDraw Solution Park and shows the Campus Area Network.
Campus network can be additional to the set of wireless connections, connect several buildings to the same network, but it's not the same thing. A campus network should be broad enough to cover a large territory, while the point-to-point access simply distributes a separate network within the territory of several buildings. Project Athena at MIT and Stanford University Network at Stanford University are the most well-known networks. Athena was launched in 1983 and it still works. It’s primary purpose was to share experience, code and ideas among students, to found a base of knowledge for the future generations and to develop educational tools. This project influenced the development of instant messaging, online help systems, improved client–server model of distributed computing, developed Kerberos protocol for encrypted authentication and authorization and has many other functional and system management advantages. Some of Athena architecture design features are used beyond MIT, for example in Iowa State University and North Carolina State University.
All networks designed with ConceptDraw DIAGRAM are vector graphic documents and are available for reviewing, modifying, and converting to a variety of formats (image, HTML, PDF, MS PowerPoint, Adobe Flash or MS Visio).
See also Samples:
TEN RELATED HOW TO's:
Structured-systems analysis and design method uses data flow diagrams to represent the process of data flowing through a system. Talking about this might be useless without a proper example of DFD for online store (Data Flow Diagram). This DFD example shows all the distinctness that a diagram can bring into a scattered data structure.
Data flow diagrams are used to show how data is processed within some business processes. Making DFD is a common practice for business process modeling and analysis. This diagram represents the online store business flow. It describes inputs and outputs within online selling process and depicts the interactions between its participants. This DF diagram can be used by system analysts to create an overview of a business, to study and discover its inherent strengths and weak points.
Picture: Example of DFD for Online Store (Data Flow Diagram)
Related Solution:
Working with information can be quite tedious, furthermore, some data can be quite difficult to perceive without any graphic representation. So, to facilitate your work, you can use business diagrams, such as simple flowcharts or Gantt charts for project management and orgcharts for clarifying your company structure. You can use a proper software, like ConceptDraw Pro, draw them on paper, or use whiteboards, but it is more convenient to use a digital tool.
This diagram shows a cross-functional flowchart that was made fore telecom service provider. A workflow of a common telecommunication service provider has a rather branched structure. Thus, it is useful to have a flow chart to visualize the sequences and interrelations of the work flow steps. Business process flowchart contains 17 processes and 4 decision points,that are distributed through 2 lines depicting the participants involved. Also there are connectors that show the data flow within processes. This flowchart displays a detailed model of the telecom service trading process, as well as all participants in the process and how they interact with each other.
Picture: Business diagrams & Org Charts with ConceptDraw DIAGRAM
Few other areas benefited as much from the development of advanced digital drawing software as interior design. Previously only done by professionals, nowadays it is made available to virtually anyone with the help of software such as ConceptDraw DIAGRAM. You can design whatever you want - a living room, an office, a garage, a school layout - design elements provided by ConceptDraw DIAGRAM fit all of these purposes. All you need to get started is your creativity and the right software tools.
This library of vector graphic objects includes images of different school furniture and equipment related to school or training classes interior. These graphical elements are embedded into the ConceptDraw School and Training Plans solution. You can use them when designing interior layout of classroom or training office.Organization of the learning environment is an important element of a students learning. By using ConceptDraw DIAGRAM you can easily visualize and present your ideas related to any classes layout.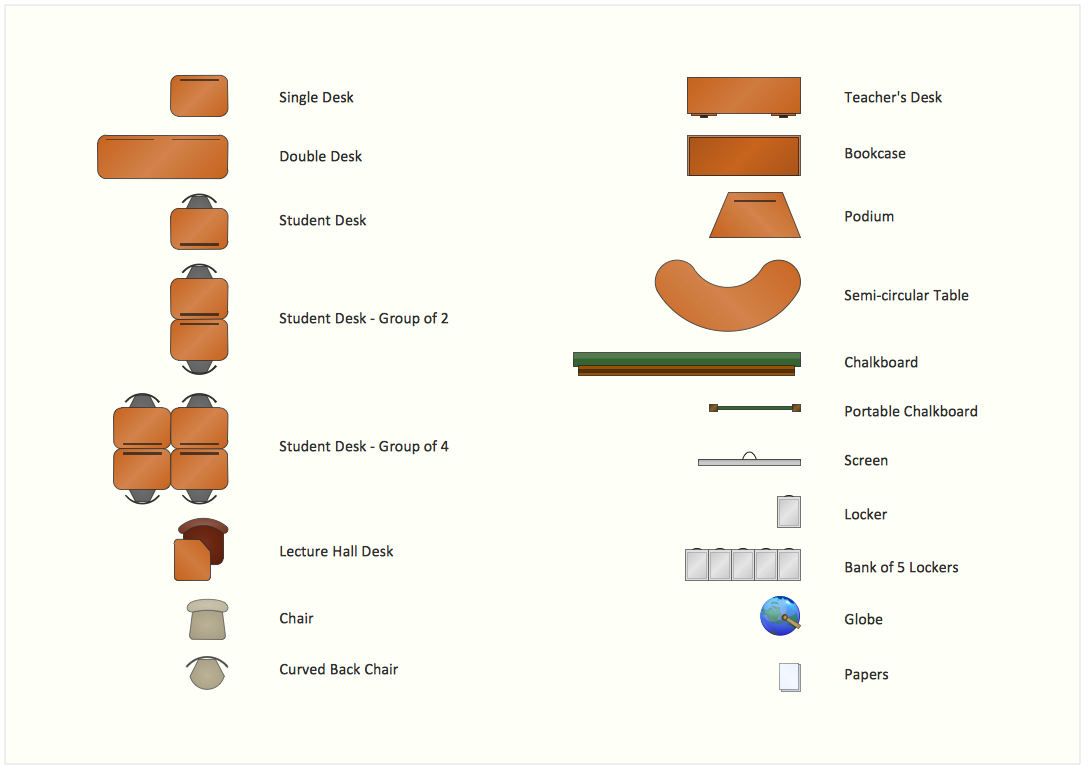
Picture: Interior Design. School Layout — Design Elements
Related Solution:
Remote Networking - We explain the method most people use to connect to the Internet.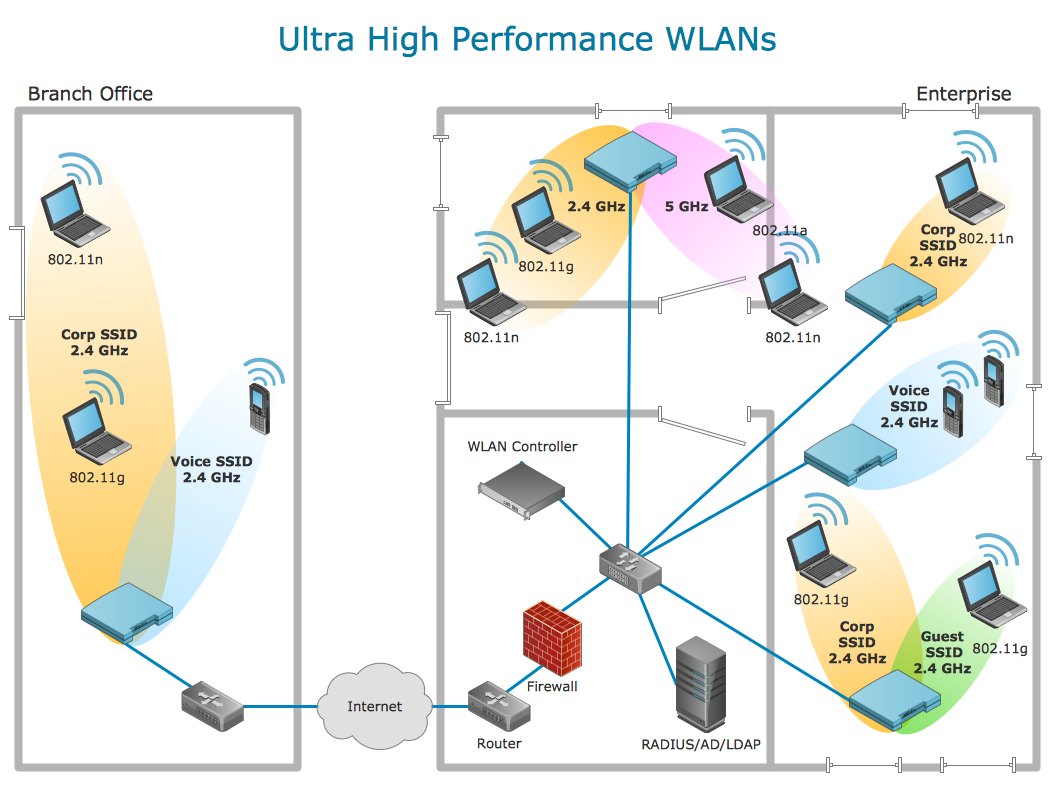
Picture: Using Remote Networking Diagrams
This sample was created in ConceptDraw DIAGRAM diagramming and vector drawing software using the UML Class Diagram library of the Rapid UML Solution from the Software Development area of ConceptDraw Solution Park.
This sample describes the use of the classes, the generalization associations between them, the multiplicity of associations and constraints. Provided UML diagram is one of the examples set that are part of Rapid UML solution.
Picture: UML Class Diagram Generalization ExampleUML Diagrams
Related Solution:
Network infrastructure planning is a very important process in the network construction, and the share of time allocated to this within the scope of the entire project may reach 60-80%. A competent and thorough approach to planning contributes to the quick investment return, and also increases the reliability and flexibility of the final system, reducing the probability of additional costs related to the incorrect implementation.
Any planning begins with an analysis of the business requirements to the final system. Basic network parameters, which should be assessed are the scalability, accessibility, cost, speed and safety.
Speed and cost are often mistaken for the most important parameters, and the rest of the parameters aren't even remembered. This is not entirely correct. Initially, it is necessary to assess the business plans for the future, because sometimes it is more profitable to invest more money in the beginning. If the business is to develop, then, consequently, demands on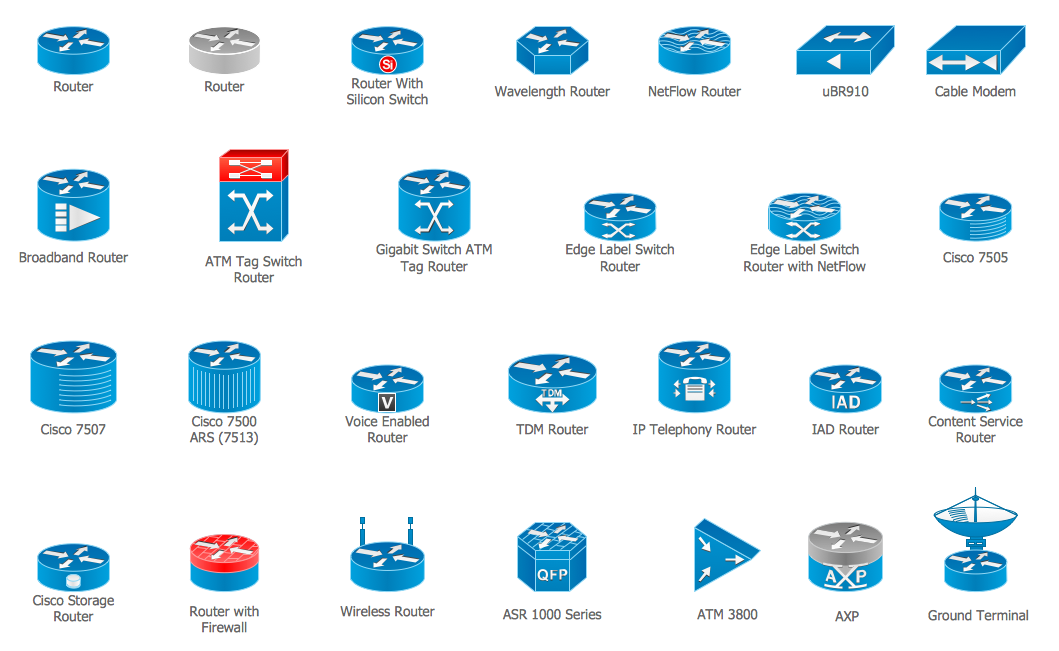
Picture: Cisco Routers. Cisco icons, shapes, stencils and symbols
Related Solution:
Any wireless network is some computer network that can use any needed wireless data connections that can be placed between the network nodes. Any wireless networking is known to be one of the methods by which both telecommunications networks and business installations, same as the homes avoid the process of introducing the cables into some building.
Drawing some wireless computer network as it may be a challenge, especially for those who do not have as much experience of doing it. That is why the CS Odessa team has developed the Wireless Networks solution so it can be used for simplifying all the ConceptDraw DIAGRAM users work on the needed diagrams.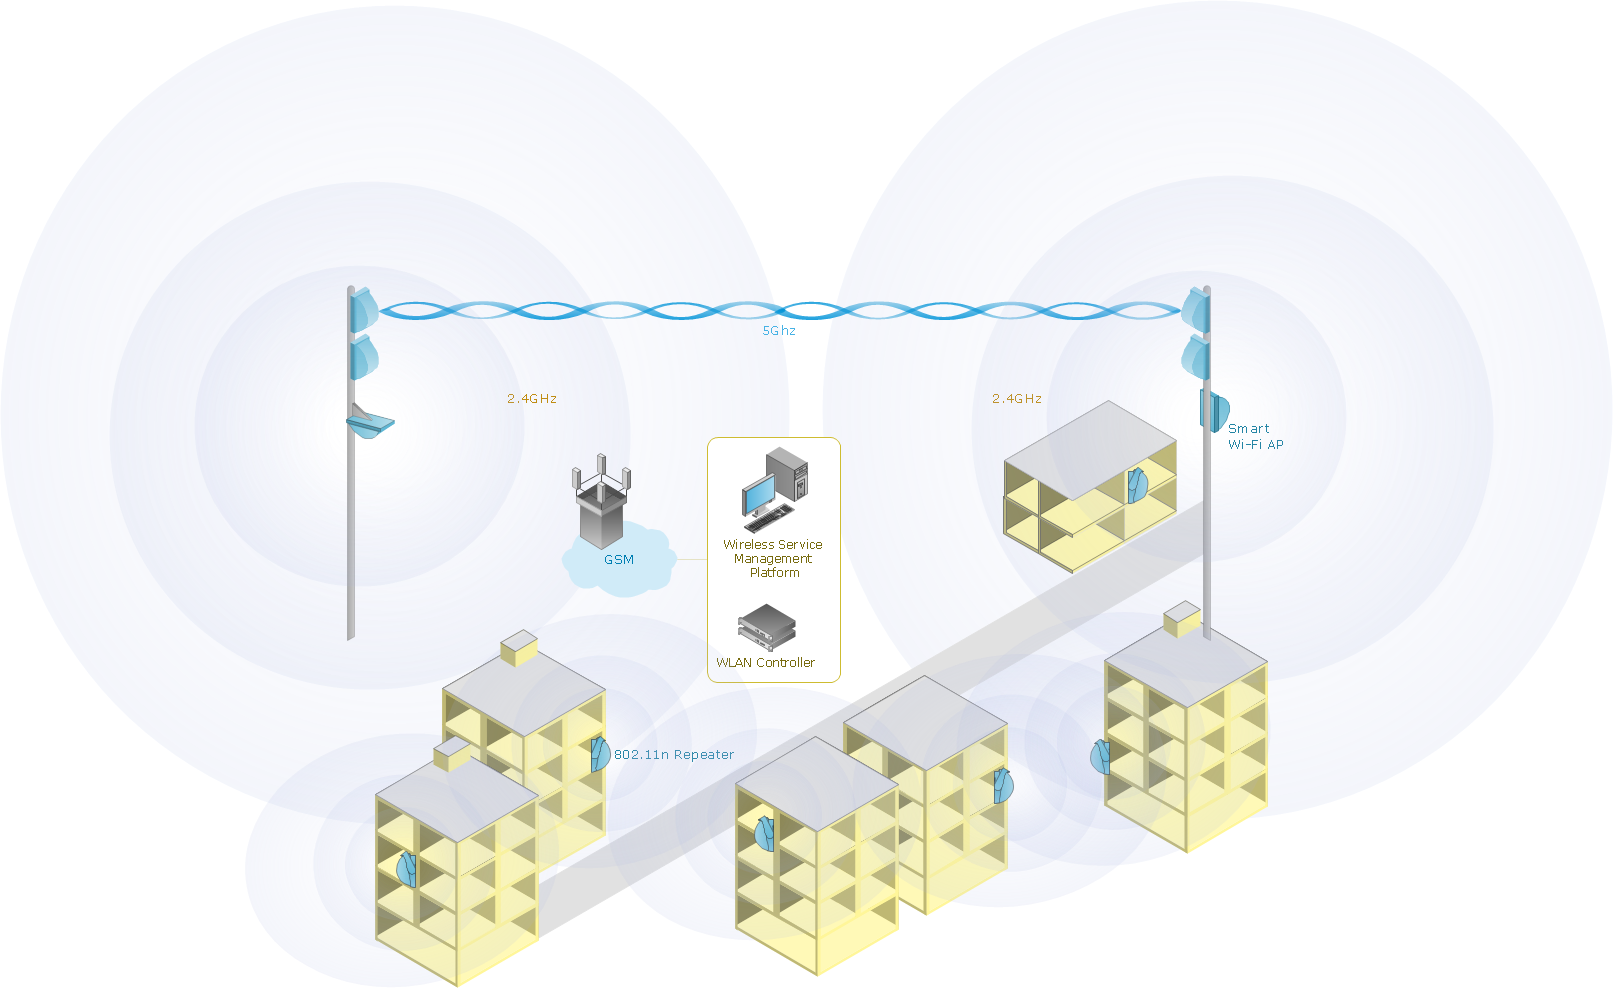
Picture: Calculate the cost of creating or updating a wireless computer network
Related Solution:
You are probably familiar with diagrams. But have you ever thought that they would be useless? Follow the recommendations and design useful Flowcharts of any type with Flowcharts solution ✔️ easily, ✔️ quickly, ✔️ efficiently
Picture: Diagrams Mean Nothing
Related Solution:
What is a Concept Map and what software is effective for its design? A concept map or conceptual diagram is a diagram that depicts suggested relationships between concepts. As for effective software - we suggest you to pay attention for the ConceptDraw DIAGRAM diagramming and vector drawing software. Extended with Concept Maps Solution from the Diagrams Area it is a real godsend for you.
Picture: What Is a Concept Map
Related Solution:
When we start to speak about databases, we must always mention database structure visualization. One of the most common ways to do it is to create an entity relationship diagram, and to put appropriate symbols on it. It is important either for database projecting and for its' future maintenance.
Entity Relationship Diagram describes data elements and their relationships within a database. There are a set of special symbols that depict each element of an entity relationship diagram. Entities - represents some stable components such as supplier, employee, invoice, client, etc. Relation symbols show how the entities interact. Attributes define characteristics of the relationships. Attributes can be one-to-one or many-to-many. Physical symbols is used in the physical models. They represent items such as fields, tables, types and keys. ERD physical symbols are the building material for the database. Notation lines are used to illustrate the relationships. The most common method is Crow’s Feet notation. You can use ConceptDraw Entity-Relationship Diagram (ERD) solution to represent a database using the Entity-Relationship model.
Picture: Entity Relationship Diagram Symbols
Related Solution:

