Made with
ConceptDraw
DIAGRAM 18

How to Construct a Fishbone Diagram

What is Fishbone, Ishikawa or Cause and Effect Diagram

A Cause and Effect diagram or Fishbone diagram shows the key points of business issues. So, let’s find out more about a Cause and Effect diagram.

This diagram helps understand the reasons of completed or potential actions by structuring their causes in smaller categories. Also, one can use it to see how the contributing factors are related to each other.

In everyday company routine, a Cause and Effect diagram is helpful with a number of regular activities like brainstorming, project management, and problem solving. A Cause and Effect diagram is often called a Fishbone diagram or Ishikawa diagram. It is also included into the Seven Basic Tools of Quality.

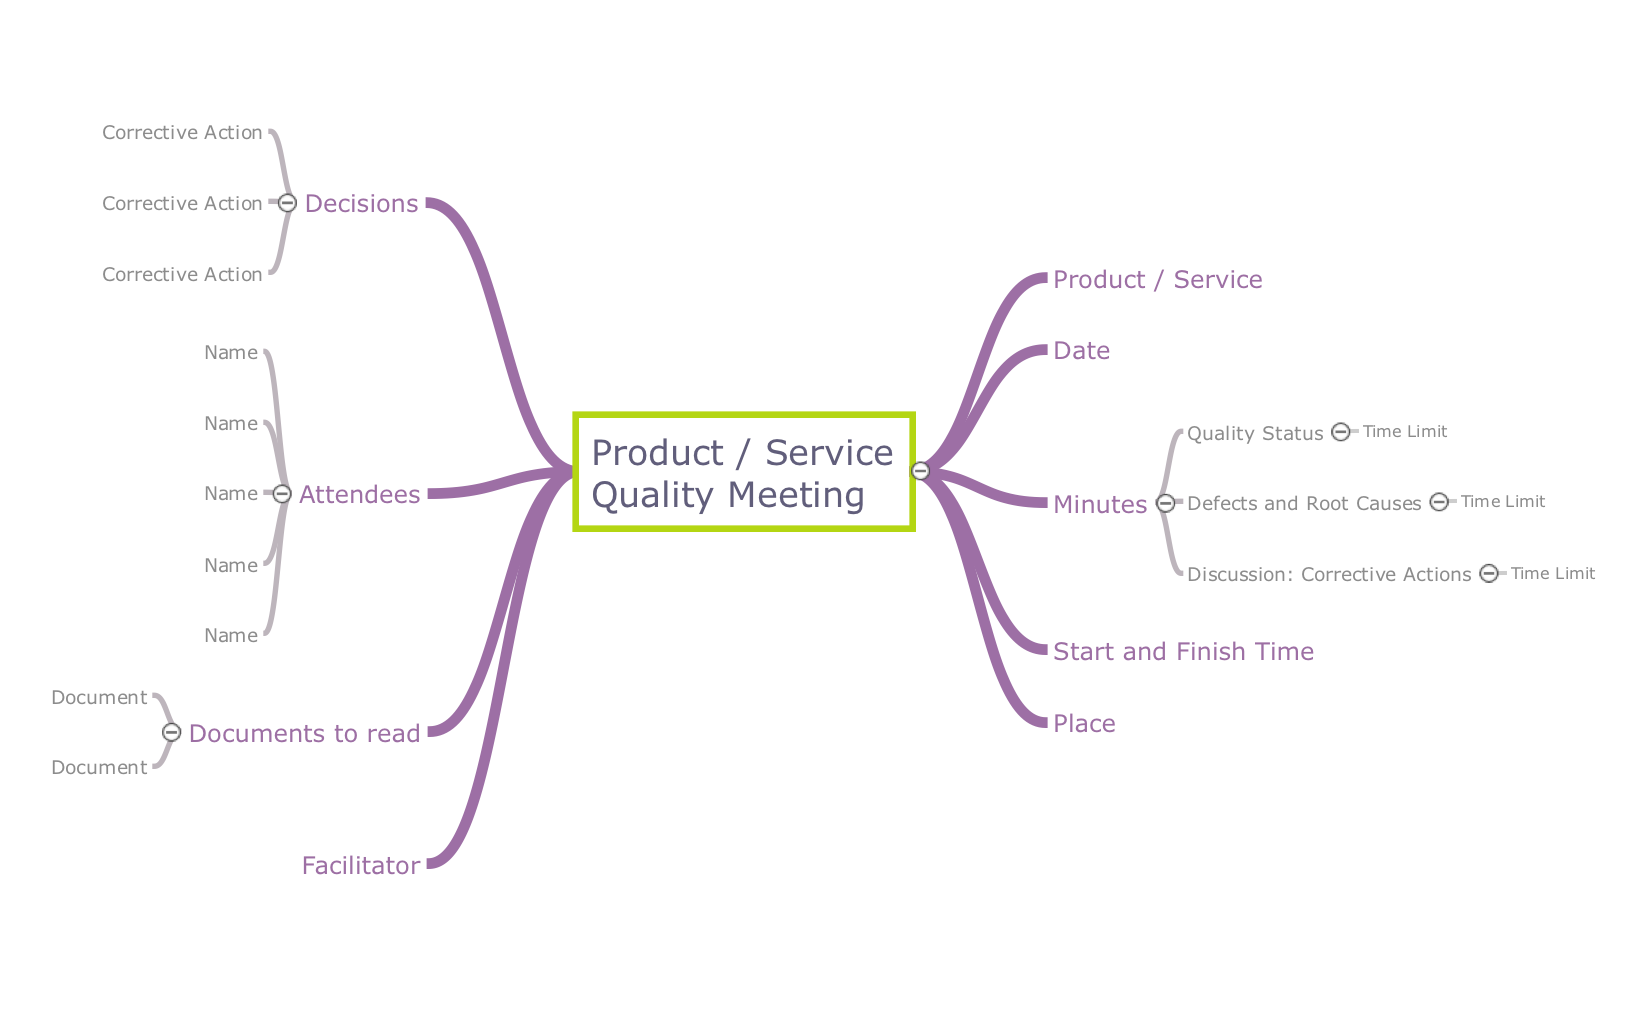
They are called Fishbone Diagrams because the outline of the finished diagram resembles a fish’s skeleton – with the ‘fish’s head’ on the right and ‘the tail’ on the left. Most such diagrams include common potential causes for any issue in question.

How to Construct a Fishbone Diagram

How to Construct a Fishbone Diagram? Construction a Fishbone diagram in professional diagramming software ConceptDraw DIAGRAM is more easy than you think. Just use the predesigned vector elements from the Fishbone Diagrams library for Fishbone Diagrams solution or one of plenty Fishbone templates and examples, and you will get a Cause and Effect diagram in minutes. Follow next steps for the constructing:

  • Launch ConceptDraw DIAGRAM
  • Set a page orientation: File – Page Setup – Horizontal Orientation – Ok.

    How to Create a Fishbone Diagram

  • Open the Fishbone Diagrams library on the Libraries panel:

    How to Create a Fishbone Diagram

  • Take an Effect (rectangle head) object from the library. Place it on the page.

    How to Create a Fishbone Diagram

  • Take a Category object from the library. Connect it to one of the connection points.

    How to Create a Fishbone Diagram

  • Repeat it as many times as necessary.

    How to Create a Fishbone Diagram

  • Name the categories.

    How to Create a Fishbone Diagram

  • Take a Cause object from the library. Connect it to the Category object.

    How to Create a Fishbone Diagram

  • Holding down the Option key (ALT), copy the object. Place it on the diagram.

    How to Create a Fishbone Diagram

  • Name the Causes.

    How to Create a Fishbone Diagram

  • Take a Reason (secondary cause) object from the library. Connect it to the Cause object.

    How to Create a Fishbone Diagram

  • Holding down the Option key (ALT), copy the object. Place it on the diagram.

    How to Create a Fishbone Diagram

  • Select the Category objects. Holding down the Shift key, click successively on the needed objects.
  • Open Color menu from the Toolbar – Shape Color – Change the color.

    How to Create a Fishbone Diagram

  • Open the Text tab in Inspectors – Change text color.

    How to Create a Fishbone Diagram

  • Select the diagram excluding the Effect object.
  • Use Cmd+A – Holding down the Shift key, click the Effect object.
  • Open the Line tab in Inspectors. Change the color.

    How to Create a Fishbone Diagram

  • Select the arrow of the Effect object. Open the Line tab in Inspectors.
  • Make the color same as of Category objects using the Eyedropper tool.

    How to Create a Fishbone Diagram

  • Select the Cause text – Change Color.

    How to Create a Fishbone Diagram

  • Set Alignment.

    How to Create a Fishbone Diagram

  • Select the Reason objects. Holding down the Shift key, click successively on the needed objects.
  • Open the Text tab in Inspectors. Set Color, Font, Size and Alignment.

    How to Create a Fishbone Diagram

  • Take a Fish frame from the library. Place it on the page.

    How to Create a Fishbone Diagram

  • Open the Line tab in Inspectors – Change Color and Width.

    How to Create a Fishbone Diagram

  • Select the rectangle head of the Effect object – delete it.

    How to Create a Fishbone Diagram

  • Use the Search option on the Library panel to find a needed object.

    How to Create a Fishbone Diagram

  • Take a Coffee cup object. Place it on the diagram.

    How to Create a Fishbone Diagram

  • Now your Drawing is ready.
  • You may save it or export to different formats via the File menu.
How to Construct a Fishbone Diagram *

The possibility of exporting to variety of popular graphical formats (PNG, JPEG, JPG, GIF, TIF, TIFF, BMP, DIB, EMF, SVG) and file formats, such as Microsoft PowerPoint (PPT), Adobe Acrobat (PDF), Microsoft Visio (VDX, VSDX), Adobe Flash (SWF), Encapsulated PostScript (EPS), HTML, opens wide opportunities for you.

The Fishbone Diagrams Solution for ConceptDraw DIAGRAM Solution Park is available for all ConceptDraw DIAGRAM or later users. Use it for easy and effective cause and effect analysis and problem solving.


TEN RELATED HOW TO's:
Create a Pie Chart with ConceptDraw software quickly and easily. The simple tutorial helps you learn how to create a pie chart.How to Create a Pie Chart *
Picture: How to Create a Pie Chart
Related Solution:
The knowledge and ability to apply various strategies for dealing with problems and difficult situations is very useful in many areas. The Fishbone strategy is one of the most progressive. This graphical technique helps to identify possible causes of problems, to set the goals, and also show internal connections between the different parts of problem. After reviewing all causes and facts, you can easily find right solution. ConceptDraw DIAGRAM diagramming and vector drawing software extended with Fishbone Diagrams Solution from the Management Area of ConceptDraw Solution Park is a powerful Fishbone Problem Solving tool.Fishbone Problem Solving *
Picture: Fishbone Problem Solving
Related Solution:
Electrical Engineering Solution used together with ConceptDraw DIAGRAM drawing facilities makes short a work of drawing various electrical and electronic circuit schemes. A library of vector objects composed from symbols of Analog and Digital Logic elements of electric circuit includes 40 symbolic images of logic gates, bistable switches of bi-stable electric current, circuit controllers, amplifiers, regulators, generators, etc. All of them can be applied in electronic circuit schemes for showing both analog and digital elements of the circuit. Electrical Engineering Solution used together with ConceptDraw DIAGRAM drawing facilities makes short a work of drawing various electrical and electronic circuit schemes. A library of vector objects composed from symbols of Analog and Digital Logic elements of electric circuit includes 40 symbolic images of logic gates, bistable switches of bi-stable electric current, circuit controllers, amplifiers, regulators, generators, etc. All of them can be applied in electronic circuit schemes for showing both analog and digital elements of the circuit.Electrical Diagram Symbols
Picture:
Electrical Diagram Symbols F.A.Q.
How to Use Electrical ConceptDraw Diagram Software
Related Solution:
The Venn diagram example below shows sustainable development at the confluence of three constituent parts. Create your Venn diagrams for problem solving in environmental social science using the ConceptDraw DIAGRAM software.Venn Diagram Examples for Problem Solving - Human Sustainability Confluence
Picture:
Venn Diagram Examples for Problem Solving
Environmental Social Science
Human Sustainability Confluence
Related Solution:
This example shows the OOSE method. It was created in ConceptDraw DIAGRAM diagramming and vector drawing software using the Rapid UML Solution from the Software Development area of ConceptDraw Solution Park.Examples for OOSE Method *
Picture: Examples for OOSE Method
Related Solution:
A flowchart is a simple but very functional tool when it comes to understanding a workflow or to removing unnecessary stages from a process. When drawing flowcharts, keep in mind that there are four common types of flowcharts, like document flowcharts and data flowcharts that show control over a data or document flow over a system. To show controls on a physical level, use system flowcharts. In addition, to show controls in a program, you can draw a program flowchart. This flowchart diagram represents the piece of an article editing process, that involves the author and editor. It was created using the Basic Flowchart notation that consists from the basic flowchart symbols. The start and the end of the process are indicated with "Terminator" symbols. The "Process" symbols show the action steps consisting from making edits and searching for a compromise, when the author does not agree with the suggestions of the editor. The "Process" symbol is the general symbol in process flowcharts. The "Decision" symbol indicates a branching in the process flow. There are two branches indicated by a Decision shape in the current flowchart (Yes/No, Disagree/Agree). This basic flowchart can be used as a repeating unit in the workflow diagram describing the working process of some editorial office.Types of Flowcharts *
Picture: Types of Flowcharts
Related Solution:
Imagine the diagram which is looking smart. That is how ConceptDraw Arrows10 Technology or Smart connectors work. Thanks to auto-routing feature connectors flow around objects. But if you want some background objects that the connectors flow through - that is also possible to do.ConceptDraw Arrows10 Technology *
Picture: ConceptDraw Arrows10 Technology
The Affinity Diagram shows the structure of large, complex factors that have an influence on a problem, and then divides them up into a smaller and simpler structure. The Affinity Diagram does not show a causal relationship between the factors. This diagram is designed to prepare the data for further analysis of the cause-effect relationships.Affinity Diagram *
Picture: Affinity Diagram
Related Solution:
Value Stream Map template helps you to create VSM diagrams using ConceptDraw DIAGRAM software.How To create Value Stream Map (VSM) *
Picture: How To create Value Stream Map (VSM)
Related Solution:
This sample shows the Six Markets Model Chart. It was created in ConceptDraw DIAGRAM diagramming and vector drawing software using the Marketing Diagrams Solution from the Marketing area of ConceptDraw Solution Park. The six markets model defines six markets that take the central place in the relationship marketing: internal markets, supplier markets, recruitment markets, referral markets, influence markets and customer markets. The six markets model allows the organization to analyze the stakeholders and key market domains that can be important to it.Six Markets Model Chart *
Picture: Six Markets Model Chart
Related Solution:
ConceptDraw
DIAGRAM 18