Baseball Diagram
Basic Bunt Coverage – Runner at 2nd
"With a runner on second base, the batter will almost always try to bunt the ball towards third base. Both the first baseman and pitcher will crash and try to get the out at third, so the batter wants to keep the ball away from the charging players. But if the third baseman has to come off the base to field the ball, there’s no way he can get an out at third, and the sacrifice will be successful.
Executing bunt coverage with a runner on second forces the defense to decide quickly if they can get an out at third, or if the smart play is to first base. Much of this responsibility inevitably falls on the third basemen, but each position has an important role to fill as well." [iSport Baseball]
Drawing baseball diagrams using ConceptDraw DIAGRAM software extended with the Baseball solution saves your time, and adds more value to your work. You can easily convert vector drawing to a popular graphic format and then post it to your blog or site. There is no problem to add your logo or text copyright, or use some text comments to make your diagrams unique and recognizable.
A combination of the "Baseball Fields" and "Baseball Positions" libraries gives you an ability to create a baseball-related drawing in seconds. Follow next steps to create you own baseball schema:
- From the "Baseball Fields" library drop a field object to your document
- From the "Baseball Positions" library drop all positions object you need to your document
- Place positions on the field according to your drawing idea
- Add arrows or text labels if needed.
Baseball plays may be hard to explain with a single diagram. In this case you can break your explanation into some stages, and place each stage onto a different page. You don't need to draw from the start point each time, just copy and paste basic drawing to different pages, and then add arrows and text labels in order you talk about them. When you start presenting using F5 button, pages will appear one by one, that allows your audience to understand how players change their positions etc.
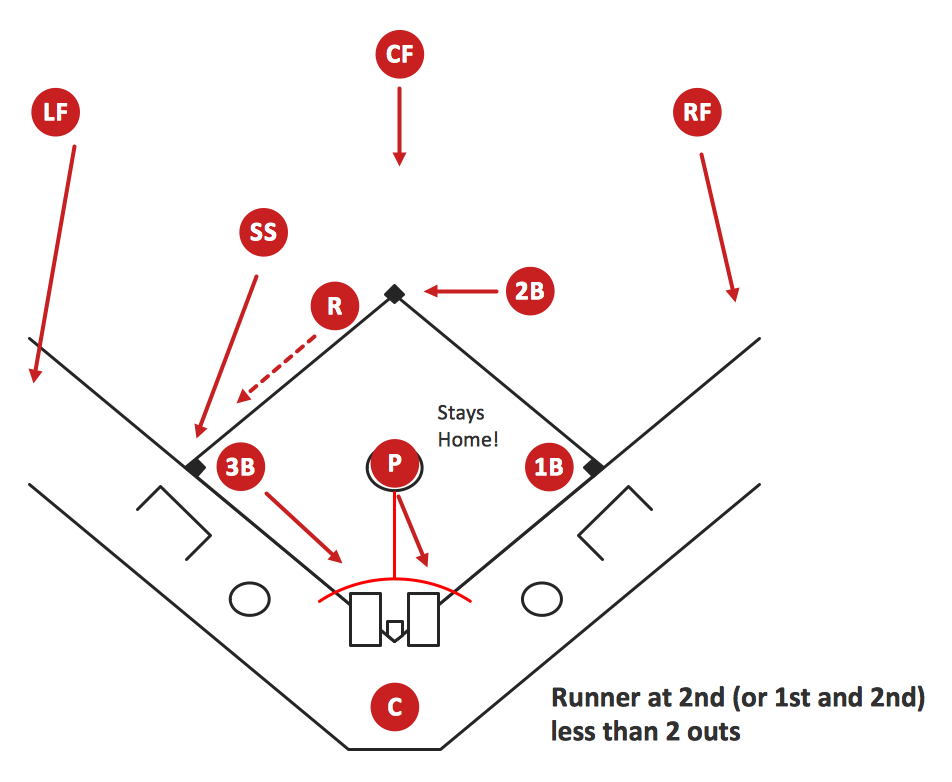
Sample 1. Baseball Diagram – Basic Bunt Coverage – Runner at 2nd.
This diagram was created in ConceptDraw DIAGRAM using the "Baseball Positions" library from the Baseball Solution. An experienced user spent 10 minutes creating this sample.
It demonstrates a portion of the solution's capabilities and the professional results you can achieve.
All source documents are vector graphic documents. They are available for reviewing, modifying, or converting to a variety of formats (PDF file, MS PowerPoint, MS Visio, and many other graphic formats) from the ConceptDraw STORE. The Baseball Solution is available for all ConceptDraw DIAGRAM or later users.
TEN RELATED HOW TO's:
The Football solution for ConceptDraw DIAGRAM software contains a set of libraries, templates and samples allowing football specialists to draw football diagrams with ease. A set of predesigned fields and positions allows producing football diagrams without any drawing experience.-Sample.png)
Picture: Shotgun Formation (Offense) Diagram
Related Solution:
It's obvious that any building has a plan, and it is a hard and diligent work to draw one. And it's great that nowadays there are software tools for those purposes. For instance, ConceptDraw Pro contains design elements depicting different parts of sport fields. It's easy to use them and it facilitates your work exponentially.
Planning of athletic facilities, playgrounds and Leisure Centers, needs thoughtful and creative approach. Any layout regarding to sport facilities should satisfy the requirements of both athletes and spectators. Well designed sport fields , playgrounds and recreation spaces attract people to sport activities in the cities and countryside. ConceptDraw Sport Field Plans solution is useful and convenient professional drawing tool. It delivers the kit of vector libraries that can be used for representing sport fields, sportgrounds and recreation spaces: football, hockey, volleyball, cricket, basketball , swimming pool, etc.
Picture: Building Drawing Software for Design Sport Fields
Related Solution:
Visual depiction is key secret to successful understanding baseball strike zone dimentions. Baseball strike zone diagram illustrated using ConceptDraw DIAGRAM software enhanced with the Baseball solution.
Picture: Baseball — Pitching and the Strike Zone
Related Solution:
Thanks to the Soccer solution you can design your own soccer-related drawings, diagrams, schemes in seconds. It’s very simple and convenient because Soccer solution contains incredible quantity of ready-to-use predesigned vector objects, professional templates and samples.
Picture: 2014 FIFA World Cup
Related Solution:
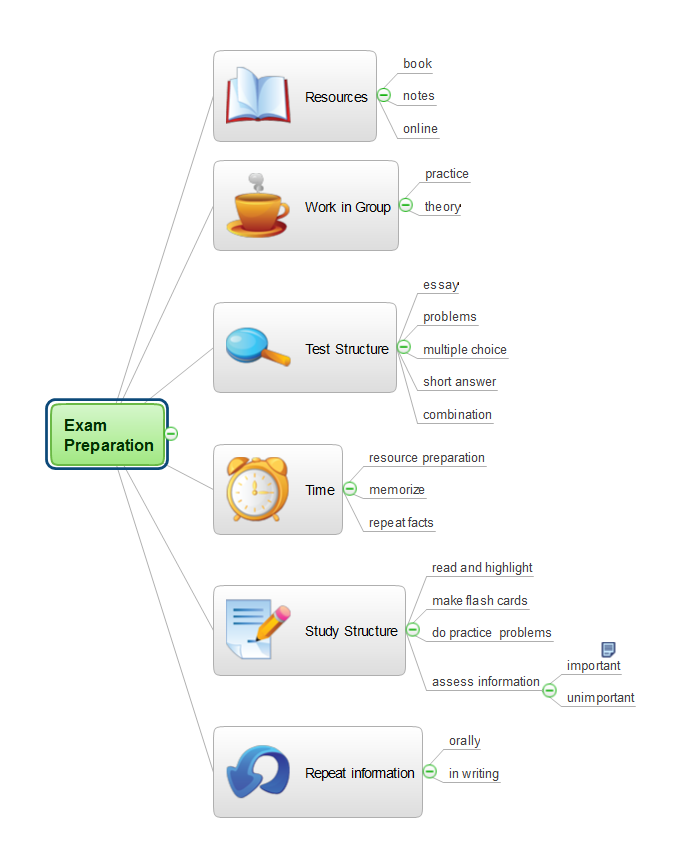
Picture: Exam Preparation Mind Map
Related Solution:
Using the diagrams is the easiest way for coaches and other sport specialists to explain the rules, strategies and tactics of the basketball play. The Basketball solution from the Sport area of ConceptDraw Solution Park was designed as a tool that will help you produce the basketball plays diagrams in a few minutes.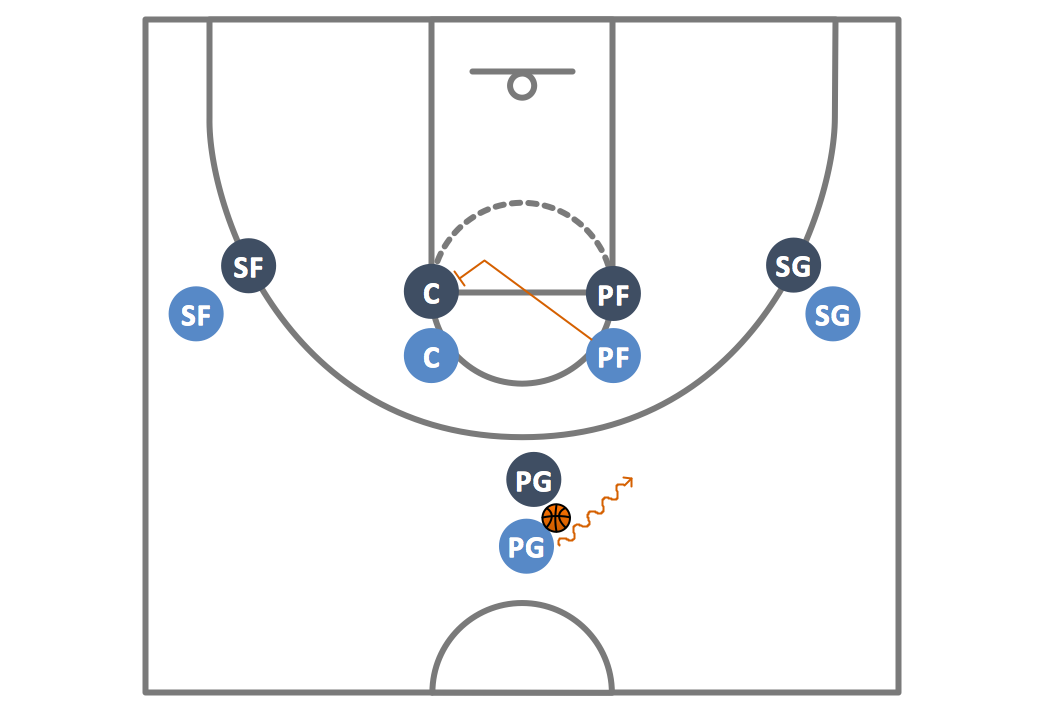
Picture: Basketball Plays Diagrams
Related Solution:
Fishbone Diagram, also referred as Cause and Effect diagram or Ishikawa diagram, is a fault finding and problem solving tool. Construction of Ishikawa diagrams is quite complicated process and has a number of features.
Fishbone Diagrams solution included to ConceptDraw Solution Park contains powerful drawing tools and a lot of examples, samples and templates. Each Fishbone diagram example is carefully thought-out by experts and is perfect source of inspiration for you.
Picture: Fishbone Diagram Example
Related Solution:
Functional modeling allows to make complex business processes simple. One of the basic methods is IDEF0 and one of the most effective also. To create a business model, use flowchart symbols.
The IDEF0 library, supplied with ConceptDraw IDEF0 Diagrams solution contains 18 IDEF0 basic notation symbols. All symbols are the vector graphic images what means, that one can customize their size preserving the stable quality. Another library of IDEF0 symbols can be find out in the the Business Process Diagrams solution, included to the Business Processes section of ConceptDraw Solution Park. These libraries composed from just vector objects and are totally compatible. You can apply the IDEF0 symbols from both libraries at your flowcharts, if needed.
Picture: IDEF0 Flowchart Symbols
Related Solution:
Create bar charts for event management problem solving and visual data comparison using the ConceptDraw DIAGRAM diagramming and vector drawing software extended with the Bar Graphs Solution from the Graphs and Charts area of ConceptDraw Solition Park.
Picture: Bar Diagrams for Problem Solving.Create event management bar charts with Bar Graphs Solution
Related Solution:
What is landscape design? It's a floor plan but for an outdoor area.
Same as a floor plan, a landscape design represents visually any site using scaled dimensions.
The main purpose of landscape design is to plan the layout for an outdoor area no matter is it a personal site plan for your home or a commercial plan for business. It may also be handful when a new installation, repair or even an outdoor event is planning.
It helps to calculate time and decide which materials should be used in your project. Landscape designs perfectly gives the property owner and landscape contractor better vision for cost estimation, helping to ensure the project time and budget.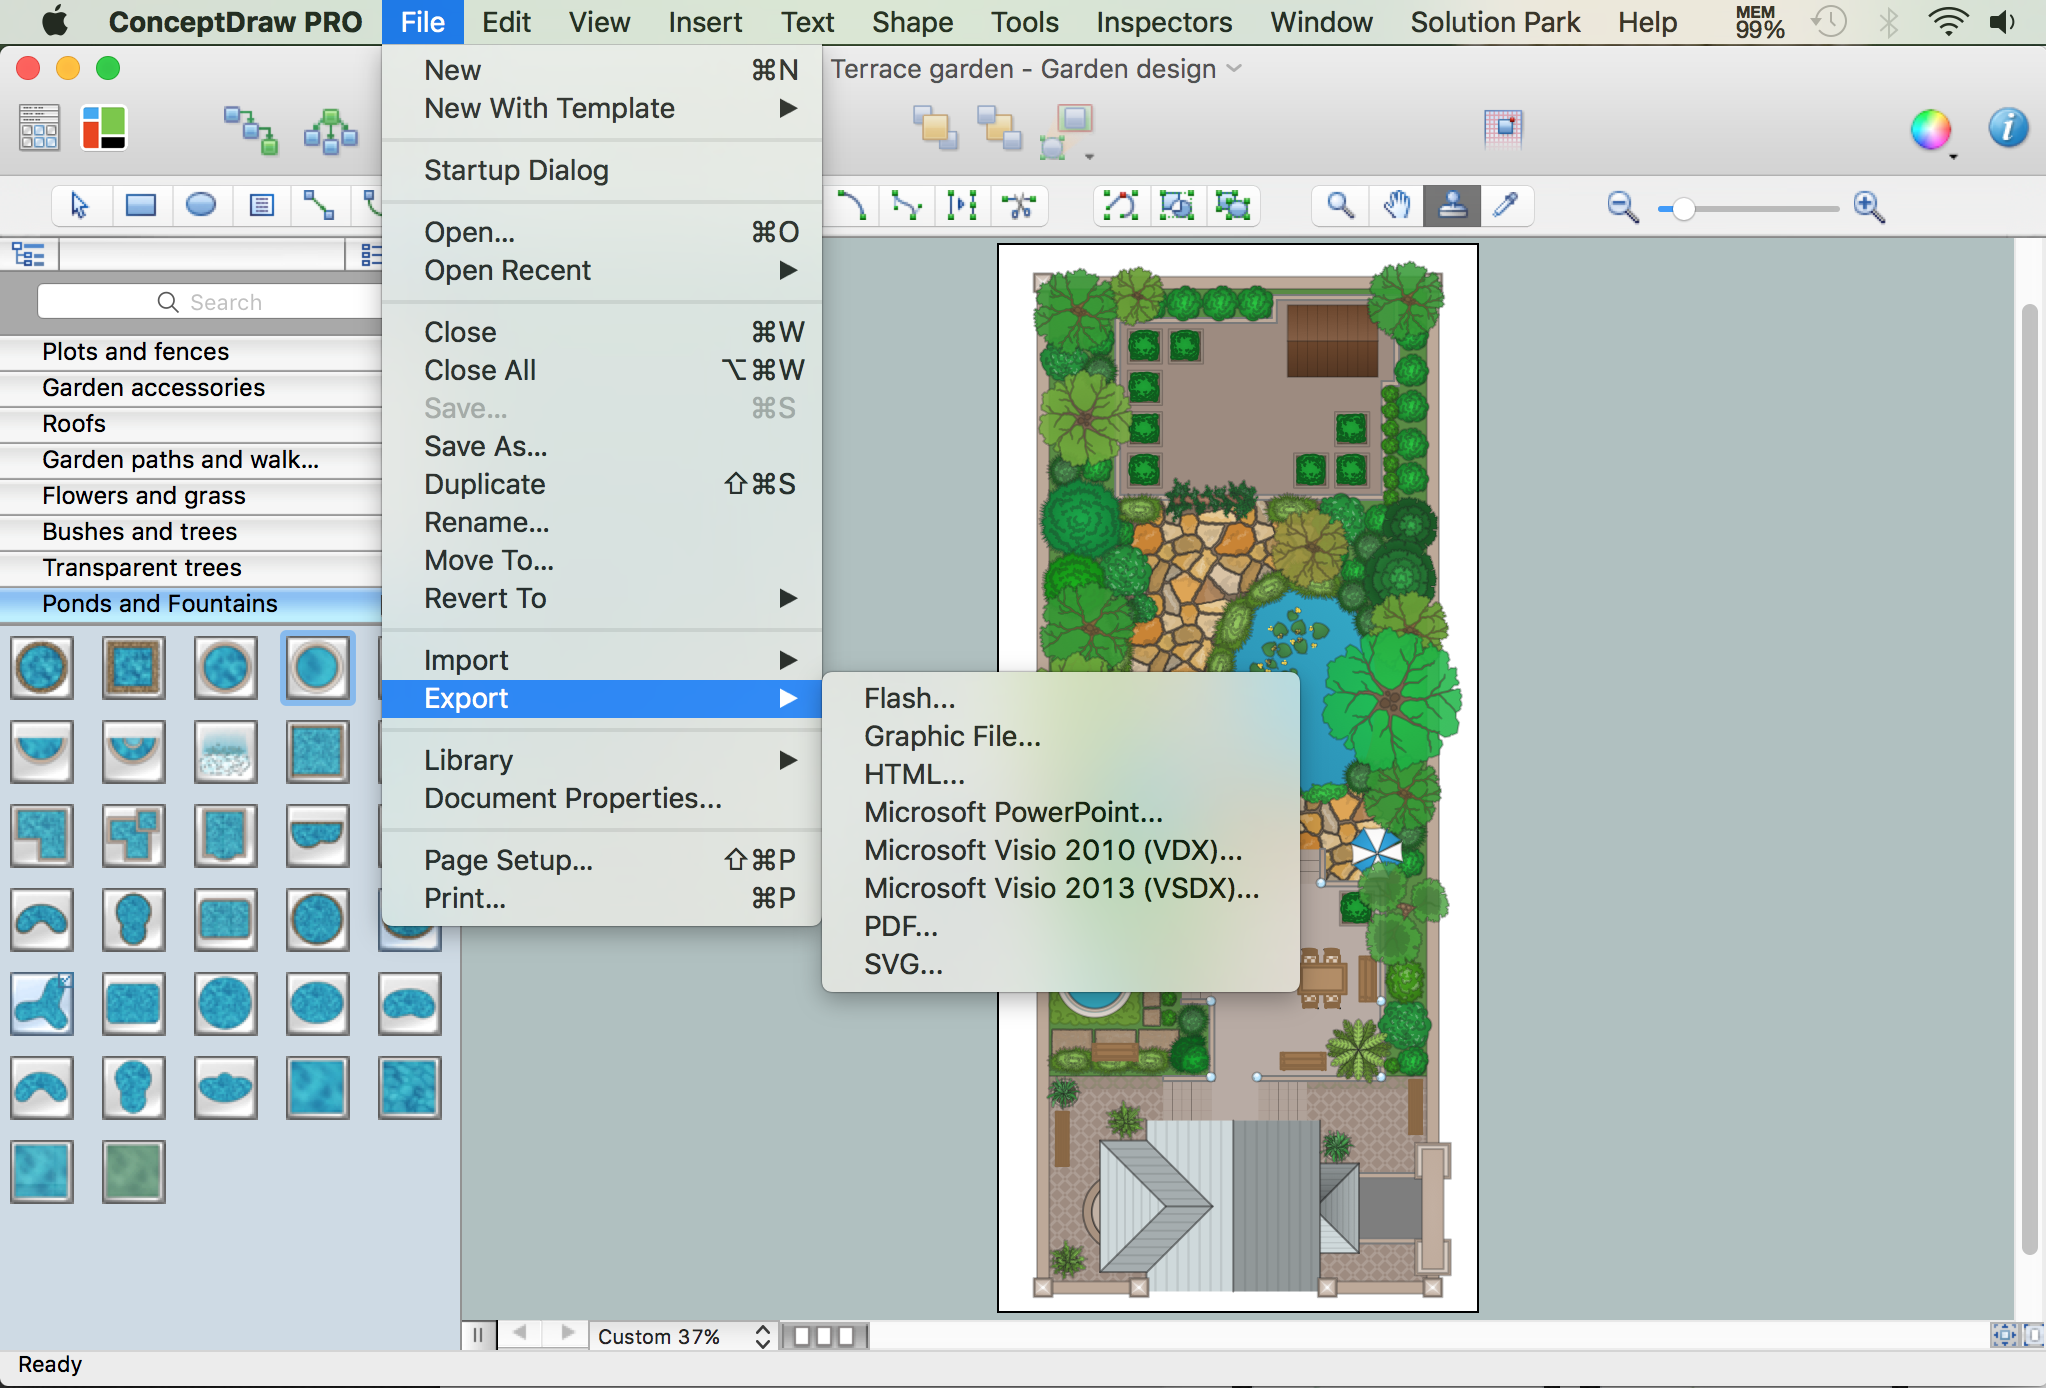
Picture: How to Draw a Landscape Design Plan
Related Solution: