Road Transport - Design Elements
Road transport - Design elements libraryThe vector stencils library Road transport contains clipart of cars, automobiles, buses, coaches, vans, pickups, trucks, cycles for ConceptDraw DIAGRAM diagramming and vector drawing software. Use it to draw illustrations of vehicles and transportation of passengers or goods on roads. This design elements library is included in Aerospace and Transport solution from Illustration area of ConceptDraw Solution Park. The Road transport library contains 43 vehicle images:
|
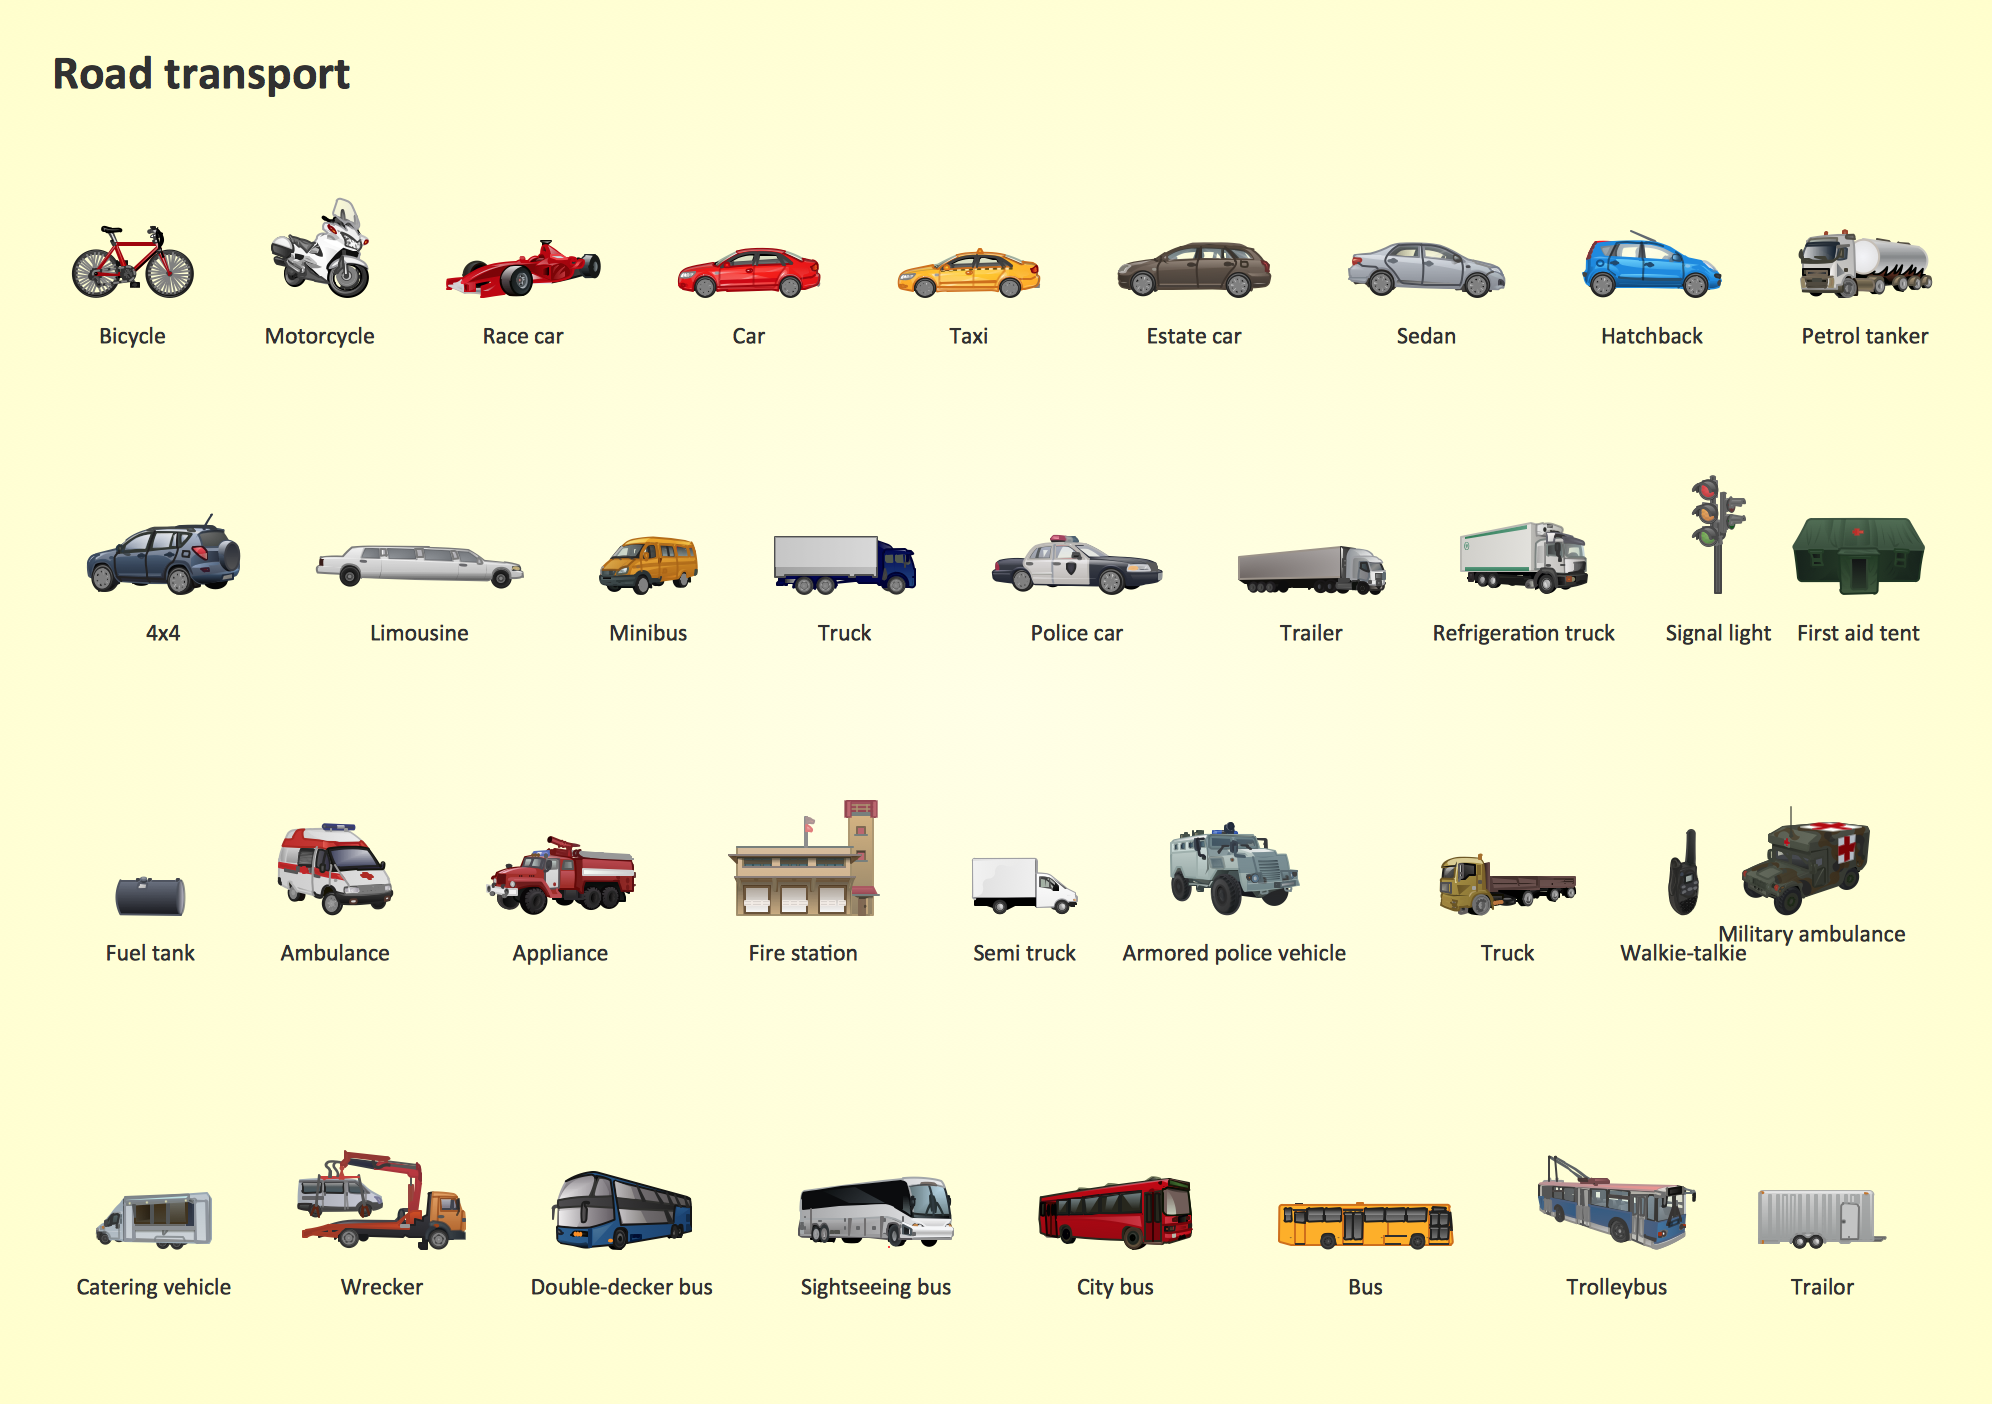
Pic.1 Road Transport - Design Elements
See also Samples:
- Illustration - Aerospace and Transport
- Illustration - Artwork
- Illustration - Audio, video, media
- Illustration - Business and finance
- Illustration - Computers and communications
- Illustration - Manufacturing
- Illustration - Nature
- Illustration - People
- Illustration - Presentation clipart
- Illustration - Safety and security
- Science & Education — illustrations
NINE RELATED HOW TO's:
A competent delegation of responsibilities between workers guarantees business success in most cases. At first sight, it might seem that workflow diagram symbols are quite similar to a regular flowchart. But workflow diagram is a more accurate way to present working processes.
Workflow diagrams are helpful for a working process analyzation, to depict a pathway of process issues, personalize responsibilities and identify resources that will help to optimize a workflow. Generally, Workflow diagram deploys flowchart symbols for displaying work process steps and relationships. But, often it require some additions and improvements to become more professional and illustrative. The Workflow solution for ConceptDraw DIAGRAM provides the user with a big library of symbols that are designed especially for workflow diagrams.
Picture: Workflow Diagram Symbols
Related Solution:
Electrical Engineering Solution used together with ConceptDraw DIAGRAM drawing facilities makes short a work of drawing various electrical and electronic circuit schemes. A library of vector objects composed from symbols of Analog and Digital Logic elements of electric circuit includes 40 symbolic images of logic gates, bistable switches of bi-stable electric current, circuit controllers, amplifiers, regulators, generators, etc. All of them can be applied in electronic circuit schemes for showing both analog and digital elements of the circuit.
Electrical Engineering Solution used together with ConceptDraw DIAGRAM drawing facilities makes short a work of drawing various electrical and electronic circuit schemes. A library of vector objects composed from symbols of Analog and Digital Logic elements of electric circuit includes 40 symbolic images of logic gates, bistable switches of bi-stable electric current, circuit controllers, amplifiers, regulators, generators, etc. All of them can be applied in electronic circuit schemes for showing both analog and digital elements of the circuit.
Picture:
Electrical Diagram Symbols F.A.Q.
How to Use Electrical ConceptDraw Diagram Software
Related Solution:
ConceptDraw will help you to create the room planning of any configuration quickly and skillfully. ConceptDraw contains a number of ready templates for creation of premises plans, and due to libraries with interior objects existing in the program you will be able to place furniture, denote the location of doors and windows and indicate dimensions.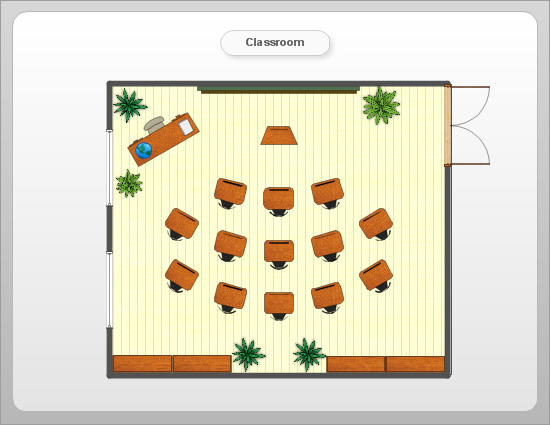
Picture: Room planning with ConceptDraw DIAGRAM
Related Solution:
The solution handles designs of any complexity, and the comprehensive library covers all key aspects of a transportation system. To further enhance your map design, there is the option to embed links, that can display station images or other relevant, important information. We have also included a set of samples in the solution, that show the possible real-world application — complex tube systems including the London Tube and New York City Subway show the level of detail possible when using the Metro Map Solution.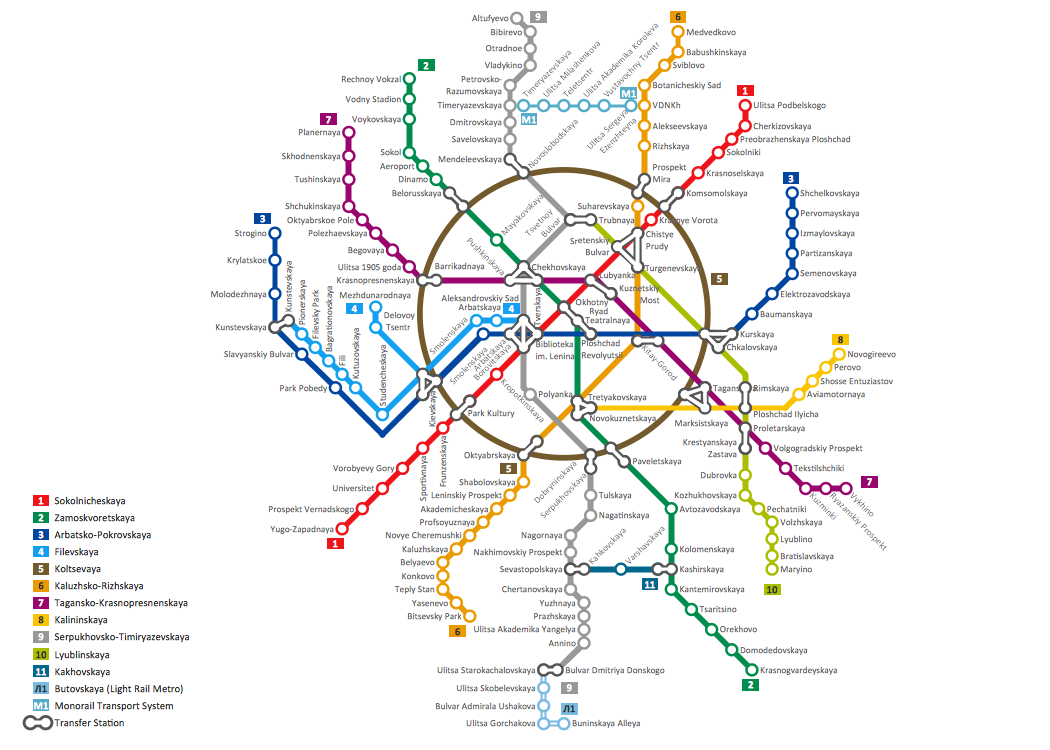
Picture: How to Draw Metro Map style infographics? Moscow, New York, Los Angeles, London
Related Solution:
Develop of landscape drawing is a complex process which requires great efforts and inspiration. ConceptDraw DIAGRAM is a powerful diagramming and vector drawing software. Extended with Site Plans Solution from the Building Plans Area, ConceptDraw DIAGRAM will help to make this process easier.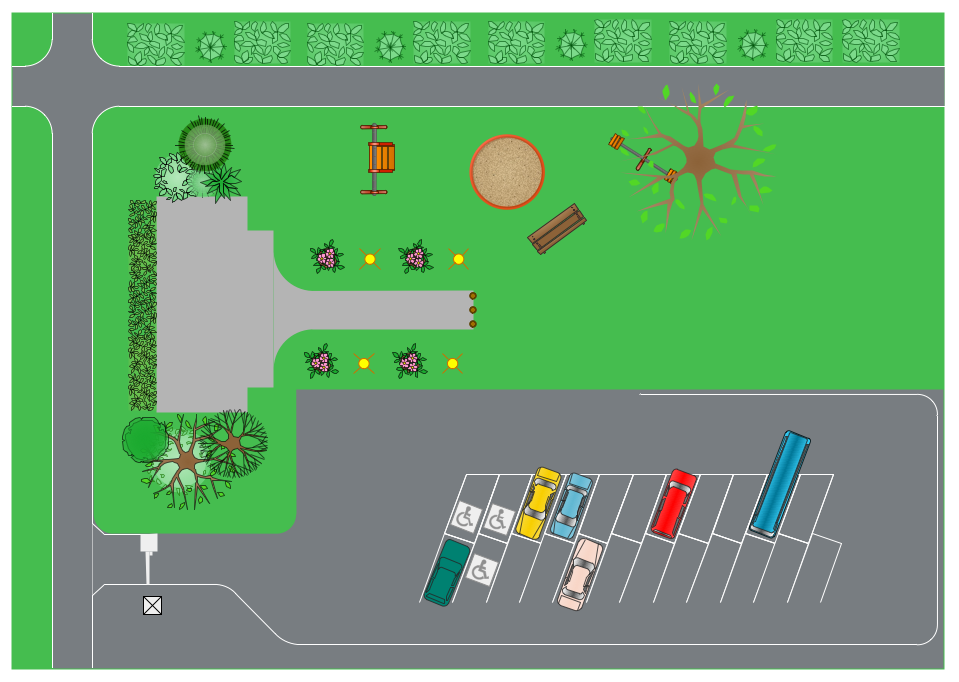
Picture: Landscape Drawing
Related Solution:
Wireless network topology — logical topology.
Wireless network topology shows how the computers connect each other when there is no physical connection. The computers communicate each using the wireless devices.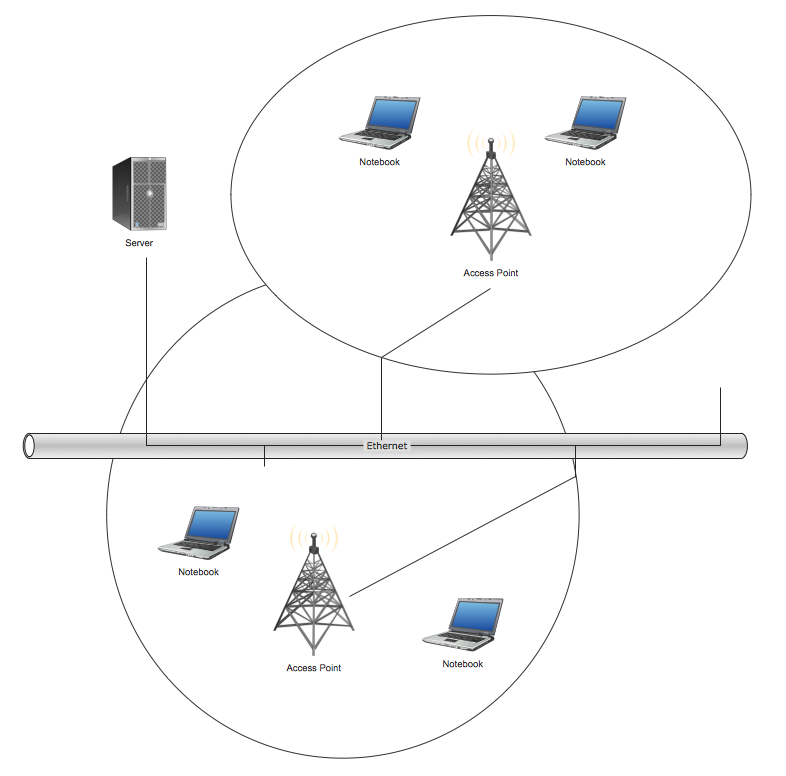
Picture: Wireless Network Topology
Related Solution:
Nature solution expands our software possibilities to create beautiful illustrations and cliparts with the new library which contains 17 vector objects.
Picture: Beauty in nature Illustrations and Clipart
Talking about companies, that have influenced the entire industry, we should mention Cisco and it’s influence on network design. Nowadays, this equipment has became a kind of standard, and Cisco icons, shapes, stencils, symbols and design elements are easily recognized among others. You can use these icons to develop a network diagram of any complexity.
When dealing with creating a pack of network documentation, system administrator often have to depict a network containing a network equipment of such a well-known manufacturer as Cisco. As Cisco has developed its own production standard icons that are strongly recommended to use in Cisco network diagrams. The best way to draw Cisco Network diagram Cisco certified icons is using ConceptDraw solution for Cisco Network Diagrams. Using Cisco symbols library provided by this solution allows system administrator, or network architect to design a prototype of a new network or document an existing one.
Picture: Cisco Network Design. Cisco icons, shapes, stencils, symbols and design elements
Related Solution:
This sample was created in ConceptDraw DIAGRAM diagramming and vector drawing software using the UML Class Diagram library of the Rapid UML Solution from the Software Development area of ConceptDraw Solution Park.
This sample describes the use of the classes, the generalization associations between them, the multiplicity of associations and constraints. Provided UML diagram is one of the examples set that are part of Rapid UML solution.
Picture: UML Class Diagram Generalization ExampleUML Diagrams
Related Solution:
ConceptDraw
DIAGRAM 18