IDEF
An abbreviation of ICAM Definition is IDEF that was renamed as Integration DEFinition in 1999 being referred to a family of the modeling languages in the field of both software and systems engineering. Covering a lot of uses, from functional modeling to simulation, object-oriented analysis/design, knowledge acquisition and data, such "definition languages" are still most commonly used, especially by the U.S. Air Force as they were developed under the funding from them. It is also widely used by the other military as well as the United States Department of Defense agencies that are in the public domain.
The most used as well as widely recognized components of the IDEF family are IDEF0 and IDEF1X. The last one addresses the database design and the information models issues and IDEF0 is a functional modeling language that is building on SADT.
IDEF is known to be referred to a family of the modeling language, covering a wide range of uses and the IDEF methods have been defined from IDEF0 up to IDEF14 having IDEF0 used for some function modeling, IDEF1 used for the information modeling, IDEF1X used for data modeling, IDEF2 used for simulation the models designing, IDEF3 used for capturing the process description, IDEF4 used for making the object-oriented design, IDEF5 used for capturing the ontology description, IDEF6 used for designing rationale capture, IDEF7 used for auditing the information systems, IDEF8 used for the user’s interface modeling, IDEF9 used for discovering the business constraints, IDEF10 used for implementing the architecture modeling, IDEF11 used for modeling the information artifacts, IDEF12 used for organization modelling, IDEF13 used for making the three schema of the mapping design and IDEF14 used for designing the networks.
The previously mentioned IDEF1X, IDEF2, IDEF0, IDEF3 and IDEF4 had been developed in full only in 1995. Some of the other IDEF concepts had only the preliminary design. The methods such as IDEF10, IDEF7, IDEF11, IDEF13 and IDEF 12 have not been developed any further than their original definition. Originally, IDEF stood for ICAM definition that was initiated in the 1970s at the Wright-Patterson Air Force Base and the US Air Force Materials Laboratory by Dan L. Shunk, Dennis E. Wisnosky, and others, being completed in the 1980s. IDEF was originally a product of the so-called ICAM’s (Integrated Computer-Aided Manufacturing) initiative of the United States Air Force.
Making IDEF diagrams is never a problem as long as you have the IDEF Business Process Diagrams solution from the ConceptDraw STORE application that is another unique product of CS Odessa that was developed especially for simplifying the ConceptDraw DIAGRAM users’ work with the similar drawings.

Example 2. IDEF Solution in ConceptDraw STORE
Offering 4 stencil libraries with 53 design object, IDEF Business Process Diagrams solution may be very useful in terms of using the already previously created templates of the IDEF diagrams, such as the “Architecture Framework– IDEF0 Activity Diagram” as the base for creating the new great looking as well as smart looking and unique drawings.
IDEF1 was developed by Dr .Robert R. Brown of the Hughes Aircraft Company under the so-called ICAM program priority 1102. Dr. Brown was previously responsible for the development of the IMS while working at the Rockwell International that chose not to pursue IMS as a marketable product but an IBM one. The reason for that was the fact that it had been served as a support contractor during its development, taking over the other products and being successful in all further developments on the market.
It appeared that by using the IDEF1 the translation of all the information requirements into the database designs was more difficult than it had been anticipated originally. The most of the most beneficial values of the IDEF1 information modeling technique was its ability to manage the process of representing any data independently going into details of how those data were to be used and stored.
Providing data modelers as well as the data analysts with an ability to represent the needed data requirements during the requirements-gathering process, IDEF1 allowed designers to decide which DBMS to use. But it could be done only after the nature of the data requirements was understood and so the so-called "misfit" between such data requirements and the capabilities as well as the limitations of the DBMS reduced.
The translation of all the IDEF1 models to database designs proved to be quite difficult but nevertheless it is still popular as well as widely used so in case there is any need to create an IDEF1 diagram, it is always possible to do it in ConceptDraw DIAGRAM by using the already previously created template of such diagram from the IDEF Business Process Diagrams solution from the ConceptDraw STORE application.
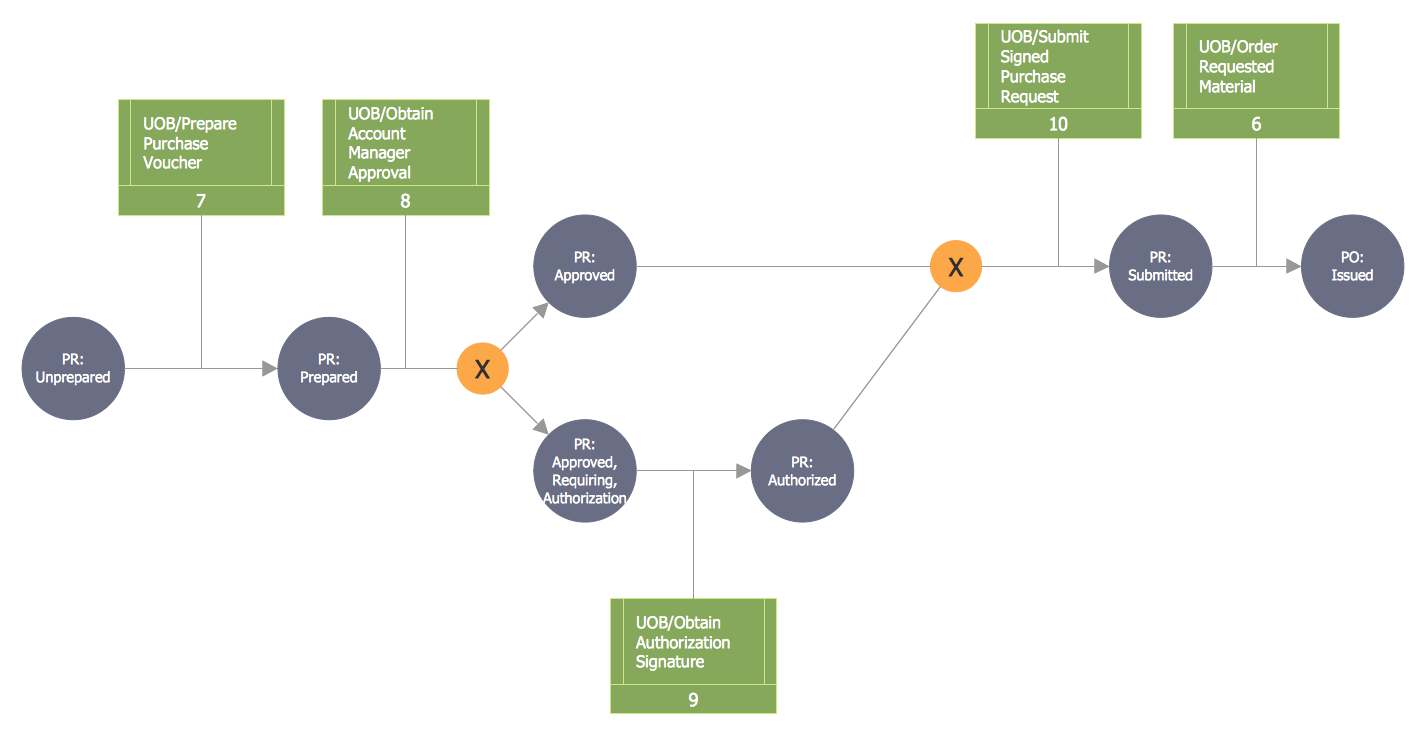
Example 2. IDEF Business Process Diagram - Transition Schematic
IDEF Business Process Diagrams Solution offers you wide possibilities for fast and easy design business process diagrams, IDEF diagrams, for creation function models of any complexity. All this is possible thanks to extensive drawing tools, vector objects libraries and samples which IDEF Business Process Diagrams Solution offers at your disposal.

Example 3. IDEF0 Diagram - Tunneled Arrows
IDEF Business Process Diagrams Solution includes variety of samples of most-widely used types of IDEF diagrams as IDEF0 and IDEF3. All they are available from ConceptDraw STORE. Each of them can be used as is or as the base for your own IDEF diagram.

Example 4. IDEF3 Process Schematic
The samples of IDEF diagrams you see on this page were created in ConceptDraw DIAGRAM software using the IDEF Business Process Diagrams Solution for ConceptDraw DIAGRAM They successfully demonstrate solution's capabilities and professional results you can achieve. An experienced user spent 10-15 minutes creating every of them.
Use the IDEF Business Process Diagrams Solution for ConceptDraw DIAGRAM software to design your own professional looking IDEF diagrams of any complexity quick, easy and effective.
All source documents are vector graphic documents. They are available for reviewing, modifying, or converting to a variety of formats (PDF file, MS PowerPoint, MS Visio, and many other graphic formats) from the ConceptDraw STORE. The IDEF Business Process Diagrams Solution is available for all ConceptDraw DIAGRAM users.
NINE RELATED HOW TO's:
Functional modeling allows to make complex business processes simple. One of the basic methods is IDEF0 and one of the most effective also. To create a business model, use flowchart symbols.
The IDEF0 library, supplied with ConceptDraw IDEF0 Diagrams solution contains 18 IDEF0 basic notation symbols. All symbols are the vector graphic images what means, that one can customize their size preserving the stable quality. Another library of IDEF0 symbols can be find out in the the Business Process Diagrams solution, included to the Business Processes section of ConceptDraw Solution Park. These libraries composed from just vector objects and are totally compatible. You can apply the IDEF0 symbols from both libraries at your flowcharts, if needed.
Picture: IDEF0 Flowchart Symbols
Related Solution:
A requisition form is one of the documents used for accounting in different manufacturing processes. There are two main types of requisition: a purchasing requisition and material requisition and difference between them is significant. Creating a flowchart might help you in understanding all the details of accounting process.
Flowcharts are a best visual method for dividing a large and complicated procedure into a several little clear pieces. The main value-ability of an effective flowchart is its simpleness. Material requisition flowcharts are used to document the process of relationships between the different departments and the purchasing department within an organization. The flow chart gives the step-by-step guide on how is carried out the procurement process of the materials necessary for the functioning of the organization. This type of flowchart along with many other business flowcharts, one can easy create using ConceptDraw Flowcharts solution.
Picture: Material Requisition Flowchart. Flowchart Examples
Related Solution:
IDEF Business Process Diagrams solution from the Business Processes area of ConceptDraw Solution Park extends ConceptDraw DIAGRAM vector graphics and diagramming software with the ability of fast and easy drawing various types of IDEF diagrams.Picture: IDEF
Related Solution:
Use Case Diagrams technology. IDEF3 Standard is intended for description and further analysis of technological processes of an enterprise. Using IDEF3 standard it is possible to examine and model scenarios of technological processes.
Picture: IDEF3 Standard
The most easier way of creating the visually engaging and informative Sales Process Flowchart is to create the new ConceptDraw document and to use the predesigned vector symbols offered in 6 libraries of the Sales Flowchart Solution. There are more than six types of sales process flow diagrams, ConceptDraw DIAGRAM software is flowchart maker which include six collections of extended flowchart symbols for effective diagramming. There are main collections of color coded flowchart symbols: Sales Department, Sales Steps, Sales Workflow, Sales Symbols and special set of Sales Arrows and Sales Flowchart.
Picture: Sales Process Flowchart Symbols
Related Solution:
ConceptDraw DIAGRAM extended with IDEF0 Diagrams solution from the Software Development area of ConceptDraw Solution Park is a powerful diagramming and vector drawing IDEF0 software. All IDEF0 diagrams created in ConceptDraw DIAGRAM are vector graphic documents and can be reviewed, modified and converted to MS Visio XML format. To obtain the IDEF0 Visio documents from ConceptDraw DIAGRAM documents use the wide export possibilities of ConceptDraw DIAGRAM.
Picture: IDEF0 Visio
Related Solution:
A flowchart is a simple but very functional tool when it comes to understanding a workflow or to removing unnecessary stages from a process. When drawing flowcharts, keep in mind that there are four common types of flowcharts, like document flowcharts and data flowcharts that show control over a data or document flow over a system. To show controls on a physical level, use system flowcharts. In addition, to show controls in a program, you can draw a program flowchart.
This flowchart diagram represents the piece of an article editing process, that involves the author and editor. It was created using the Basic Flowchart notation that consists from the basic flowchart symbols. The start and the end of the process are indicated with "Terminator" symbols. The "Process" symbols show the action steps consisting from making edits and searching for a compromise, when the author does not agree with the suggestions of the editor. The "Process" symbol is the general symbol in process flowcharts. The "Decision" symbol indicates a branching in the process flow. There are two branches indicated by a Decision shape in the current flowchart (Yes/No, Disagree/Agree). This basic flowchart can be used as a repeating unit in the workflow diagram describing the working process of some editorial office.
Picture: Types of Flowcharts
Related Solution:
While creating flowcharts and process flow diagrams, you should use special objects to define different statements, so anyone aware of flowcharts can get your scheme right. There is a short and an extended list of basic flowchart symbols and their meaning. Basic flowchart symbols include terminator objects, rectangles for describing steps of a process, diamonds representing appearing conditions and questions and parallelograms to show incoming data.
This diagram gives a general review of the standard symbols that are used when creating flowcharts and process flow diagrams. The practice of using a set of standard flowchart symbols was admitted in order to make flowcharts and other process flow diagrams created by any person properly understandable by other people. The flowchart symbols depict different kinds of actions and phases in a process. The sequence of the actions, and the relationships between them are shown by special lines and arrows. There are a large number of flowchart symbols. Which of them can be used in the particular diagram depends on its type. For instance, some symbols used in data flow diagrams usually are not used in the process flowcharts. Business process system use exactly these flowchart symbols.
Picture: Flowchart Symbols: Meaning and Examples
Related Solution:
Local area network connects computers and other network appliances within an area, such as office building or a campus. It can be difficult to provide such network without a predesigned plan. For these purposes you can use network diagram software, which helps you to create LAN network diagrams and office network diagrams quickly and effortless. This will speed up your work and you can save the diagram for the future network improvements.
The following diagram illustrates a network topology of the small office. LAN configuration has a star topology. The local network joins 8 computers among which are several desktop PCs, laptop, two iMacs and iBook. The end-point devices are divided into three groups. Each group is connected to its hub. There is a network printer and a modem, which are interconnected with other devices through a network server. Each computer on the LAN can access the server through a corresponding hub.
Picture: Network Diagram Software. LAN Network Diagrams. Physical Office Network Diagrams
Related Solution:

