Interactive voice response (IVR) networks.
Computer and Network Examples
Interactive Voice Response (IVR) is a system of the prerecorded voice messages that allows a computer to interact with humans. IVR performs the function of the routing calls within a call center, using the information entered by the customer on the phone keypad in the touchtone mode.
The examples of the IVR systems are telephone banking, televoting, credit card services, automobile systems for hands-free, etc. IVR systems are usually used for service the high call volumes, for improvement the customer experience, reducing the costs.
ConceptDraw DIAGRAM is a powerful diagramming and vector drawing software that allows quick and easy draw the IVR network diagrams.
Computer and Networks Area provides solutions that contain the libraries with a great number of predesigned vector stencils, a set of professional looking examples that you can change for your needs.
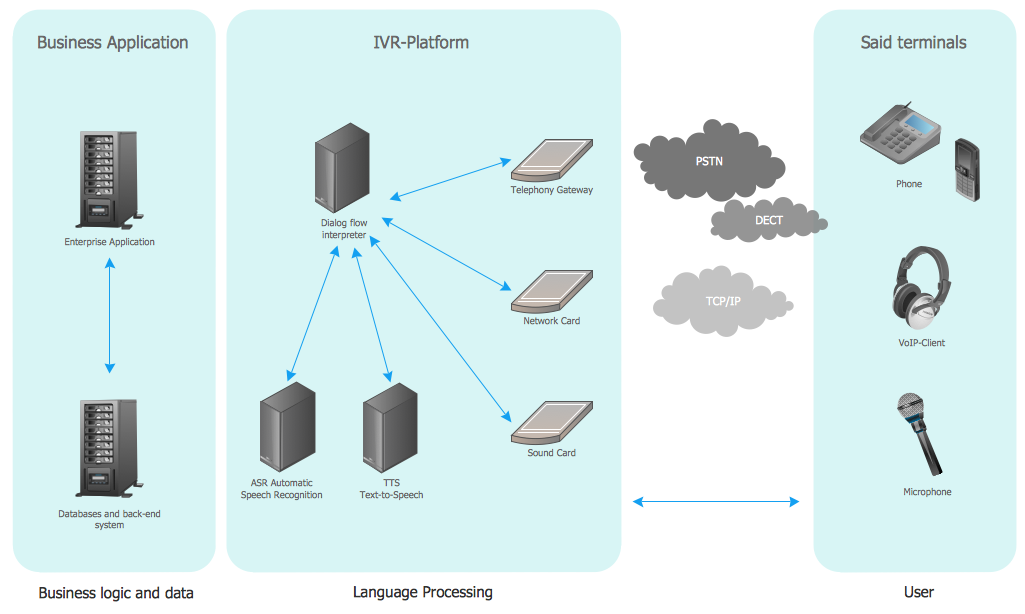
Example 1. Interactive voice response (IVR) networks
This example was created in ConceptDraw DIAGRAM using the Computer and Networks Area of ConceptDraw Solution Park and show the Interactive Voice Response (IVR) network.
All networks designed with ConceptDraw DIAGRAM are vector graphic documents and are available for reviewing, modifying, and converting to a variety of formats (image, HTML, PDF file, MS PowerPoint Presentation, Adobe Flash or MS Visio).
See also Samples:
TEN RELATED HOW TO's:
New Smart connectors in ConceptDraw DIAGRAM now have an auto-routing feature. This means that connectors always find the optimal route between objects and automatically recalculate that path when moving these objects.
You don't have to think about your connectors, they think for you.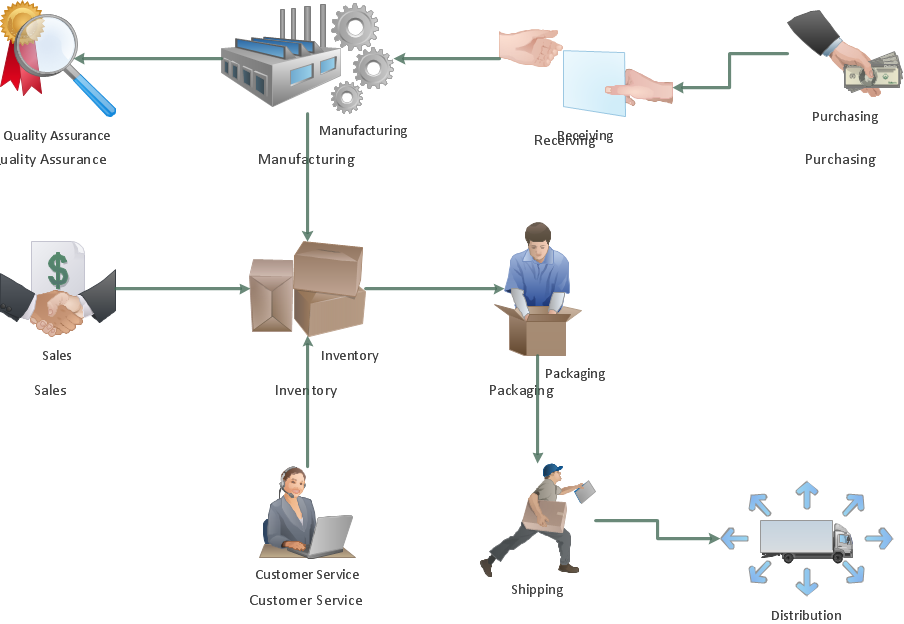
Picture: ConceptDraw Arrows10 Technology
Physical network represents the computer network topology that includes the computer devices, location and cable installation. Physical network includes the actual nodes, segments and hosts.
This example was created in ConceptDraw DIAGRAM using the Computer and Networks Area of ConceptDraw Solution Park and shows the Physical star network.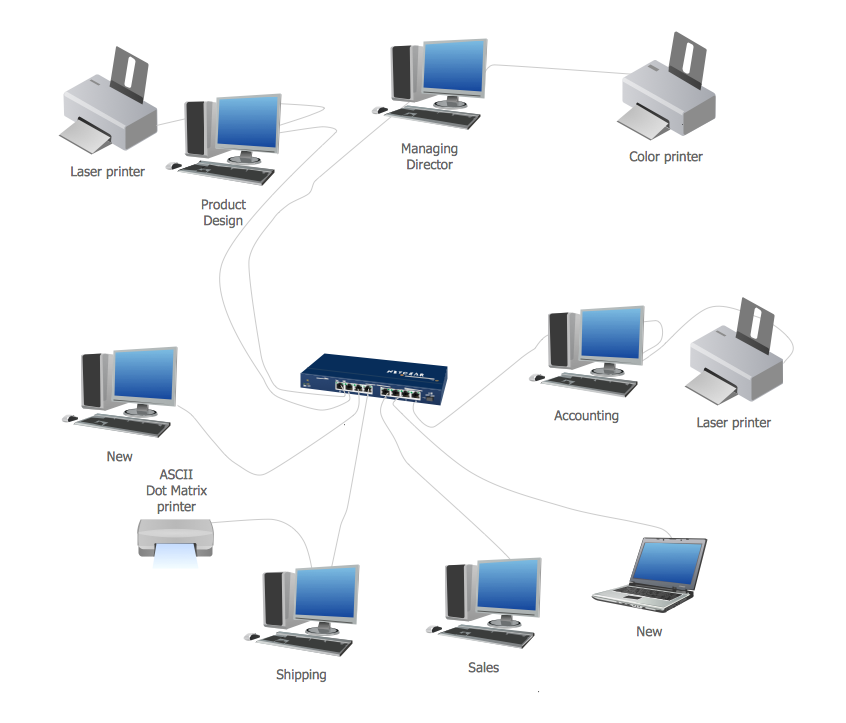
Picture: Physical network. Computer and Network Examples
Related Solution:
A Wireless network is a type of the computer network that uses the wireless connections for connecting network nodes for data transfer. The wireless networks are very useful, inexpensive, popular and widely used. They are easy setup and do not require the cables installation.
Using the solutions of the Computer and Networks Area for ConceptDraw DIAGRAM you can design the wireless network diagrams of any complexity quick and easy.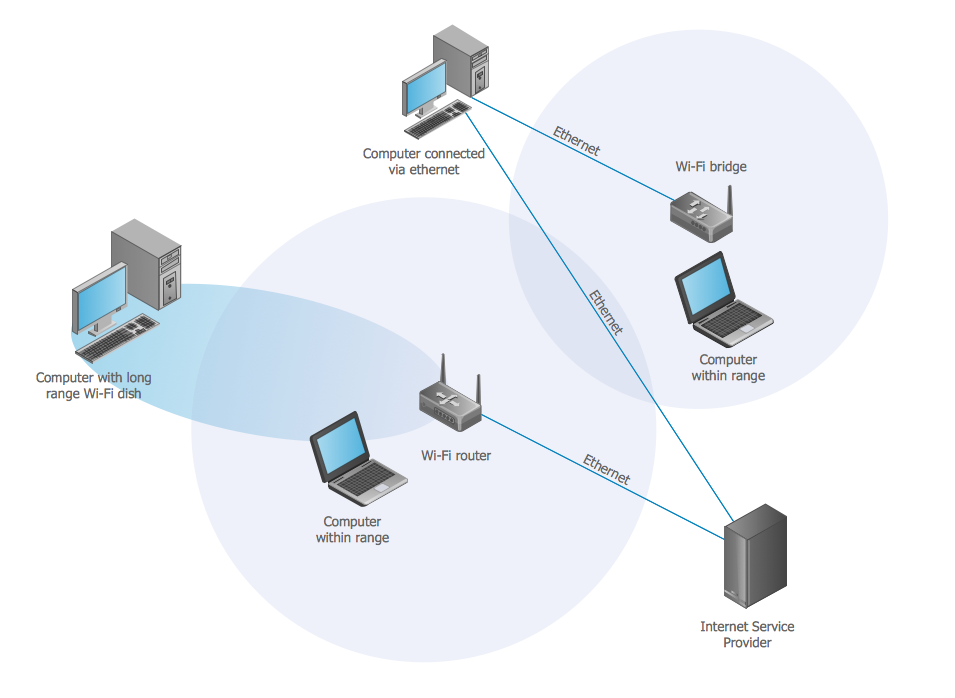
Picture: Wireless network. Computer and Network Examples
Related Solution:
UML Component Diagram illustrate how components are wired together to larger components and software systems that shows the structure of arbitrarily complex systems.
ConceptDraw Rapid UML solution delivers libraries contain pre-designed objects fit UML notation, and ready to draw professional UML Component Diagram.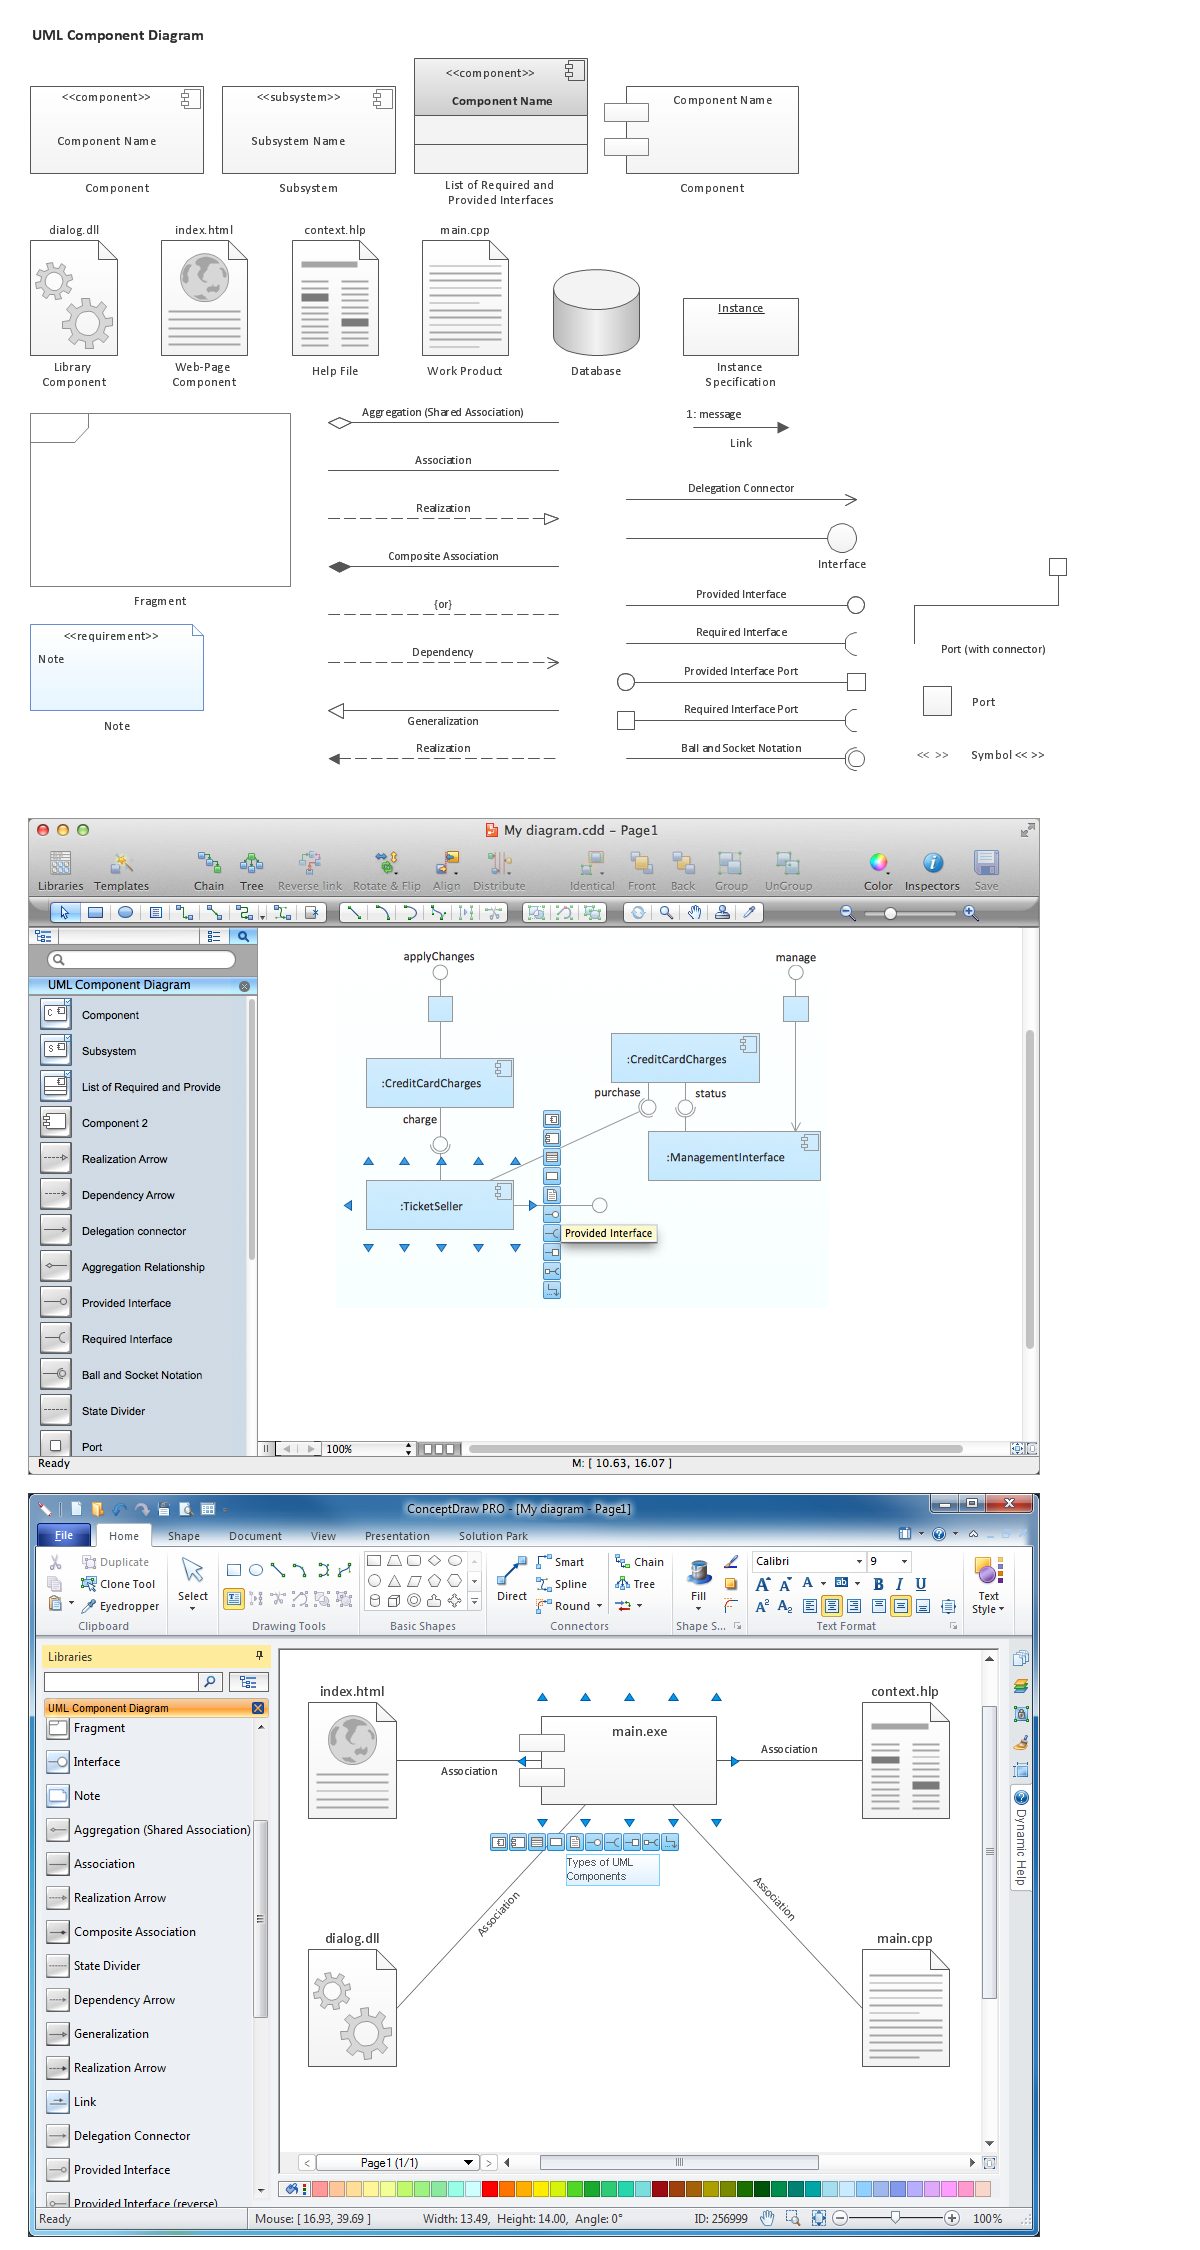
Picture: Diagramming Software for Design UML Component Diagrams
Related Solution:
A qualifying symbol is graphics or text added to the basic outline of a device’s logic symbol to describe the physical or logical characteristics of the device.
26 libraries of the Electrical Engineering Solution of ConceptDraw DIAGRAM make your electrical diagramming simple, efficient, and effective. You can simply and quickly drop the ready-to-use objects from libraries into your document to create the electrical diagram.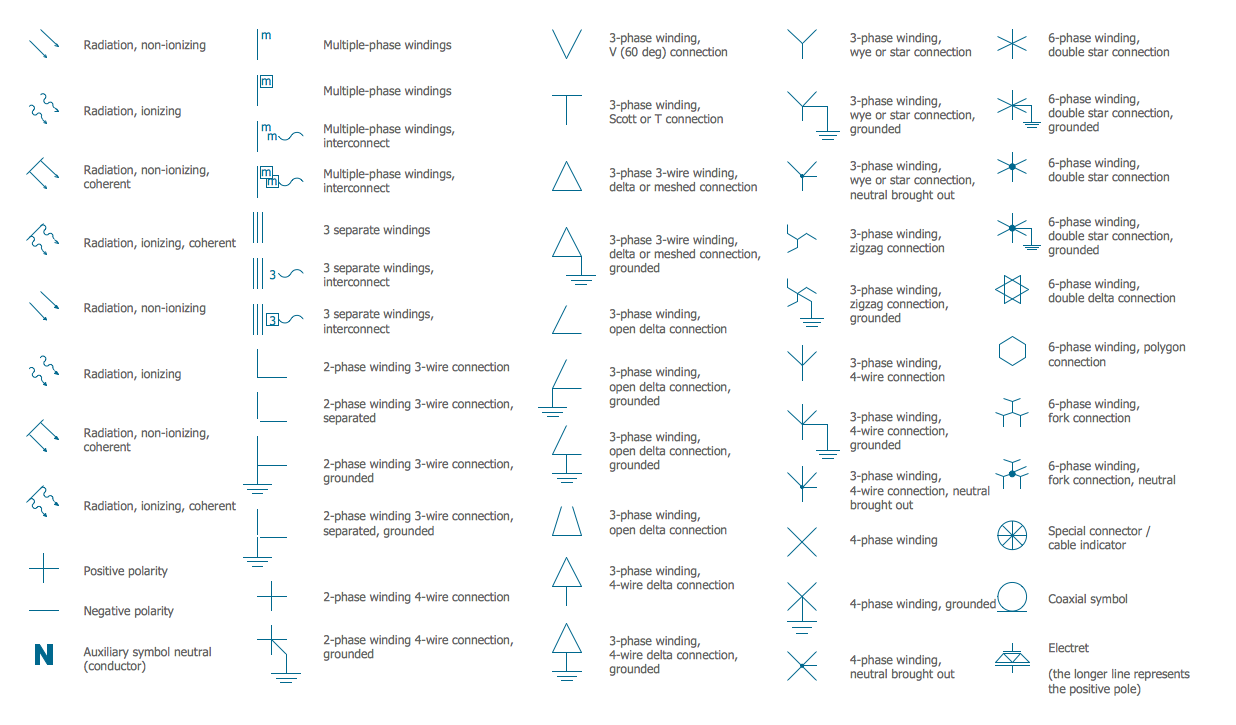
Picture: Electrical Symbols — Qualifying
Related Solution:
Templates are very useful and convenient tool for fast and easy drawing various diagrams, charts, and also flowcharts.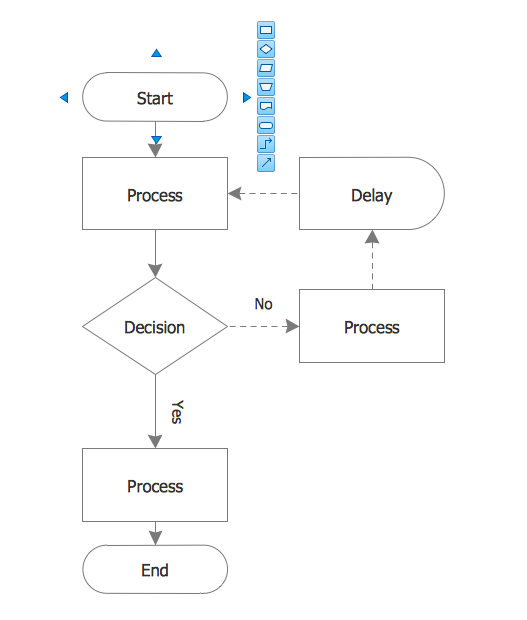
Picture: Flow Chart Template
Related Solution:
Process Flow Chart is a visual illustration of overall flow of activities in producing a product or service. How do you make a Process Flow Chart usually? Drawing process flow charts, diagrams and maps is quite complex and lengthy process, especially if you draw free-hand. But now thanks to the ConceptDraw DIAGRAM diagramming and vector drawing software extended with Flowcharts solution from the Diagrams area of ConceptDraw Solution Park this process became simple and fast. A confirmation of this can serve many Process Flow Chart examples included in Flowcharts solution.
Picture: Process Flow Chart Examples
Related Solution:
A resistor is a passive two-terminal electrical component that implements electrical resistance as a circuit element. Resistors may be used to reduce current flow, and, at the same time, may act to lower voltage levels within circuits. In electronic circuits, resistors are used to limit current flow, to adjust signal levels, bias active elements, and terminate transmission lines among other uses. Fixed resistors have resistances that only change slightly with temperature, time or operating voltage. Variable resistors can be used to adjust circuit elements (such as a volume control or a lamp dimmer), or as sensing devices for heat, light, humidity, force, or chemical activity.
26 libraries of the Electrical Engineering Solution of ConceptDraw DIAGRAM make your electrical diagramming simple, efficient, and effective. You can simply and quickly drop the ready-to-use objects from libraries into your document to create the electrical diagram.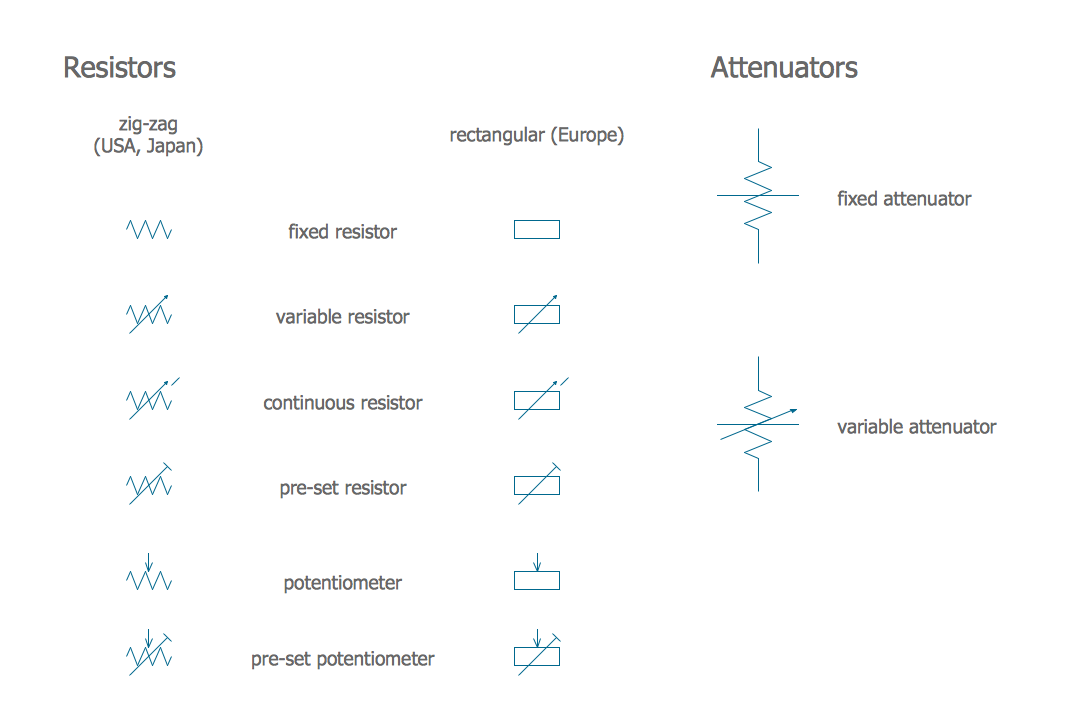
Picture: Electrical Symbols — Resistors
Related Solution:
A decoder is an electronic circuit that retrieves original data, signals, messages, or other information coded by an encoder. ConceptDraw DIAGRAM software enhanced with Digital Electronics solution includes an enormous collection of predesigned digital electrical symbols, connections, electronic logic symbols, logic gate symbols of different kinds, which suit the best for creating professional Electrical and Electronic diagrams, Electrical circuits, schematics of coders and decoders of various types.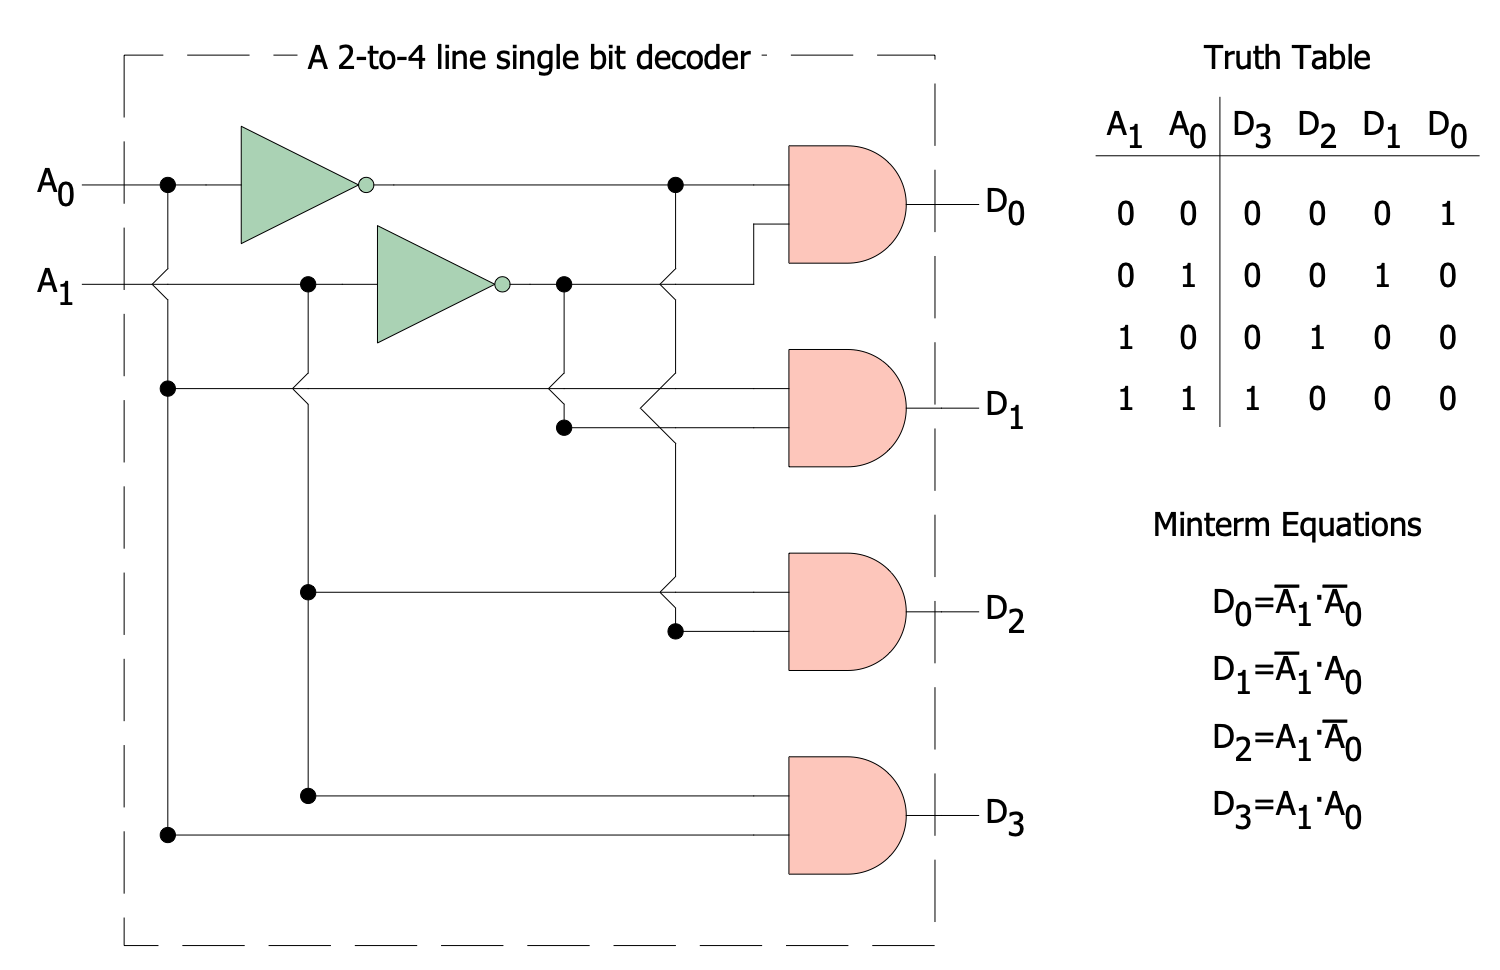
Picture: Decoder
Cisco icons are globally recognized and generally accepted as standard for network icon topologies.
ConceptDraw DIAGRAM diagramming and vector drawing software offers the Cisco Network Diagrams Solution from the Computer and Networks Area which contains the extensive drawing tools, templates and samples, and large number of libraries with variety of predesigned vector cisco icons.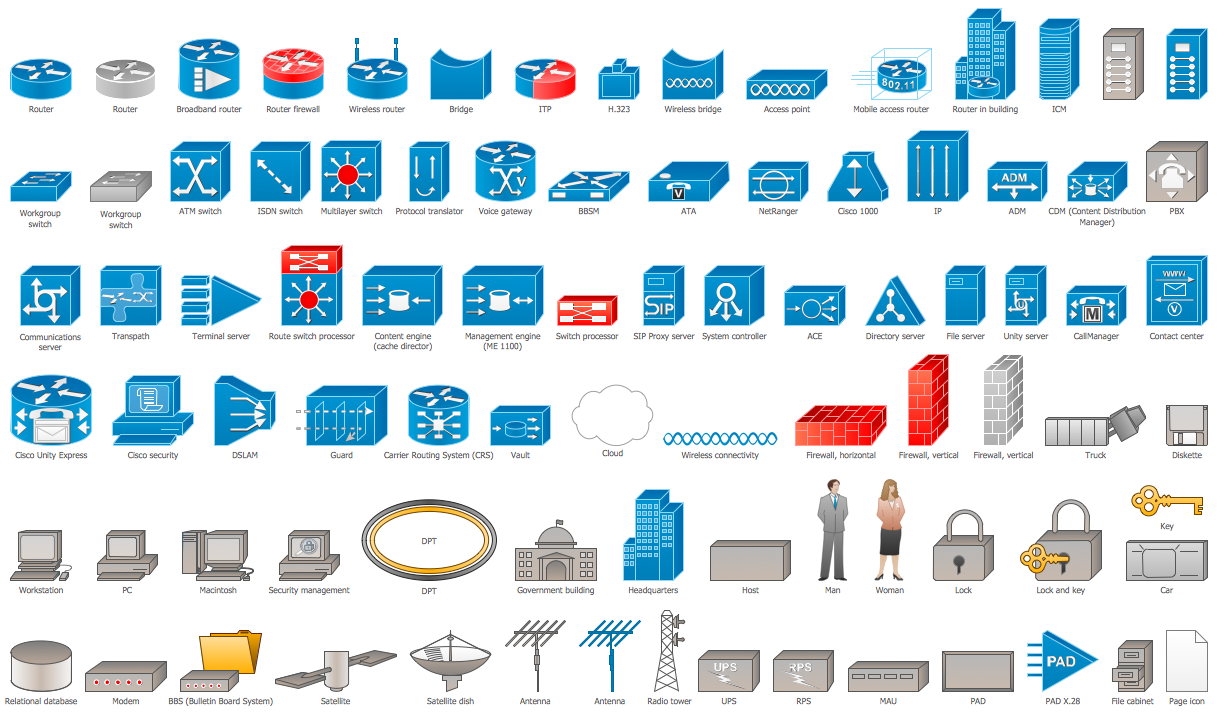
Picture: Cisco Icons
Related Solution: