Made with
ConceptDraw
DIAGRAM 18

How Cloud Computing Works

Cloud computing is a powerful modern concept which provides convenient on-demand network access to a shared pool of configurable computing resources, such as network components, servers, memory, storage, applications, additional resources and services, all of which can be rapidly deployed. The Cloud can have any of the four types of access:

  • Private Cloud,
  • Public Cloud,
  • Community Cloud,
  • Hybrid Cloud.

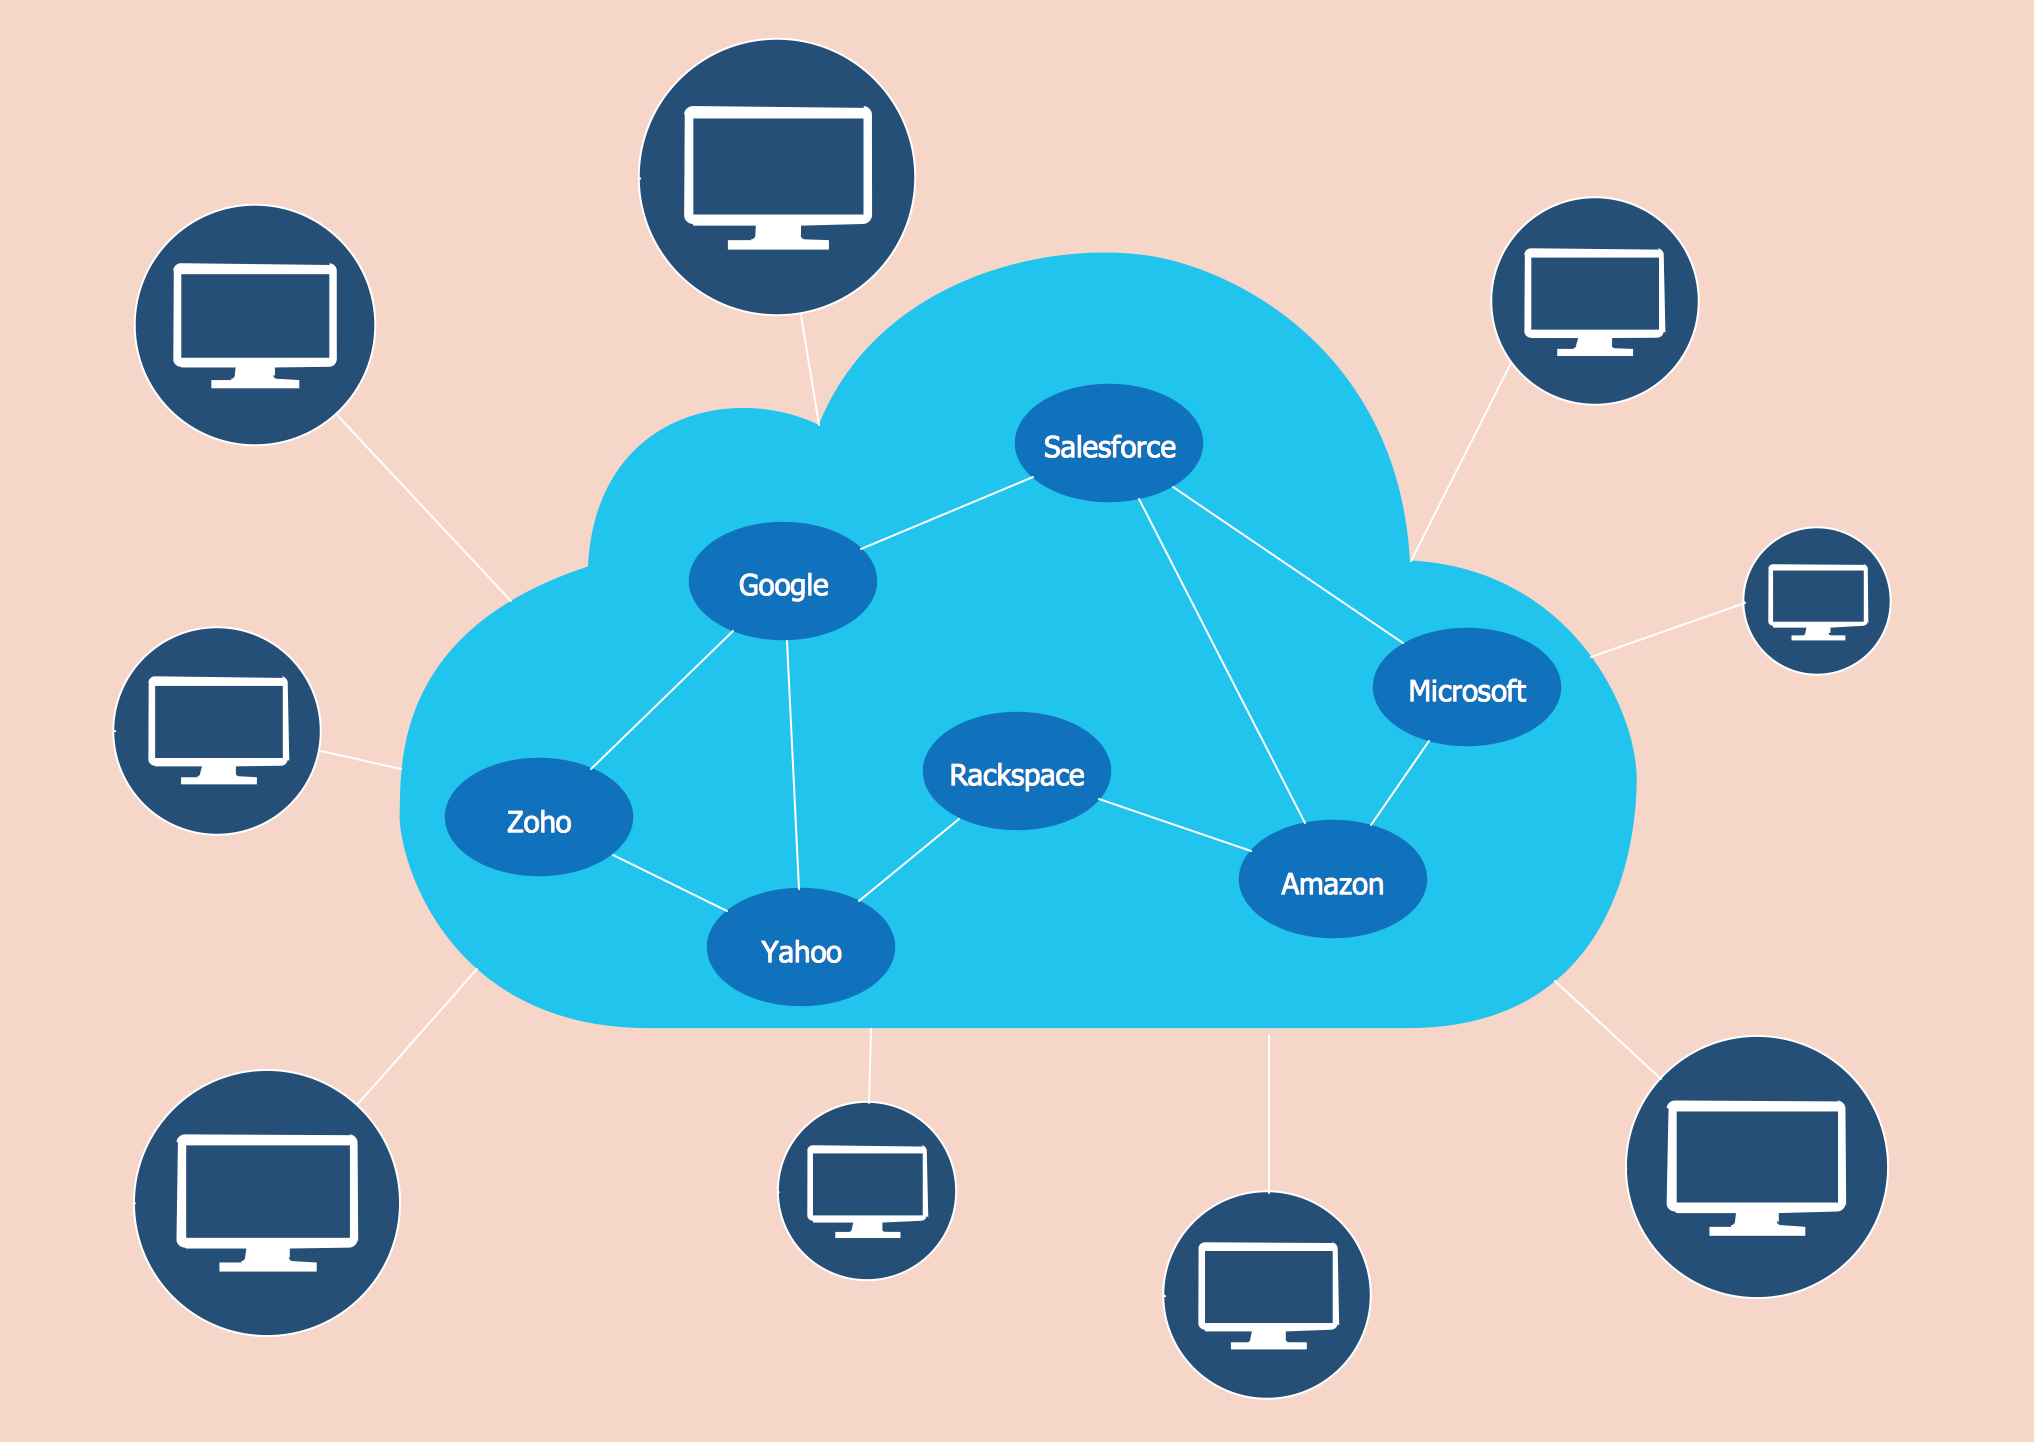
The Cloud Computing gives the companies the ability to use the computing resources which are offered by other company and stored in datacenters. It is economically advantageous for the companies, because allows to use the more reliable equipment, bigger Internet bandwidth, redundant Internet connections, automated backups and at the same time lets to save required huge investments for purchase powerful hardware. The whole amount of computing resources is divided between the companies using a virtualization method that lets dynamically create, expand and move virtual applications, virtual servers and virtual desktops. This allows the company to increase the computing resources in seconds, if required. With purpose of increasing the productivity and continuation a work in crash or failure case, the components used for cloud computing are typically distributed across many systems.

The diagrams and schemes are effective way to visualize the Cloud computing, the differences in their types and how Cloud computing works. Thanks to the ConceptDraw DIAGRAM diagramming and vector drawing software extended with Cloud Computing Diagrams solution from the Computers and Network area of ConceptDraw Solution Park, you can design diagrams as easy and quickly as you need.

How Cloud Computing Works *

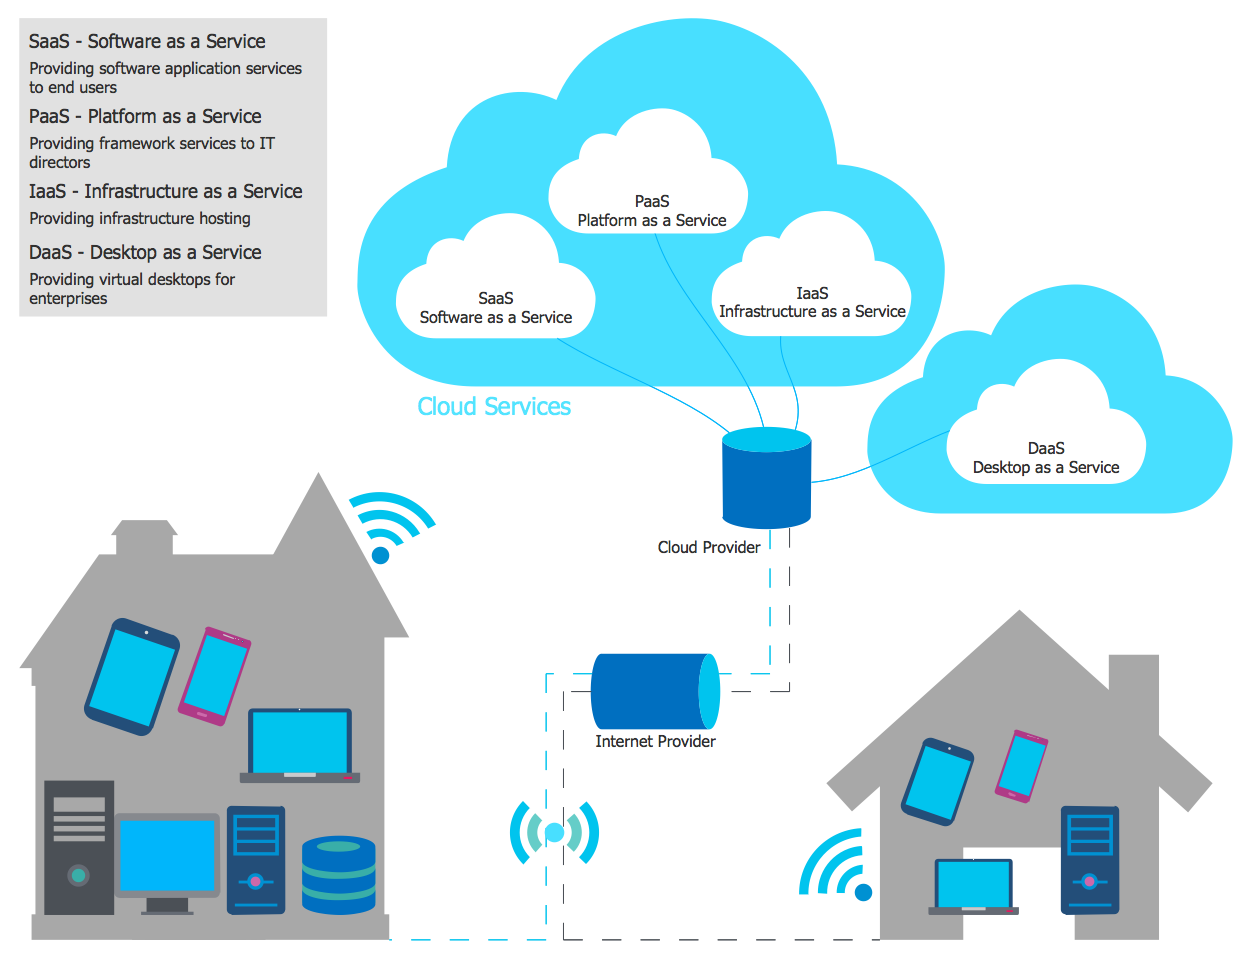
Example 1. How Cloud Computing Works

Cloud Computing Diagrams Solution offers all needed drawing tools for designing diagrams, and includes 4 libraries:

  • Cloud Clipart
  • Cloud Round Icons
  • Cloud Shapes
  • Cloud Connectors

Cloud Computing Symbols

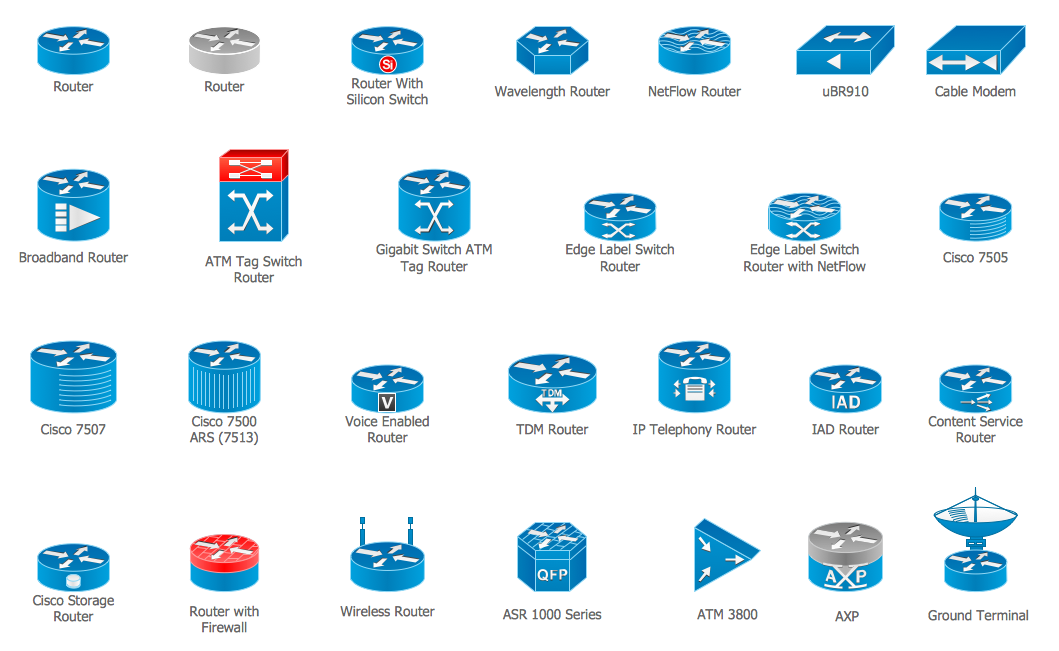
Example 2. Cloud Computing Symbols

These libraries of Cloud Computing Diagrams Solution contain 492 ready-to-use vector shapes. All they are professionally designed and universally accepted objects, icons, connectors and clipart, which will help facilitate the process of design and development of cloud computing.

Cloud Clipart Library Design Elements

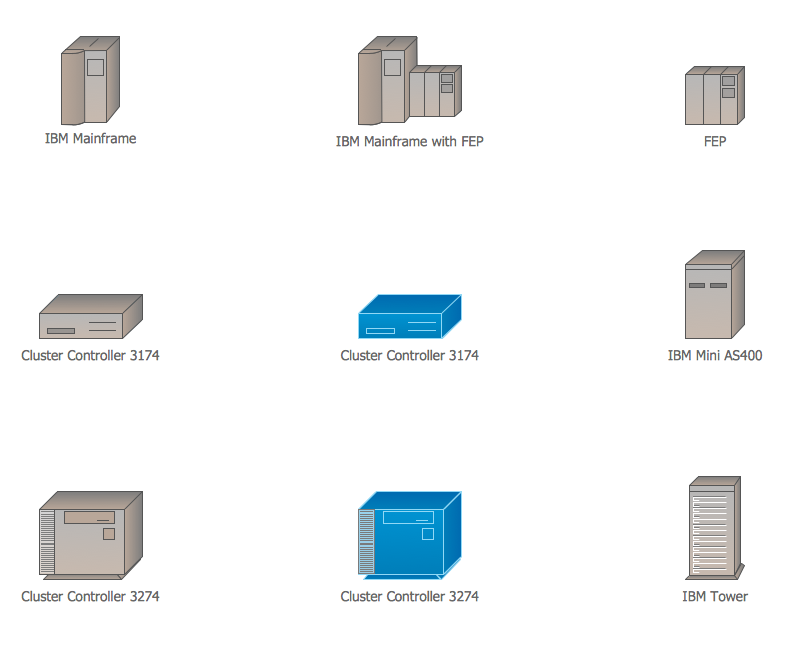
Example 3. Cloud Clipart Library Design Elements

The Cloud Computing Diagrams Solution offers also numerous collection of professionally designed samples, including those that illustrate in details how Cloud computing works. Each of them is well thought-out, professionally designed, colorful, and attractive example which can be successfully used as is or simply changed for your needs. You can find them all in ConceptDraw STORE.

Cloud Computing Stack

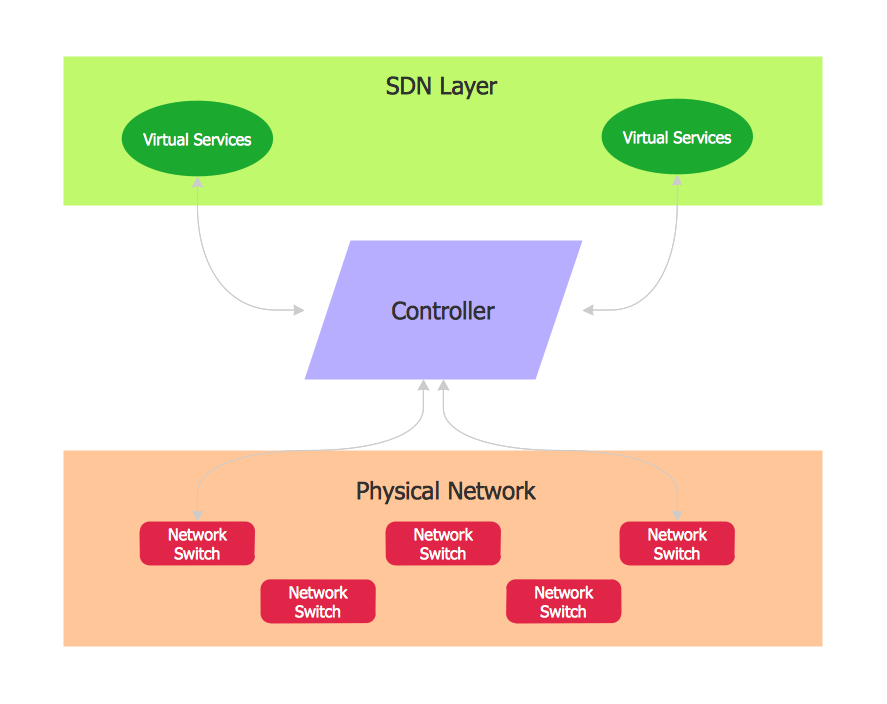
Example 4. Cloud Computing Stack

The Cloud Computing diagrams you see on this page were created in ConceptDraw DIAGRAM software using the Cloud Computing Diagrams Solution for ConceptDraw Solution Park and show how Cloud computing works. An experienced user spent 5-10 minutes creating every of these samples.

Use the tools of Cloud Computing Diagrams Solution for ConceptDraw DIAGRAM software to create your own professional looking Cloud Computing diagrams and schemes quick, easy and effective.

All source documents are vector graphic documents. They are available for reviewing, modifying, or converting to a variety of formats (PDF file, MS PowerPoint, MS Visio, and many other graphic formats) from the ConceptDraw STORE. The Cloud Computing Diagrams Solution is available for all ConceptDraw DIAGRAM users.


NINE RELATED HOW TO's:
Professional software: visualize general system architecture, AWS diagrams are part of architecturing tools provided with ConceptDraw Solution Park.Diagramming software for Amazon Web Service <br>diagrams, charts and schemes *
Picture: Diagramming software for Amazon Web Service diagrams, charts and schemes
While creating flowcharts and process flow diagrams, you should use special objects to define different statements, so anyone aware of flowcharts can get your scheme right. There is a short and an extended list of basic flowchart symbols and their meaning. Basic flowchart symbols include terminator objects, rectangles for describing steps of a process, diamonds representing appearing conditions and questions and parallelograms to show incoming data. This diagram gives a general review of the standard symbols that are used when creating flowcharts and process flow diagrams. The practice of using a set of standard flowchart symbols was admitted in order to make flowcharts and other process flow diagrams created by any person properly understandable by other people. The flowchart symbols depict different kinds of actions and phases in a process. The sequence of the actions, and the relationships between them are shown by special lines and arrows. There are a large number of flowchart symbols. Which of them can be used in the particular diagram depends on its type. For instance, some symbols used in data flow diagrams usually are not used in the process flowcharts. Business process system use exactly these flowchart symbols.Basic flowchart symbols cheat sheet: terminator, process, decision, input/output, flowline, connectors
Picture: Flowchart Symbols: Meaning and Examples
Related Solution:
ConceptDraw DIAGRAM is a world-class diagramming platform that lets you display, communicate, and present dynamically. It′s powerful enough to draw everything from basic flowcharts to complex engineering schematics. Video tutorials on ConceptDraw products. Try it today!Business  Process Mapping — How to Map a Work Process *
Picture: Business Process Mapping — How to Map a Work Process
Related Solutions:
How to draw Telecommunications Network Diagram quick, easy and effective? ConceptDraw DIAGRAM offers the unique Telecommunication Network Diagrams Solution from the Computer and Networks Area which will help you.Telecommunications Network *
Picture: Telecommunications Network
Related Solution:
One of the ways effectively visualize what is a Cloud computing or Cloud computing architecture, is to create the Sequence diagram for Cloud computing. The ConceptDraw DIAGRAM diagramming and vector drawing software enhanced with Cloud Computing Diagrams solution from the Computers and Network area of ConceptDraw Solution Park will help you design all desired types of diagrams related with cloud computing.Sequence Diagram for Cloud Computing *
Picture: Sequence Diagram for Cloud Computing
Related Solution:
If you want to find a way to understand complex things in minutes, you should try to visualize data. One of the most useful tool for this is creating a flowchart, which is a diagram representing stages of some process in sequential order. There are so many possible uses of flowcharts and you can find tons of flow charts examples and predesigned templates on the Internet. Warehouse flowchart is often used for describing workflow and business process mapping. Using your imagination, you can simplify your job or daily routine with flowcharts. Warehouse flowcharts are used to document product and information flow between sources of supply and consumers. The flowchart provides the staged guidance on how to manage each aspect of warehousing and describes such aspects as receiving of supplies; control of quality; shipment and storage and corresponding document flow. Warehouse flowchart, being actual is a good source of information. It indicates the stepwise way to complete the warehouse and inventory management process flow. Also it can be very useful for an inventory and audit procedures.Warehouse Flowchart
Picture: Flow Chart Example: Warehouse Flowchart
Related Solution:
Why do you need a business process flow diagram? How to use business process diagram software? Explore ✔️ the significance, ✔️ creation process, and ✔️ discover cutting-edge software solutions designed to streamline and optimize your workflowsBusiness Process Workflow Diagram
Picture: Business Process Workflow Diagrams & Software
Related Solution:
All computer networks differ by various params, and their size is one of them. As global area networks are the biggest, personal area (PAN) networks are the smallest. Personal computers, smartphones and other devices that have possibility to connect to Internet form a personal network. This diagram was created using ConceptDraw Computer Network Diagrams to represent a typical components of Personal area network. A personal area network (PAN) is the connection of IT devices around an individual person. This sample of personal area network involves a notebook, a personal digital assistant (PDA), and a portable printer. Commonly a PAN contains such wireless devices as mouse, keyboard, smartphone and tablet. A wireless connection is typical for a PAN.Personal area (PAN) networks
Picture: Personal area (PAN) networks. Computer and Network Examples
Related Solution:
A flowchart is a powerful tool for examining processes. It helps improving processes a lot, as it becomes much easier to communicate between involved people, to identify potential problems and to optimize workflow. There are flowcharts of different shapes, sizes and types of flowchart vary from quite basic process flowcharts to complex program flowcharts. Nevertheless, all these diagrams use the same set of special symbols like arrows to connect blocks, parallelogram to show data receiving or rectangles for showing process steps. Basic flowcharts are used to represent a simple process algorithm. A basic flowchart notation consists of rectangles (business processes), arrows (the flow of information, documents, etc.). The same notation is used in items such as the "decision", which allow you to do the branching. To indicate the start of the entire business process and its termination can be used the "Terminator" element. The advantages of Basic Flowchart are simplicity and clarity. With it you can quickly describe the business process steps. Creating of Basic Flowchart does not require any special knowledge, as easily understand by employees with different levels of education and IQ.Types of Flowchart — Overview
Picture: Types of Flowchart: Comprehensive Overview
Related Solution:
ConceptDraw
DIAGRAM 18