
Example 1. ER Diagram for Cloud Computing in ConceptDraw DIAGRAM
First of all, the Cloud Computing Diagrams Solution provides 4 libraries with a number of predesigned vector objects for cloud computing.

Example 2. Cloud Computing Symbols
All they are accurate, colorful and attractive, so it is the best choice for your diagrams! You can drag any desired of them to your diagram, combine them, join to groups to then rotate, move and resize them together as a single object.

Example 3. Cloud Computing Diagrams Solution in ConceptDraw STORE
The libraries of objects are surely very useful, but Cloud Computing Diagrams Solution provides also the large set of ready-to use samples. Open the ConceptDraw STORE to see the offered diversity of Cloud Computing diagrams examples and samples.

Example 4. ER Diagram for Cloud Computing
This sample was created in ConceptDraw DIAGRAM using the objects from the libraries of Cloud Computing Diagrams Solution and shows the ER Diagram for Cloud Computing.
Use the Cloud Computing Diagrams Solution for ConceptDraw DIAGRAM software to create your own professional looking Cloud Computing diagrams and schemes fast, easy and effective, and then successfully use them.
All source documents are vector graphic documents. They are available for reviewing, modifying, or converting to a variety of formats (PDF file, MS PowerPoint, MS Visio, and many other graphic formats) from the ConceptDraw STORE. The Cloud Computing Diagrams Solution is available for all ConceptDraw DIAGRAM users.
TEN RELATED HOW TO's:
Also included are standardized hr flowchart symbols, meaning your diagrams will be relevant and understood by all business associates.
Picture: HR Flowchart Symbols
Related Solution:
ConceptDraw DIAGRAM Comparison with Omnigraffle Professional and MS Visio. All source ConceptDraw documents are vector graphic documents. They are available for reviewing, modifying, or converting to a variety of formats: PDF file, MS PowerPoint, MS Visio, and many other graphics formats.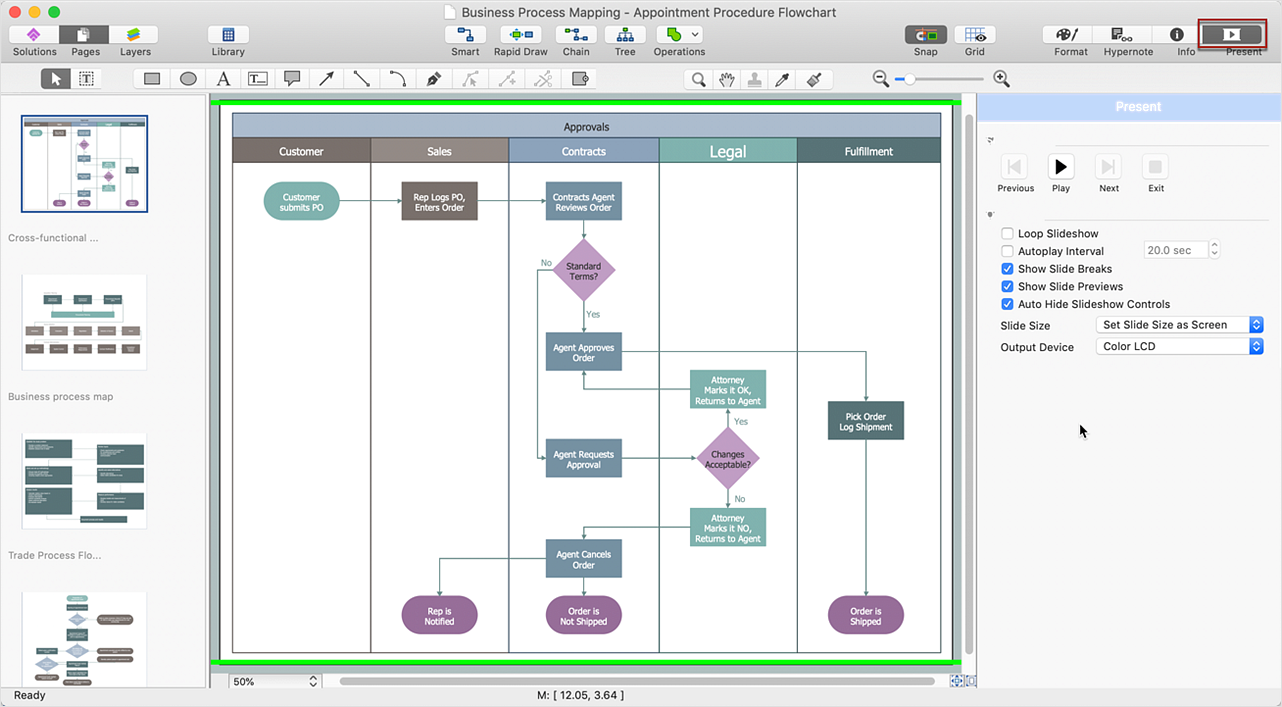
Picture: ConceptDraw DIAGRAM Comparison with Omnigraffle Professional and MS Visio
Related Solution:
How to Draw ER Diagrams? With Entity-Relationship Diagram (ERD) solution from the Software Development Area for ConceptDraw Solution Park you are able to draw ER diagram with no problem. It includes 45 predesigned icons advocated by popular Chen's and Crow’s Foot notations that can be used when describing an enterprise database.
Picture: How to Draw ER Diagrams
Related Solution:
When we think about programming, we usually imagine sleepless nights spent on writing kilobytes of code. However, from another point of view, Software development with ConceptDraw DIAGRAM makes a programmer's life endlessly easier. This tool is unique to fulfill all your needs in short period of time.
Over the recent years object-oriented methodology has become more and more widespread. Thanks to this methodology developers manage to deal with growing complexity of applications. More and more programs are written in such programming languages as C++, Java, Visual Basic and Object Pascal. However, the complexity of the designed systems imposes extended requirements as to design of graphic documentation. ConceptDraw possesses powerful tools for designing of technical documentation for object-oriented projects. The libraries included in the package allow to easily draw class hierarchies, object hierarchies and diagrams of data flows with the use of the most popular notations, including UML and Booch notations. And the library for projecting COM-interfaces will spare developers of ActiveX-servers a headache.
Picture: Software development with ConceptDraw DIAGRAM
Two types of diagrams are used in UML: Structure Diagrams and Behavior Diagrams. Behavior Diagrams represent the processes proceeding in a modeled environment. Structure Diagrams represent the elements that compose the system.
Picture: UML Diagram Types List
Related Solution:
Creating CCTV system diagrams is quick and easy with ConceptDraw DIAGRAM diagramming software enhanced with Audio, Video, Media solution from ConceptDraw Solution Park. It contains library of vector cliparts of video and TV devices and different digital gadgets for drawing this kind of diagrams.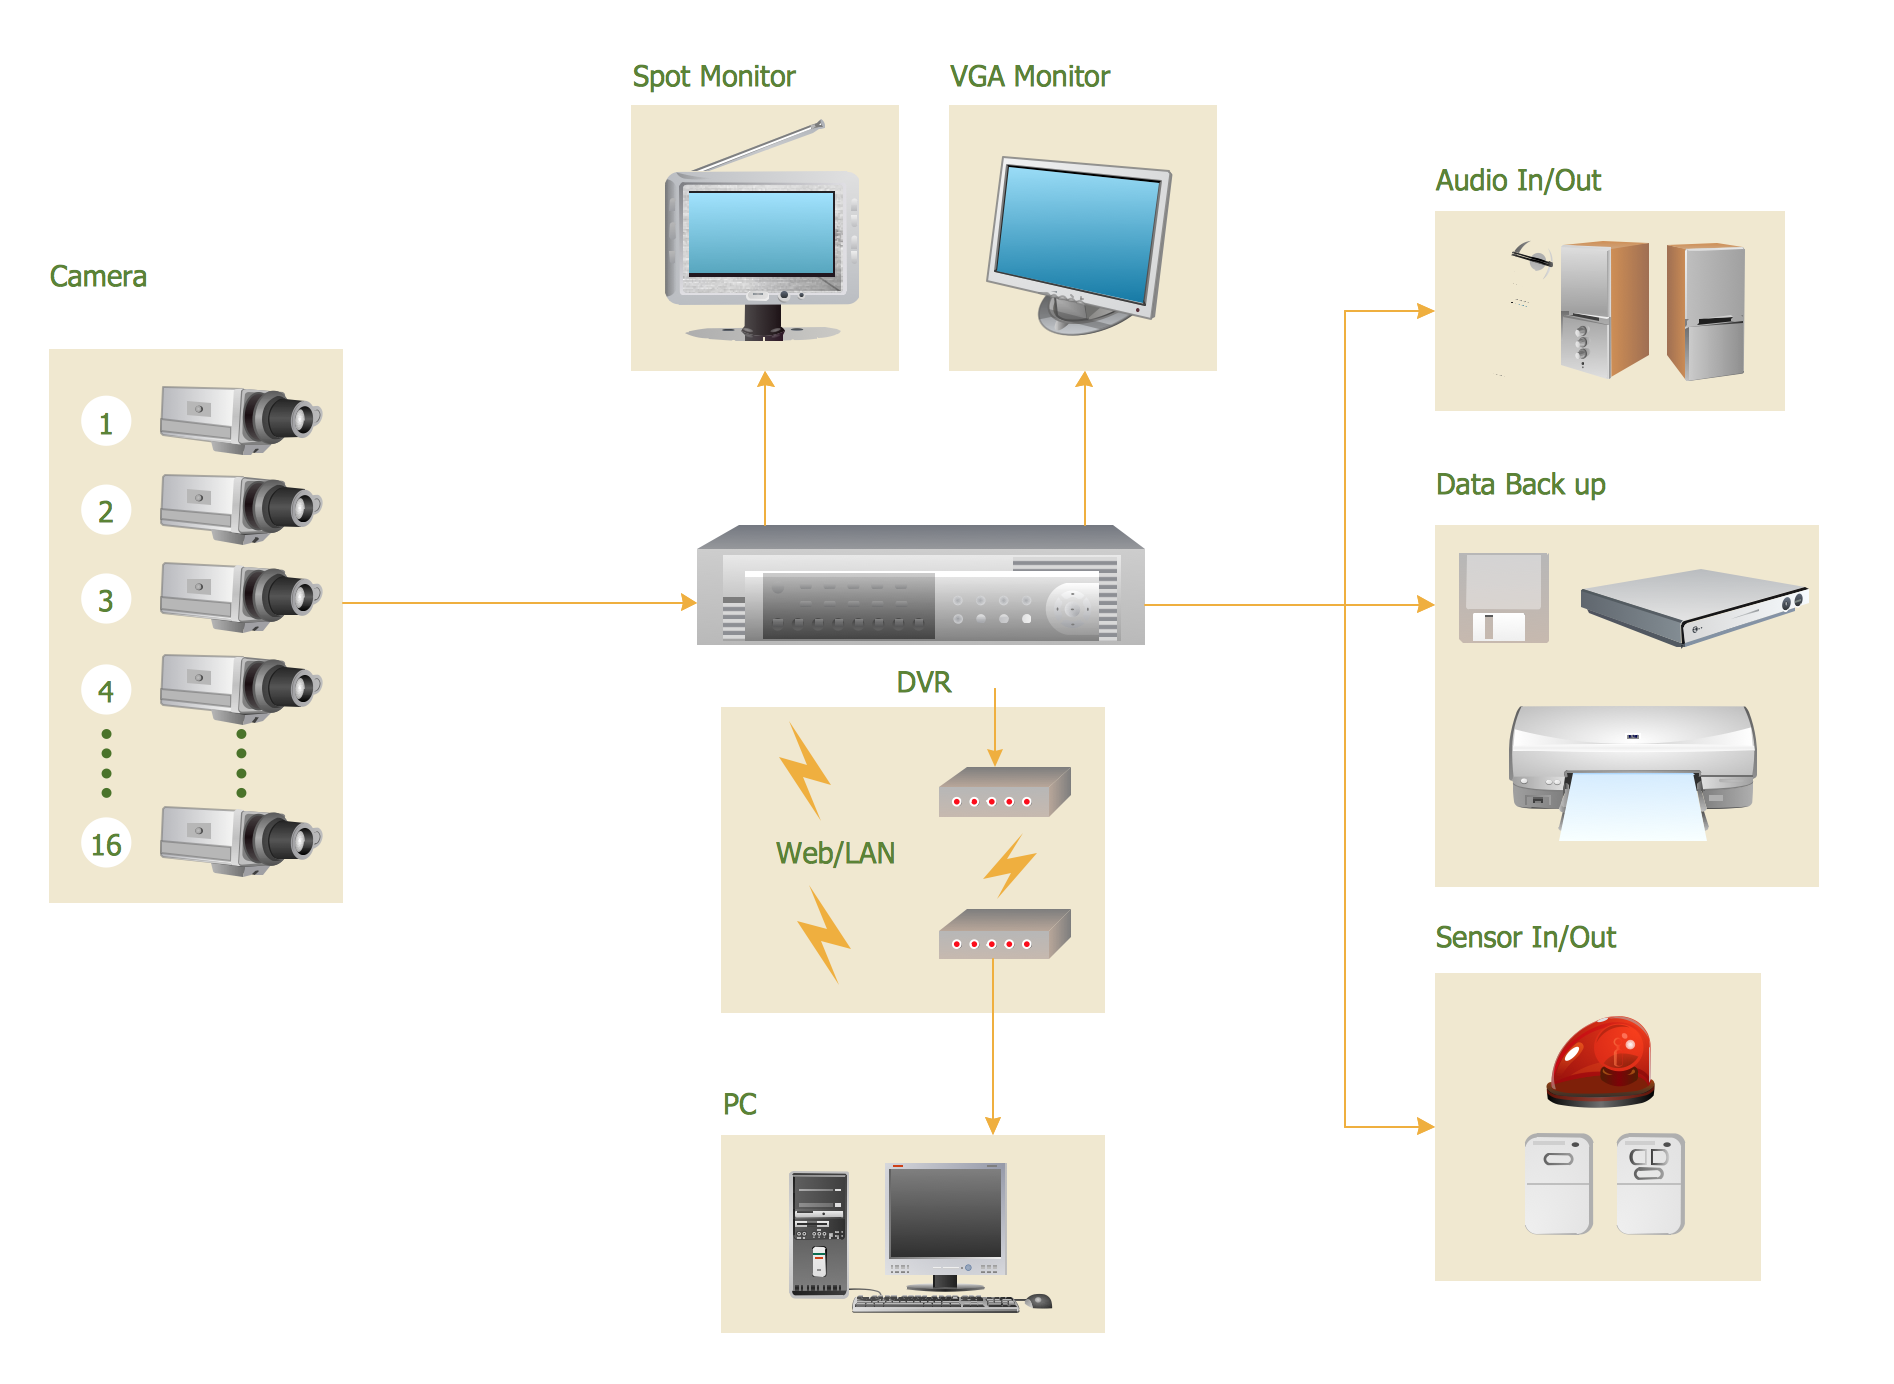
Picture: CCTV Surveillance System Diagram. CCTV Network Diagram Example
Related Solutions:
This sample was created in ConceptDraw DIAGRAM diagramming and vector drawing software using the Floor Plans Solution from the Building Plans area of ConceptDraw Solution Park. It shows the theater architectural design. It’s very useful and necessary plan for building the new theater, for reconstruction and repair the existent theater.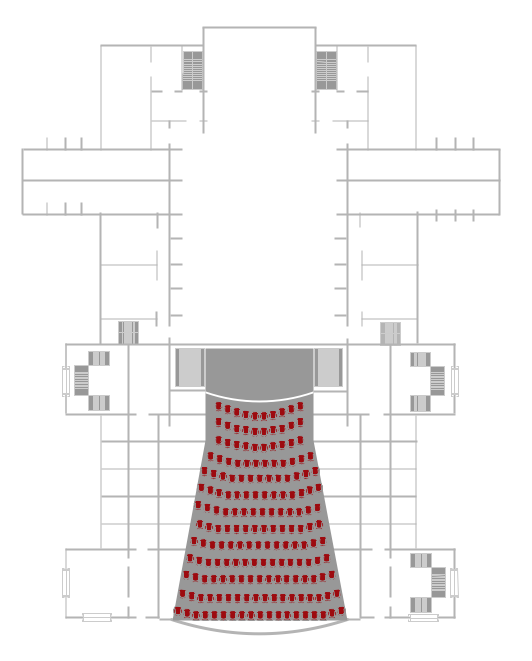
Picture: Making Architectural Designs
Related Solution:
UML Composite Structure Diagram shows the internal structure of a class and the possible interactions at this structure.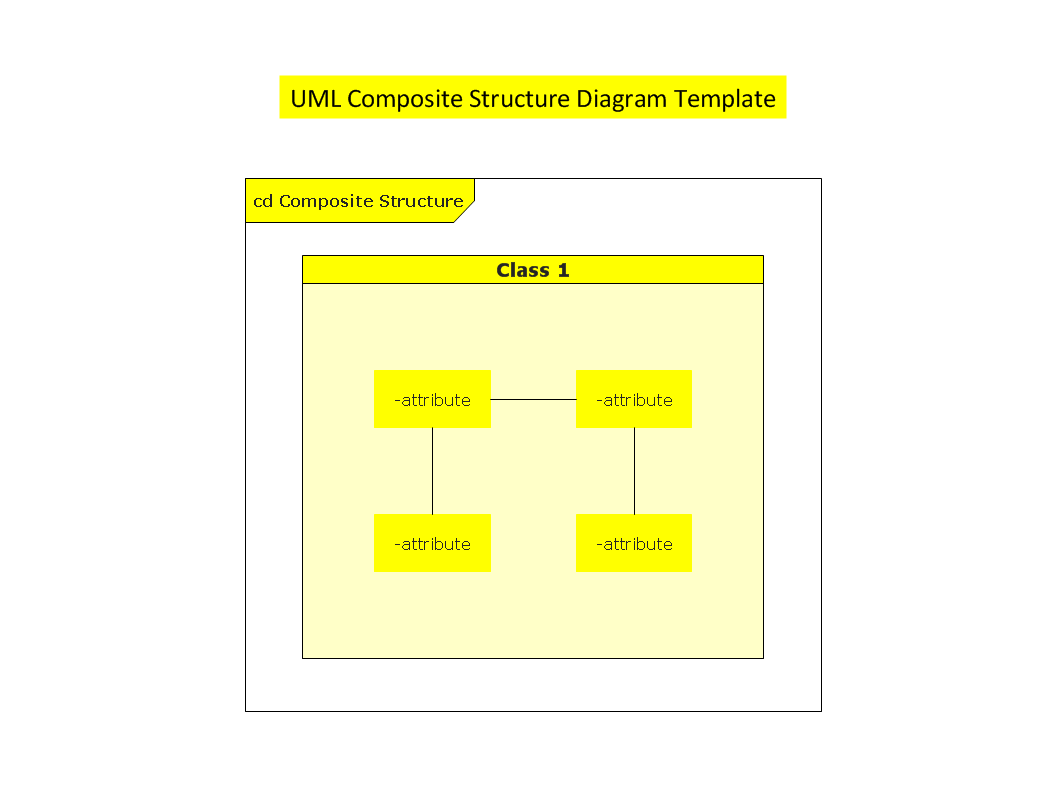
Picture: UML Composite Structure Diagram
The vector stencils library COM and OLE from the solution Software Engineering contains 15 symbols of the COM and OLE objects for ConceptDraw DIAGRAM software.
Picture: COM and OLE Diagram
You can use many tools to create a representation of a system behavior or a scheme of objects relationships. Some of them are quite abstract and useless, and some, like UML tools help clarifying both the structure and the behavior of a system. There are various types of uml diagrams and tons of examples explaining the difference between them.
UML 2.2 specification has many kinds of diagrams. They are divided into two groups( structure and behavior diagrams). This class diagram shows the hierarchical structure of UML 2.2 specification. Class diagram - the most suitable tool for this task because it is designed to describe basic structure of a system. This diagram can be use as a visual aid for learning UML.
Picture: UML Tool & UML Diagram Examples
Related Solution:


