Electrical Symbols — Analog and Digital Logic
Digital electronics or digital (electronic) circuits are electronics that handle digital signals – discrete bands of analog levels – rather than by continuous ranges (as used in analogue electronics). All levels within a band of values represent the same numeric value. Because of this discretization, relatively small changes to the analog signal levels due to manufacturing tolerance, signal attenuation or parasitic noise do not leave the discrete envelope, and as a result are ignored by signal state sensing circuitry.

Pic. 1. Analog and digital logic Library
ConceptDraw DIAGRAM is a powerful software for creating professional looking electrical diagram quick and easy. For this purpose you can use the Electrical Engineering solution from the "Engineering" area of ConceptDraw Solution Park.
Electrical Engineering Solution for ConceptDraw DIAGRAM provides the stencils libraries of ready-to-use predesigned 926 vector symbols, templates and samples that make your electrical drawing quick, easy and effective.
26 libraries of the Electrical Engineering Solution of ConceptDraw DIAGRAM make your electrical diagramming simple, efficient, and effective. You can simply and quickly drop the ready-to-use objects from libraries into your document to create the electrical diagram.

Pic. 2. Electrical Engineering symbols
Electrical diagram software will assist you in drawing your electrical diagrams with minimal effort and makes it very easy for beginners.
Electrical symbols and smart connectors help present your electrical drawings, electrical schematic, wiring diagrams and blue prints.
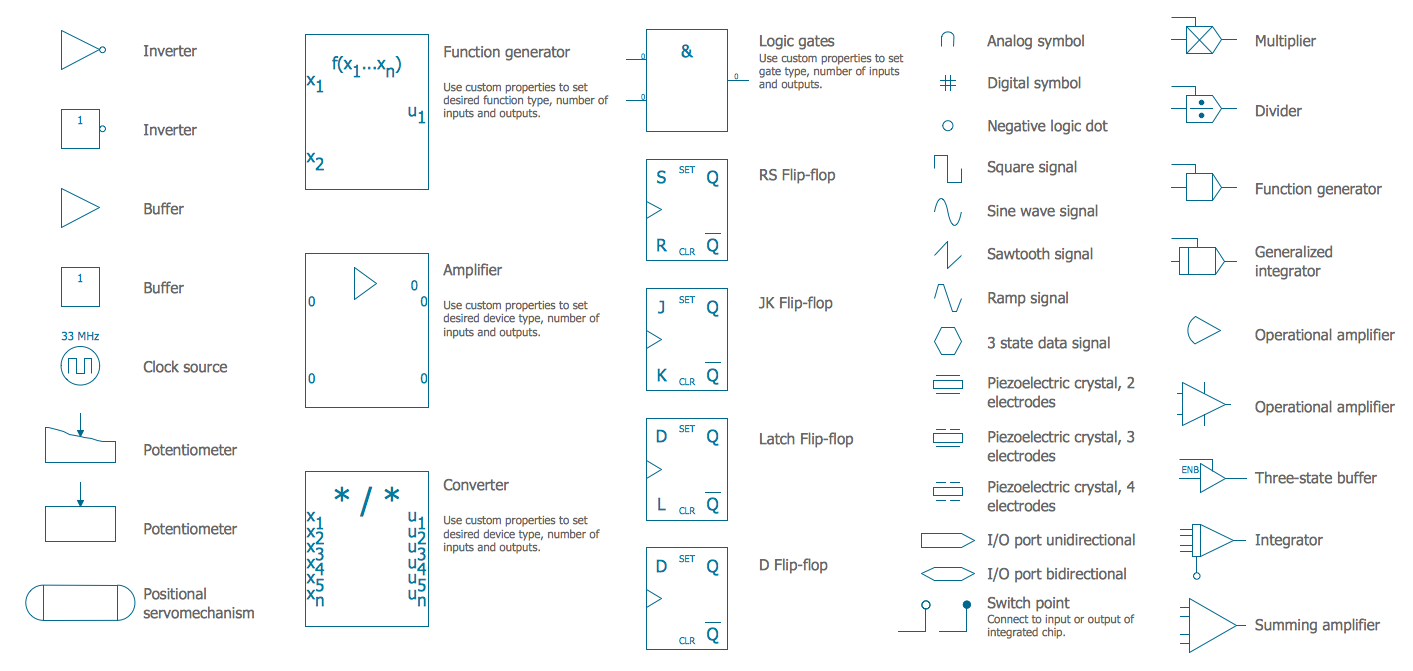
Pic. 3. Electrical Symbols - Analog and Digital Logic
Most of the electrical symbols can be changed in their appearance, styles and colors according to users' requirements. Electrical symbols are used to represent various electrical and electronic devices in a schematic diagram of an electrical or electronic circuit.
The following table lists some analog and digital logic electrical symbols in our electrical diagram software.
| Symbol |
Meaning |
| Electrical Symbols — Analog and Digital Logic |
 | Inverter |
 | Inverter 2 |
 | Buffer |
 | Buffer 2 |
 | Clock |
 | Function generator |
 | Amplifier |
 | Converter |
 | Logic gates 1 |
 | RS Flip-flop |
 | JK Flip-flop |
 | Latch Flip-flop |
 | D Flip-flop |
 | Analog symbol |
 | Digital symbol |
 | Negative logic dot |
 | Potentiometer |
 | Potentiometer 2 |
 | Positional servo |
 | Piezoelectric crystal, 2 electrodes |
 | Piezoelectric crystal, 3 electrodes |
 | Piezoelectric crystal, 4 electrodes |
 | I/O port unidirectional |
 | I/O port bidirectional |
 | Square signal |
 | Sine wave signal |
 | Sawtooth signal |
 | Ramp signal |
 | 3 state data signal |
 | Three-state buffer |
 | Integrator |
 | Summing amplifier |
 | Multiplier |
 | Divider |
 | Function generator 2 |
 | Generalized integrator |
 | Operational amplifier |
 | Operational amplifier 2 |
 | Switch point |
 | Switch point 2 |
Digital electronic circuits are usually made from large assemblies of logic gates, simple electronic representations of Boolean logic functions.
How to Create an Electrical Diagram Using Analog and Digital Logic Library
TEN RELATED HOW TO's:
The metal–oxide–semiconductor field-effect transistor (MOSFET, MOS-FET, or MOS FET) is a type of transistor used for amplifying or switching electronic signals.
Although the MOSFET is a four-terminal device with source (S), gate (G), drain (D), and body (B) terminals, the body (or substrate) of the MOSFET is often connected to the source terminal, making it a three-terminal device like other field-effect transistors. Because these two terminals are normally connected to each other (short-circuited) internally, only three terminals appear in electrical diagrams. The MOSFET is by far the most common transistor in both digital and analog circuits, though the bipolar junction transistor was at one time much more common.
26 libraries of the Electrical Engineering Solution of ConceptDraw DIAGRAM make your electrical diagramming simple, efficient, and effective. You can simply and quickly drop the ready-to-use objects from libraries into your document to create the electrical diagram.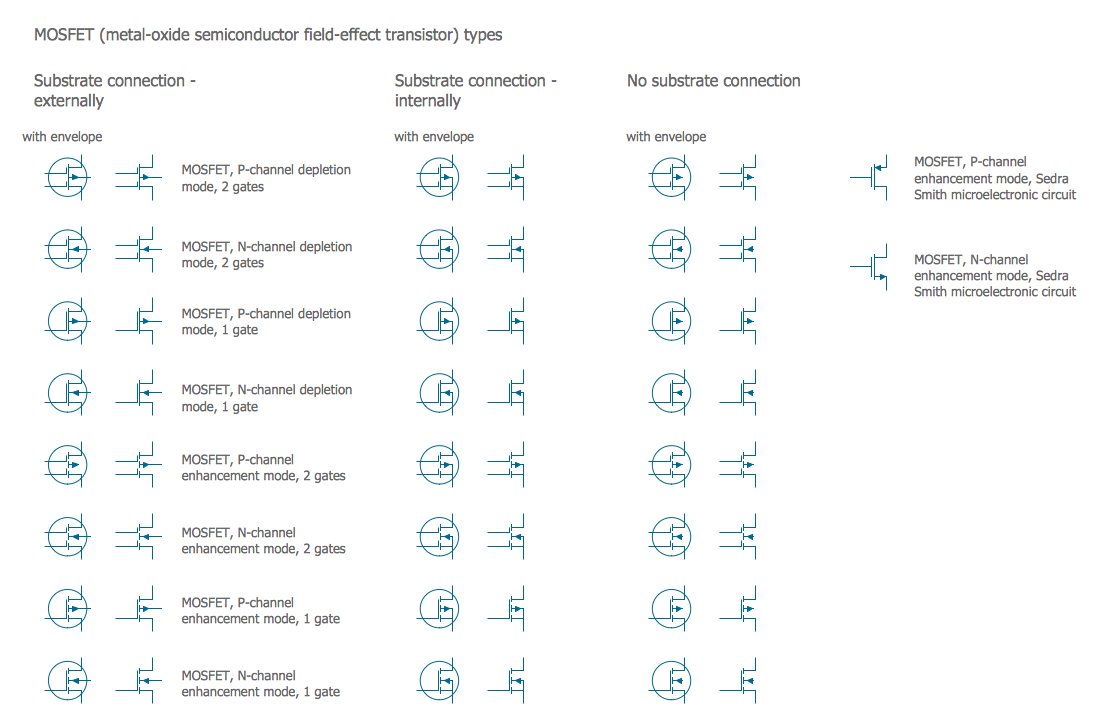
Picture: Electrical Symbols — MOSFET
Related Solution:
Below you can see the symbol for pool table. You can find this symbol in the library of the Floor Plans Solution and use it in your floor plan of the sport complex, home, etc.
ConceptDraw DIAGRAM is a powerful diagramming and vector drawing software for creating the different Floor Plans. It’s very convenient, simple and quick to design the professional looking Floor Plans of any difficulty in ConceptDraw DIAGRAM.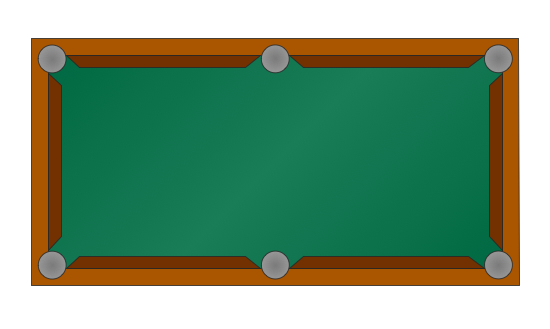
Picture: Symbol for Pool Table for Floor Plans
Related Solution:
While creating flowcharts and process flow diagrams, you should use special objects to define different statements, so anyone aware of flowcharts can get your scheme right. There is a short and an extended list of basic flowchart symbols and their meaning. Basic flowchart symbols include terminator objects, rectangles for describing steps of a process, diamonds representing appearing conditions and questions and parallelograms to show incoming data.
This diagram gives a general review of the standard symbols that are used when creating flowcharts and process flow diagrams. The practice of using a set of standard flowchart symbols was admitted in order to make flowcharts and other process flow diagrams created by any person properly understandable by other people. The flowchart symbols depict different kinds of actions and phases in a process. The sequence of the actions, and the relationships between them are shown by special lines and arrows. There are a large number of flowchart symbols. Which of them can be used in the particular diagram depends on its type. For instance, some symbols used in data flow diagrams usually are not used in the process flowcharts. Business process system use exactly these flowchart symbols.
Picture: Flowchart Symbols: Meaning and Examples
Related Solution:
It is impossible to imagine mechanical engineering without drawings which represent various mechanical schemes and designs. ConceptDraw DIAGRAM diagramming and vector drawing software supplied with Mechanical Engineering solution from the Engineering area of ConceptDraw Solution Park offers the set of useful tools which make it a powerful Mechanical Drawing Software.
Picture: Mechanical Drawing Software
Related Solution:
These libraries of vector objects depict the Site Accessories and Parking and Roads elements. They are needed to draw architectural and landscape plans that show the architectural elements around buildings: parking spaces, hiking and biking trails, drainage systems, lights, and vehicle access control elements. These libraries are included into ConcepDraw solution for Site Planning. Site Accessories and Parking, Roads libraries contain near 40 vector images that will help depict an a surrounding territory at building plans.
These libraries of vector objects depict the Site Accessories and Parking and Roads elements. They are needed to draw architectural and landscape plans that show the architectural elements around buildings: parking spaces, hiking and biking trails, drainage systems, lights, and vehicle access control elements. These libraries are included into ConcepDraw solution for Site Planning. Site Accessories and Parking, Roads libraries contain near 40 vector images that will help depict an a surrounding territory at building plans.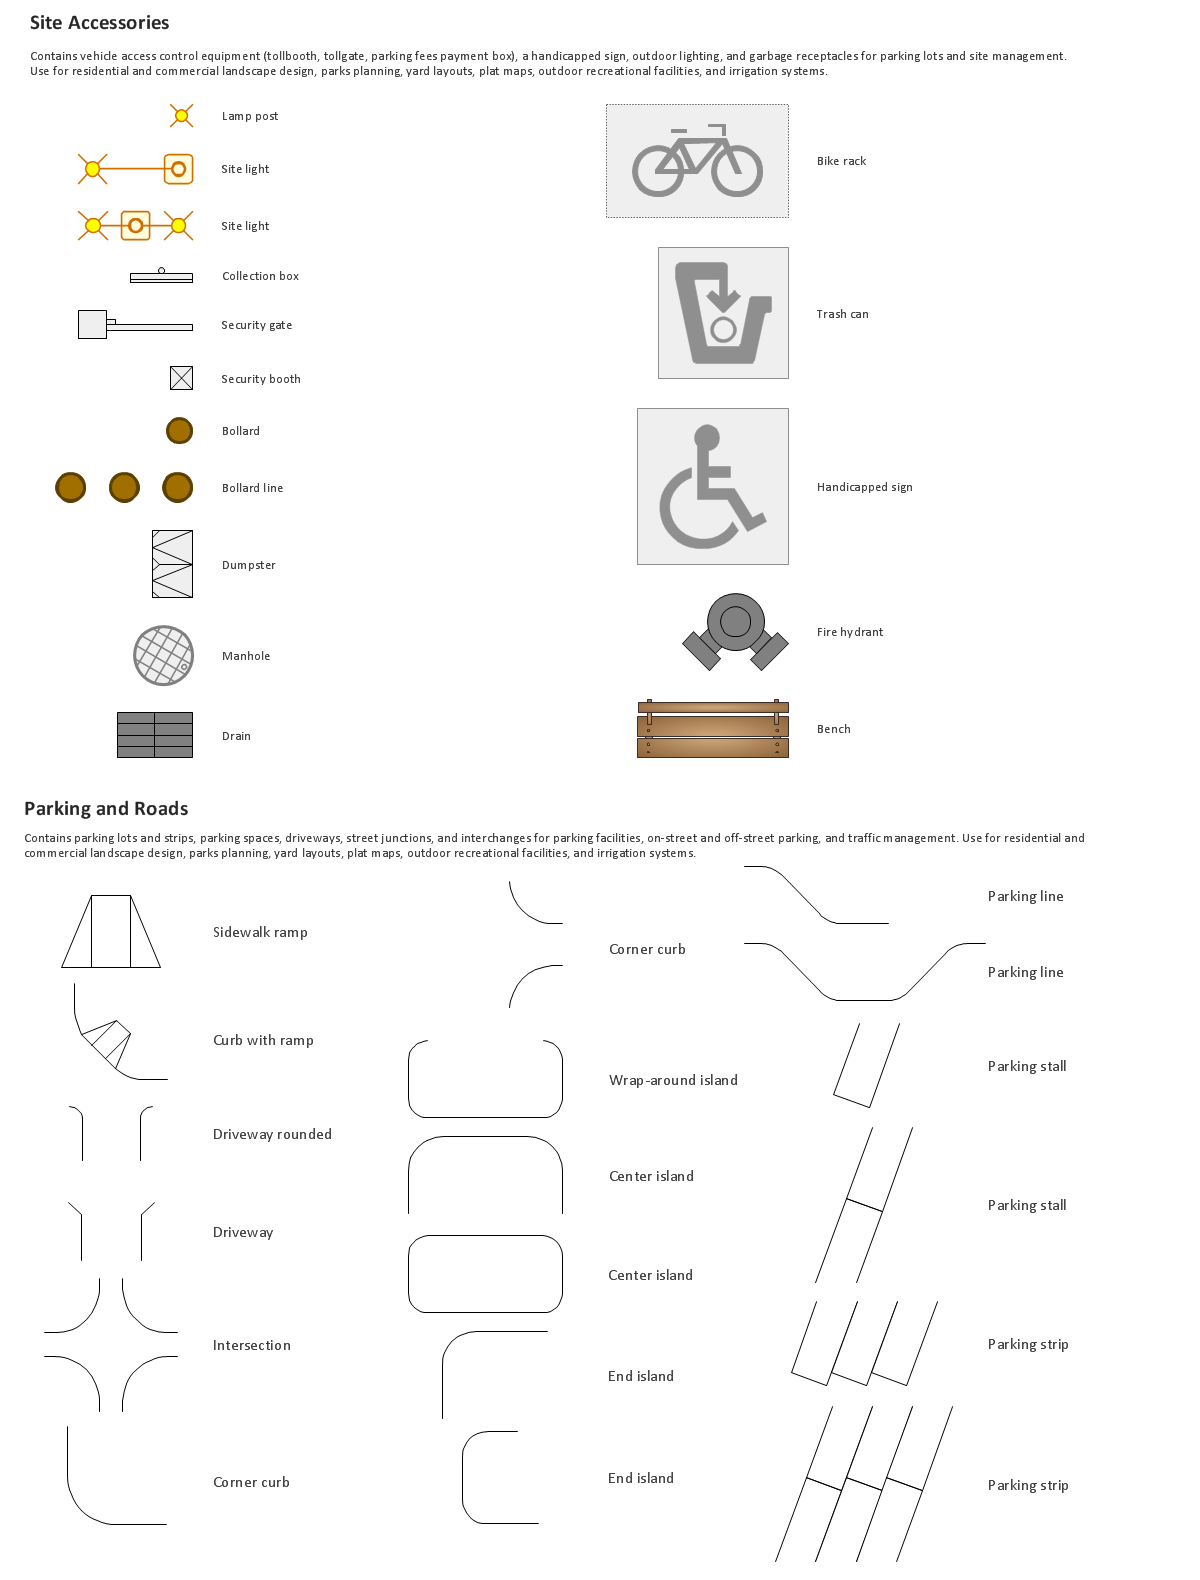
Picture: Building Drawing. Design Element Site Plan
Related Solution:
Network infrastructure planning is a very important process in the network construction, and the share of time allocated to this within the scope of the entire project may reach 60-80%. A competent and thorough approach to planning contributes to the quick investment return, and also increases the reliability and flexibility of the final system, reducing the probability of additional costs related to the incorrect implementation.
Any planning begins with an analysis of the business requirements to the final system. Basic network parameters, which should be assessed are the scalability, accessibility, cost, speed and safety.
Speed and cost are often mistaken for the most important parameters, and the rest of the parameters aren't even remembered. This is not entirely correct. Initially, it is necessary to assess the business plans for the future, because sometimes it is more profitable to invest more money in the beginning. If the business is to develop, then, consequently, demands on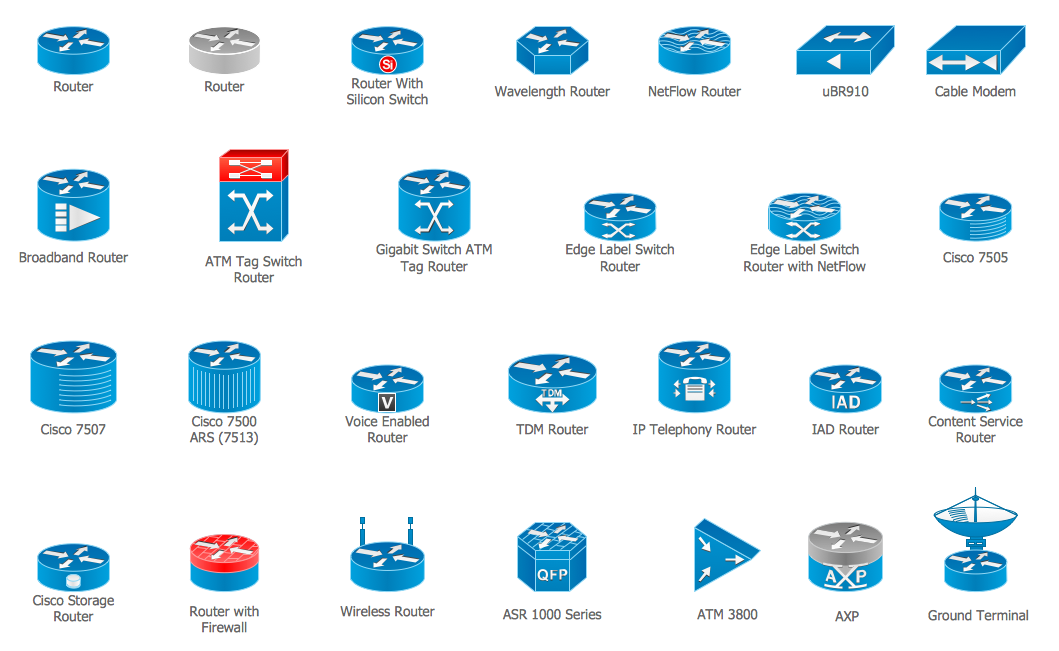
Picture: Cisco Routers. Cisco icons, shapes, stencils and symbols
Related Solution:
ConceptDraw DIAGRAM extended with Mathematics solution from the Science and Education area is a powerful diagramming and vector drawing software that offers all needed tools for mathematical diagrams designing.
Mathematics solution provides 3 libraries with predesigned vector mathematics symbols and figures:
Solid Geometry Library, Plane Geometry Library and Trigonometric Functions Library.
Picture: Mathematics Symbols
Related Solution:
A resistor is a passive two-terminal electrical component that implements electrical resistance as a circuit element. Resistors may be used to reduce current flow, and, at the same time, may act to lower voltage levels within circuits. In electronic circuits, resistors are used to limit current flow, to adjust signal levels, bias active elements, and terminate transmission lines among other uses. Fixed resistors have resistances that only change slightly with temperature, time or operating voltage. Variable resistors can be used to adjust circuit elements (such as a volume control or a lamp dimmer), or as sensing devices for heat, light, humidity, force, or chemical activity.
26 libraries of the Electrical Engineering Solution of ConceptDraw DIAGRAM make your electrical diagramming simple, efficient, and effective. You can simply and quickly drop the ready-to-use objects from libraries into your document to create the electrical diagram.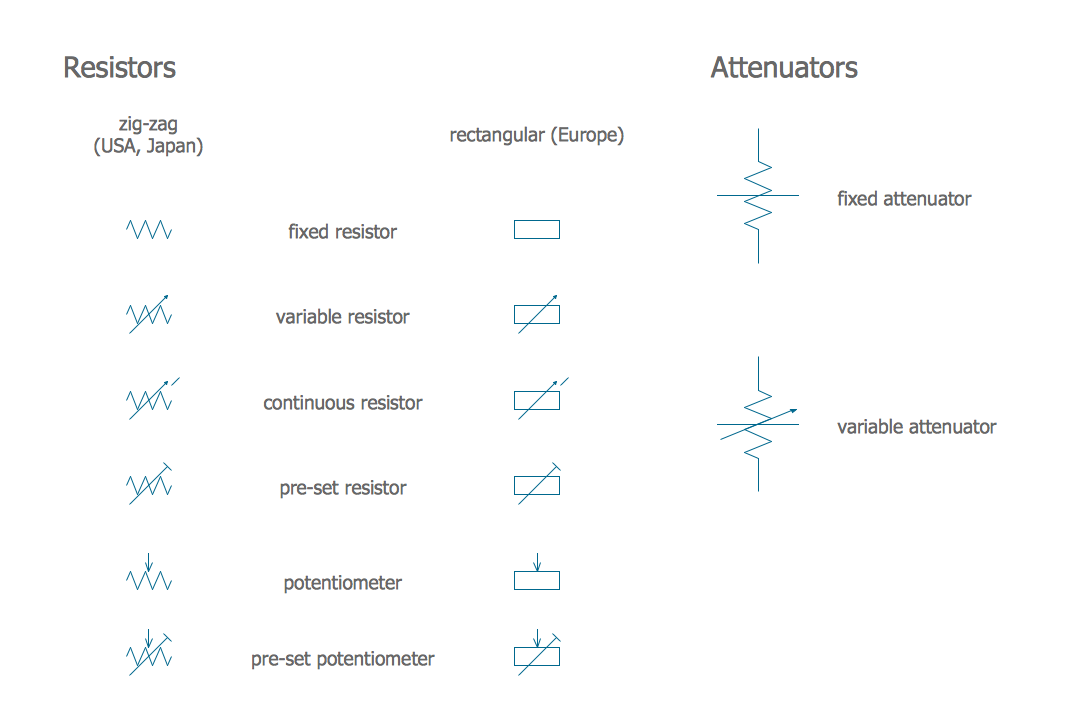
Picture: Electrical Symbols — Resistors
Related Solution:
Business Process Flow Diagram is one of the main tool of business analysis and business process re-engineering that lets identify and easy understand process flows within organization. Sign up and start today.
Picture: Business Process Flow Diagram
Related Solution:
Cisco Network Diagrams solution from the Computer and Networks area of ConceptDraw Solution Park provides 14 libraries with 450 ready-to-use predesigned vector objects that can be used for quickly and easily drawing the professional Cisco Network Diagrams.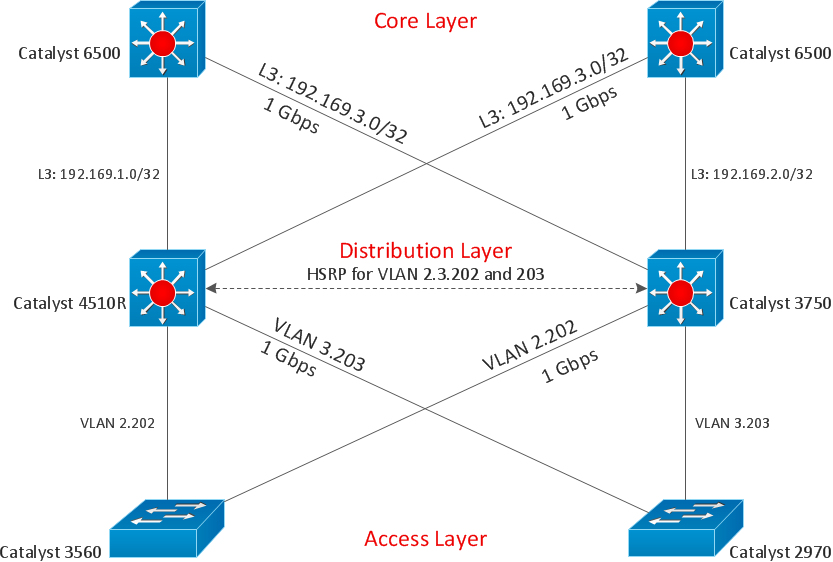
Picture: Cisco Design
Related Solution:


 . To connect elements using this tool, drag the connector from one connect dot to another.You can use Layers to place connections on different layers.

