
Sample 1. Cross-functional flow chart - Credit approval process.
ConceptDraw DIAGRAM diagramming software provides vector shapes and connector tools for quick and easy drawing diagrams for business, technology, science and education.
Use ConceptDraw DIAGRAM enhanced with solutions from ConceptDraw Solution Park to create diagrams to present and explain structures, process flows, logical relationships, networks, design schemes and other visually organized information and knowledge.
TEN RELATED HOW TO's:
It doesn’t matter what kind of business you have, a bar or a gym, there are common concepts for any of them. One of those concepts is accounting, and to facilitate the work with the figures, you can use accounting flowchart symbols and create a clear and representative scheme. You can create flowchart for auditing, tax accounting and even for planning your own budget.
A graphical tool for displaying successive processes is flowchart. This method is mostly suited to represent an accounting process. The sequence of steps in the accounting process usually consists of standard accounting procedures, that can be depicted by using a minimal number of symbols, applied for the basic flowcharting. The advanced opportunity to create professional Accounting Flow charts is provided by ConceptDraw Accounting Flowcharts solution. It includes contains a library of accounting flowchart symbols used when drawing the accounting process flow.
Picture: Accounting Flowchart Symbols
Related Solution:
It’s not easy to plan all the details of your landscape at once. Therefore, you can use a bubble diagram to create a draft of the future project. You can develop any bubble diagrams and use them in your landscape design project with ConceptDraw DIAGRAM and it’s predesigned templates.
This bubble diagram can be applied while initiating the development of garden and landscape design. The bubble diagrams used for this purpose are different from the classic bubble diagrams. Being used in landscape and garden design, they obtain the quite another understanding. Bubbles in this diagram visualize some captured areas, which define the general spaces of a future garden: lawn, flower garden, pool, built-up area, lighting, etc. The bubble diagram represents the landscape project without any special expenses on its creation. It is better to make such simple sketch before you drill down into detailed project and cost estimates.
Picture: Bubble diagrams in Landscape Design with ConceptDraw DIAGRAM
When we think about programming, we usually imagine sleepless nights spent on writing kilobytes of code. However, from another point of view, Software development with ConceptDraw DIAGRAM makes a programmer's life endlessly easier. This tool is unique to fulfill all your needs in short period of time.
Over the recent years object-oriented methodology has become more and more widespread. Thanks to this methodology developers manage to deal with growing complexity of applications. More and more programs are written in such programming languages as C++, Java, Visual Basic and Object Pascal. However, the complexity of the designed systems imposes extended requirements as to design of graphic documentation. ConceptDraw possesses powerful tools for designing of technical documentation for object-oriented projects. The libraries included in the package allow to easily draw class hierarchies, object hierarchies and diagrams of data flows with the use of the most popular notations, including UML and Booch notations. And the library for projecting COM-interfaces will spare developers of ActiveX-servers a headache.
Picture: Software development with ConceptDraw DIAGRAM
If you are an advanced diagramming software user, you might use it daily. Traversing the Internet in searching of alternative to MS Visio for MAC and PC, you can fulfill all your requirements with ConceptDraw DIAGRAM. Don’t hesitate to transfer your documents to another operating system.
When looking for a smart and simple tool for business diagrams as alternative to MS Visio for Apple OS X platform, ConceptDraw DIAGRAM certainly is the best choice. Making many kinds of business charts, numerous technical drawings is what ConcepDraw DIAGRAM is the best. One can easy create any diagram and complete it perfectly and quickly. The big collection of vector object libraries, templates and samples, make it the best Microsoft Visio alternative: ConceptDraw DIAGRAM is simpler to use, less expensive, and supports project management and mind mapping methods.
Picture:
In Searching of Alternative to MS Visio for Mac and PC
with ConceptDraw DIAGRAM
Communication via Internet nowadays is almost irreplaceable part of lifestyle. It’s needless to say that providing that communication is not a piece of cake, and network diagram software is useful for representing all the interconnections between network devices. These diagrams are also helpful for educational purposes.
This drawing depicts the network topology of the sample web studio. This is a physical type of network diagram. It is depicting the network, end-user equipment and connections between them. The given network has combined the both star and mesh network topology features. This diagram is a tool of network administrator. it delivers the actual information on location of servers, hubs, switches, routers, and other telecommunication equipment. The collection of network related symbols provided with ConceptDraw Network Diagrams solution represents the entire network components. All Symbols are standard. Therefore, network specialists can effortlessly decrypt this diagram.
Picture: Network Diagram Software
Related Solution:
There are many tools to manage a process or to illustrate an algorithm or a workflow. Flowcharting is one of those tools. However, it may be difficult to show complex processes that require multiple attributes or several people in a simple flowchart, so a cross-functional flowchart would be a solution for that situation. To create such flowchart, group processes and steps to labeled rows or columns, and divide those groups with horizontal or vertical parallel lines. It is worth mentioning that there are different types of cross-functional flowcharts, like opportunity or deployment flowchart.
This diagram shows a cross-functional flowchart that was made for a trading process. It contains 14 processes, distributed through 5 lines depicting the participants who interact with the process. Also there are connectors that show the data flow of information between processes. The cross-functional flowchart displays a detailed model of the trading process, as well as all participants in the process and how they interact with each other. The lines in the flowchart indicates the position, department and role of the trading process participants.
Picture: Cross-Functional Flowchart
Related Solution:
ConceptDraw DIAGRAM offers a wide choice of powerful and easy-to-use tools for quickly creating all kinds of charts and diagrams. Even if you've never used a drawing tool before, it's very easy to create high-quality professional graphic documents with ConceptDraw DIAGRAM.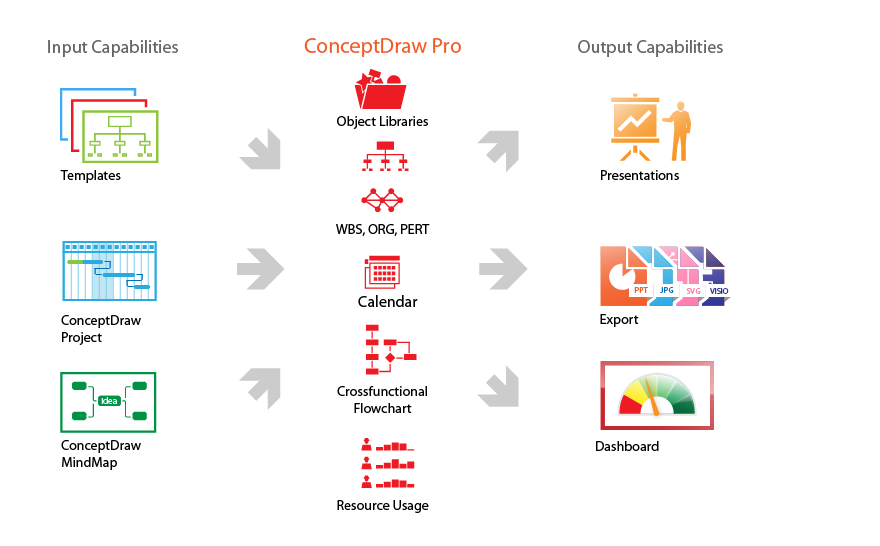
Picture: Product Overview
The ConceptDraw DIAGRAM is a good flow chart app for Mac. Numerous vector stencils, samples and templates created by designers allows you to draw any type of flowchart.
Picture: Good Flow Chart app for Mac
Related Solution:
Data base diagrams describes inter-related data and tables. It describes roles and relationships, internal and external dependencies, data exchange conventions and structures of knowledge domain.
ConceptDraw Software provides number of data-base chart libraries including major 49 vector symbols. Use these DFD flowchart symbol libraries to design data-base structure and models, use it to design data base process-oriented models, or simple data-oriented models. The are special drawing tools for making data flowcharts, data process diagrams, structured analysis diagrams, and information flow diagrams.
Picture: Database Flowchart Symbols
Related Solution:
The ConceptDraw vector stencils library Cisco IBM contains equipment symbols for drawing the computer network diagrams.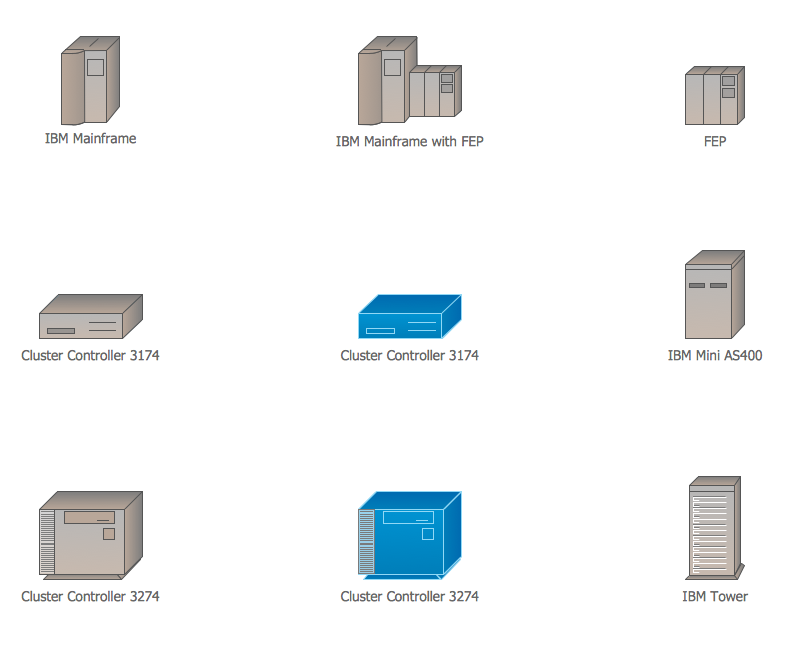
Picture: Cisco IBM. Cisco icons, shapes, stencils and symbols
Related Solution: