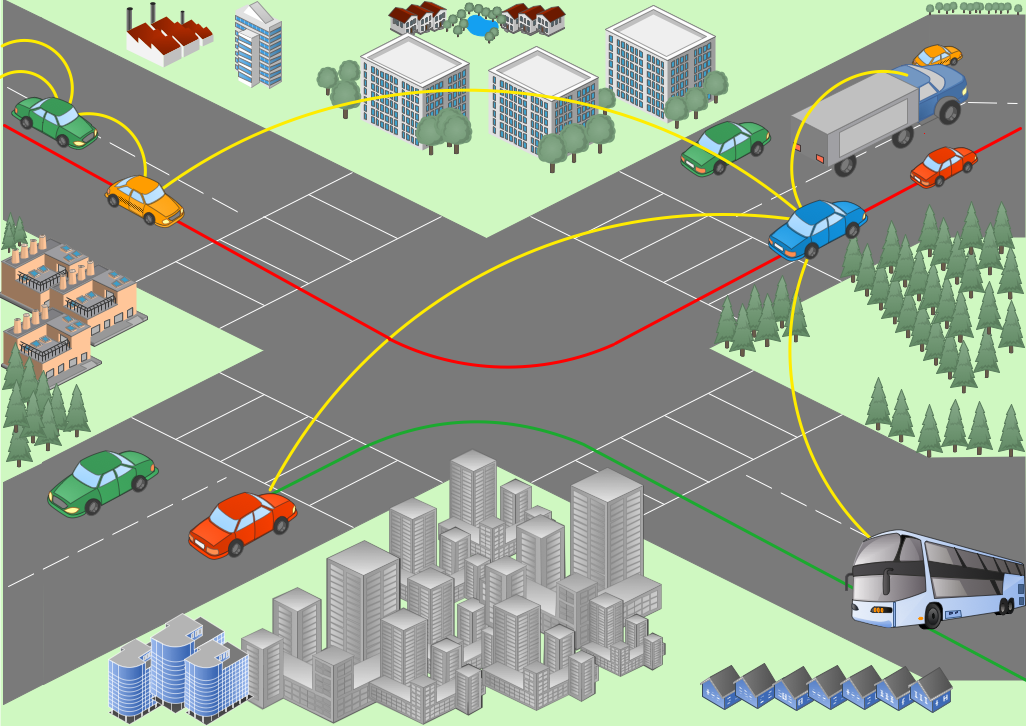
Example 1. Vehicular Delay Tolerant Network Diagram
Vehicular Networking Solution includes 2 libraries:
- Global Networks
- Local Vehicular Networking

Example 2. Global Networks Library Design Elements
The libraries of Vehicular Networking Solution contains 151 various vehicular networking objects. These are vector objects, so you can resize them if needed without losing a quality. You can also change colors, arrange and align objects for your taste.

Example 3. Local Vehicular Networking Library Design Elements
Use also ready samples and templates of Vehicular Networking Solution offered in ConceptDraw STORE. They are professionally designed examples and can became the good base for your vehicular network diagrams.

Example 4. Vehicular Network Diagram - Automatic Vehicle Location
The vehicular network diagrams you see on this page were created in ConceptDraw DIAGRAM using the Vehicular Networking Solution for ConceptDraw DIAGRAM Solution Park. An experienced user spent 10 minutes creating every of these samples.
Use the Vehicular Networking Solution for ConceptDraw DIAGRAM software to create your own professional looking vehicular network diagrams and schemes of any complexity quick, easy and effective, and then successfully use them in your work and life activity.
All source documents are vector graphic documents. They are available for reviewing, modifying, or converting to a variety of formats (PDF file, MS PowerPoint, MS Visio, and many other graphic formats) from the ConceptDraw STORE. The Vehicular Networking Solution is available for all ConceptDraw DIAGRAM or later users.
TEN RELATED HOW TO's:
How should diagramming software work? The answer is - Fast and easy.
Tree- mode drawing works like that. Just select objects in your drawing and press Tree or Chain button to connect all of them just in one click.
Your diagram looks professional and it took only a moment to draw.
Picture: ConceptDraw Arrows10 Technology
Auto-connection mode - This is more than enough versatility to draw any type of diagram with any degree of complexity.
How should diagramming software work? Is it possible to develop a diagram as quickly as the ideas come to you? The innovative Auto-connection mode is what you need to start draw.
Picture: ConceptDraw Arrows10 Technology
An Overlay network is a computer network that is built on the top of another network. The nodes of the overlay network are connected by virtual or logical links.
Overlay networks are widely used in telecommunication. They also allow to improve Internet routing.
Using the solutions of the Computer and Networks Area for ConceptDraw DIAGRAM with wide set of ready-to-use predesigned vector stencils and examples you can design anyone overlay networks quick and easy.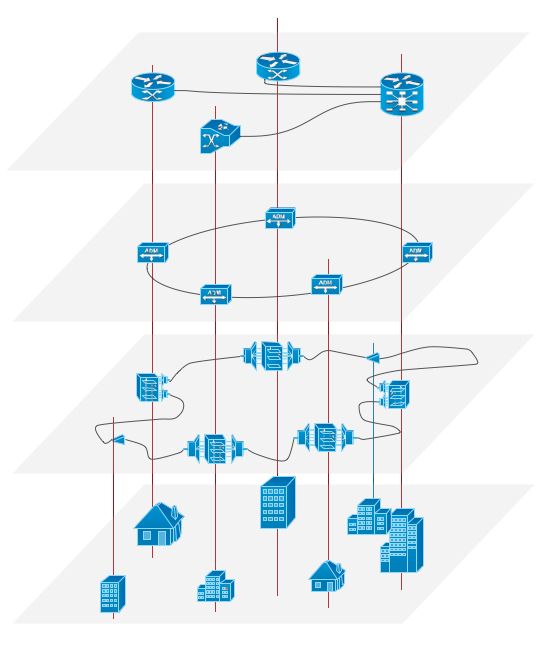
Picture: Overlay networks. Computer and Network Examples
Related Solution:
ConceptDraw DIAGRAM is a powerful Network Engineering software thanks to the Vehicular Networking Solution and many other networking solutions from the Computer and Networks Area of ConceptDraw Solution Park.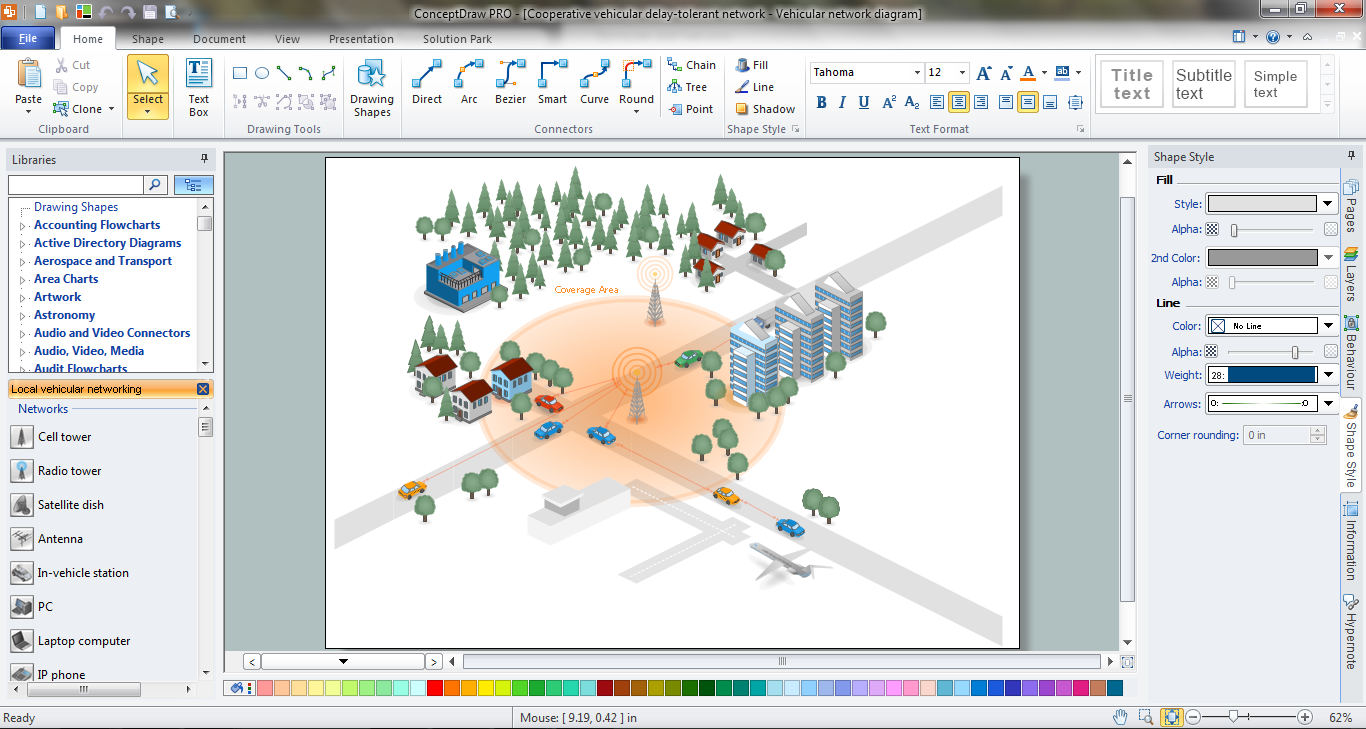
Picture: Network Engineering
Related Solution:
Some organization hold offices for years and decades, or even build their own campuses. However, if it’s time for your organization to move to another building, drawing software for designing office layout plan would come in handy. With such software you can save a lot of time and create a new layout or try to save old layout in a new building.
This office layout plan is an example of a typical office furniture and equipment arrangement. This drawing provides a graphic view of the office area and its facilities including furniture and office equipment. It can be used as template which represent, desks, files, and other pieces of equipment that can be re-arranged according the certain requirements to office space and facilities. The vector graphic objects that represent various office layout elements such as special office furniture and equipment can help you to shape a number of creative ideas and develop your office layout plan.
Picture: Building Drawing Software for Design Office Layout Plan
Related Solution:
Use Software Diagram Templates from the solutions of Software Development area for ConceptDraw DIAGRAM to create your own professional looking Software Diagrams in minutes.
The Software Diagrams designed with ConceptDraw DIAGRAM are vector graphic documents and are available for reviewing, modifying, converting to a variety of formats (image, HTML, PDF file, MS PowerPoint Presentation, Adobe Flash or MS Visio XML), printing and send via e-mail in one moment.
Picture: Software Diagram Templates
While creating flowcharts and process flow diagrams, you should use special objects to define different statements, so anyone aware of flowcharts can get your scheme right. There is a short and an extended list of basic flowchart symbols and their meaning. Basic flowchart symbols include terminator objects, rectangles for describing steps of a process, diamonds representing appearing conditions and questions and parallelograms to show incoming data.
This diagram gives a general review of the standard symbols that are used when creating flowcharts and process flow diagrams. The practice of using a set of standard flowchart symbols was admitted in order to make flowcharts and other process flow diagrams created by any person properly understandable by other people. The flowchart symbols depict different kinds of actions and phases in a process. The sequence of the actions, and the relationships between them are shown by special lines and arrows. There are a large number of flowchart symbols. Which of them can be used in the particular diagram depends on its type. For instance, some symbols used in data flow diagrams usually are not used in the process flowcharts. Business process system use exactly these flowchart symbols.
Picture: Flowchart Symbols: Meaning and Examples
Related Solution:
Today, we can’t imagine our lives without daily data exchange. To call a set of devices that can be connected with each other a computer network, we must be sure that these devices support appropriate protocols to transfer data. A network consisting of personal devices is private, and global computer networks, for example, Internet, connects network nodes worldwide.
This diagram represents a computer telecommunication network. The network depicted on the current diagram is featured with networked communication devices that provide data exchange through Internet. The network interconnections and connections between Internet nodes are settled using the cable media and wireless media. The nodes are the network workstations (terminals). and host computers. This network diagram was drawn with ConceptDraw DIAGRAM and its Computer and Networks Diagrams solution.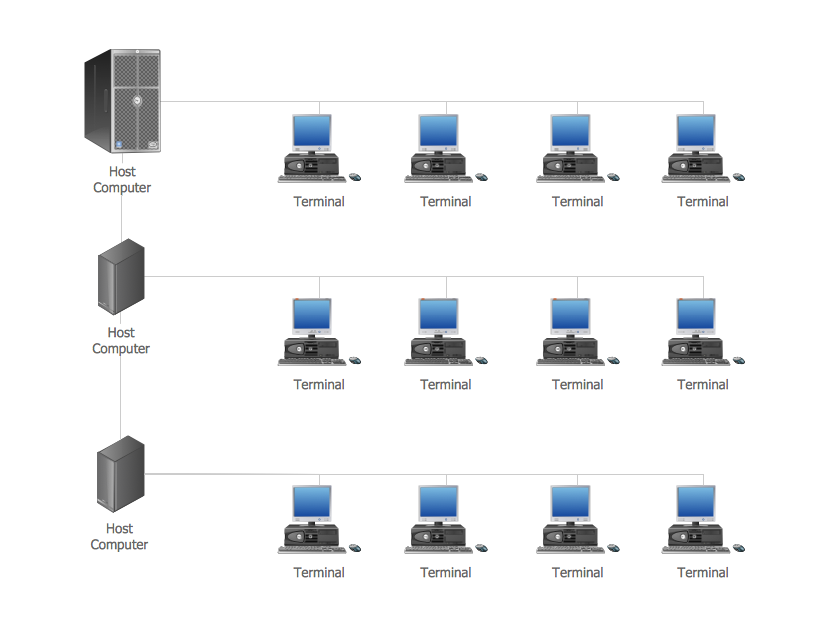
Picture: Computer Network. Computer and Network Examples
Related Solution:
Gant Chart is a graphical representation of tasks as segments on a time scale. It helps plan and monitor project development or resource allocation. The horizontal axis is a time scale, expressed either in absolute or relative time.
Picture: Gant Chart in Project Management
Related Solution:
Wiring and circuit diagrams use special symbols recognized by everyone who uses the drawings. The symbols on the drawings show how components like resistors, capacitors, inductors, switches, lamps, acoustic devices, measuring devices and other electrical and electronic components are connected together.
26 libraries of the Electrical Engineering Solution of ConceptDraw DIAGRAM make your electrical diagramming simple, efficient, and effective. You can simply and quickly drop the ready-to-use objects from libraries into your document to create the electrical diagram.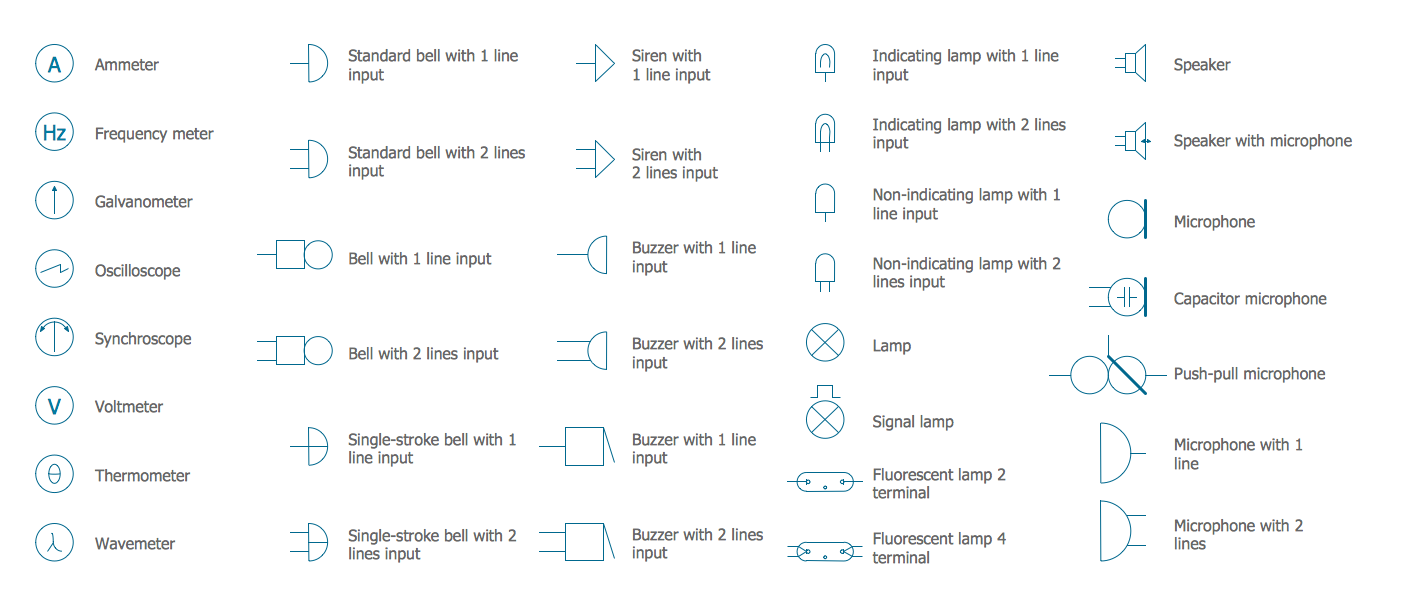
Picture: Electrical Symbols — Lamps, Acoustics, Readouts
Related Solution:


