Software for Creating SWOT Analysis Diagrams
SWOT analysis (alternatively SWOT matrix) is a structured planning method that evaluates four elements (strengths, weaknesses, opportunities, and threats) of a project or business venture. A SWOT analysis can be carried out for a product, place, industry, or person. It involves specifying the objective of the business venture or project and identifying the internal and external factors that are favorable and unfavorable to achieve that objective.
The ConceptDraw is a software for creating SWOT analysis diagrams. The SWOT Analysis solution includes the SWOT matrix samples, and templates that allow users create own SWOT and TOWS diagrams. Use the integration between the MINDMAP and PRO applications for fast drawing the SWOT matrix.

Example 1. Software for Creating SWOT Analysis Diagrams (Mac OS X, Windows)
SWOT analysis is a method of the making plan for evaluate the
- Strengths,
- Weaknesses,
- Opportunities,
- and Threats
involved in a project. It involves specifying the objective of the project and identifying the internal and external causes for the accomplishing project goals.

Example 2. SWOT analysis - Government contract.
This sample of a completed TOWS analysis mind map with example entities provides an example to help you start your analysis.
The SWOT Analysis solution from ConceptDraw Solution Park contains easy-to-use ConceptDraw MINDMAP templates that help identify Strengths, Weaknesses, Opportunities, and Threats, as well as outputs to ConceptDraw DIAGRAM for presenting SWOT and TOWS analysis results.
See also:
Marketing — Matrices
- Marketing positioning matrix - Product positioning map
- Product-market matrix - Ansoff matrix
- BCG matrix - Boston growth-share matrix
- Feature comparison chart - Digital scouting cameras
- Marketing matrix diagram - Competitive strategies
- Marketing matrix diagram - Porters value chain
Marketing — Mind Maps
- Marketing mindmap - Marketing research project
- Marketing mind map - Strategic accomplishment mapping
- Twitter Compaign for New Software Product
- Marketing mind map - Sales Call
TEN RELATED HOW TO's:
What is the ideal GUI interface? The interface of mobile device it's all that users see on it and can interact - screen, bars, icons of applications. So the interface is the first that draws the user's attention. The main goal of software engineers, GUI interface designers, and GUI developers is to make the interface first of all easy for perception and understanding, convenient and attractive for the users. The iPhone's GUI interface meets all these requirements.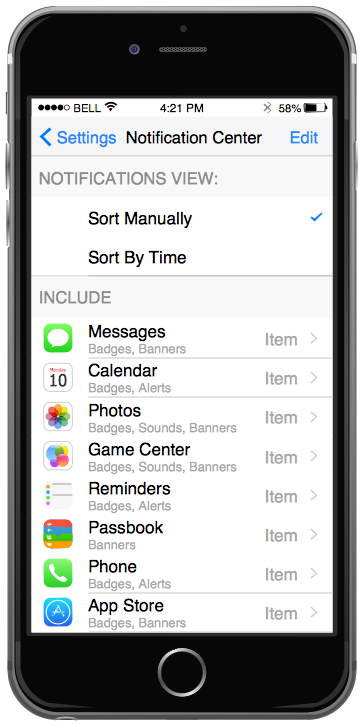
Picture: GUI Interface
Related Solution:
ConceptDraw DIAGRAM is a powerful tool for business and technical diagramming.
Software Development area of ConceptDraw Solution Park provides 5 solutions:
Data Flow Diagrams, Entity-Relationship Diagram (ERD), Graphic User Interface, IDEFO Diagrams, Rapid UML.
Picture: Software Diagram Examples and Templates
Related Solution:
The diagrams with highest level in the hierarchy define the main processes or subsystems with external and internal data sources. To detail them, DFD Library is used to build a system of lower level diagrams. This decomposition continues hereinafter it is meaningless.
This data flow diagram of a system of a library management is a context-level DFD. The data flow diagram of this type depicts the large system as a solid process, and does not input any explanation of its content. It is an ordinary practice - creation of a context-level data flow diagram when starting system development. This DFD was made using ConceptDraw solution designed especially for data flow diagrams development. One can find out Data Flow Diagrams Solution in a Solution Park of ConceptDraw and can use in as addition to the common Conceptdraw DIAGRAM diagramming tools.
Picture: DFD Library System
Related Solution:
A flowchart is a simple but very functional tool when it comes to understanding a workflow or to removing unnecessary stages from a process. When drawing flowcharts, keep in mind that there are four common types of flowcharts, like document flowcharts and data flowcharts that show control over a data or document flow over a system. To show controls on a physical level, use system flowcharts. In addition, to show controls in a program, you can draw a program flowchart.
This flowchart diagram represents the piece of an article editing process, that involves the author and editor. It was created using the Basic Flowchart notation that consists from the basic flowchart symbols. The start and the end of the process are indicated with "Terminator" symbols. The "Process" symbols show the action steps consisting from making edits and searching for a compromise, when the author does not agree with the suggestions of the editor. The "Process" symbol is the general symbol in process flowcharts. The "Decision" symbol indicates a branching in the process flow. There are two branches indicated by a Decision shape in the current flowchart (Yes/No, Disagree/Agree). This basic flowchart can be used as a repeating unit in the workflow diagram describing the working process of some editorial office.
Picture: Types of Flowcharts
Related Solution:
ConceptDraw MINDMAP is a powerful business and personal productivity software application that provides visual organization and access to information for individuals and organizations.
Picture: ConceptDraw MINDMAP :Brainstorming, Mind Mapping for macOS and Windows
TOWS Analysis is a variant of the classic business tool - SWOT analysis, but it is directed more outside. It allows you to analyze the internal environment (weaknesses and strengths) and to plan your own changes through the analysis of changes in the external environment (threats and opportunities).
ConceptDraw DIAGRAM extended with unique SWOT and TOWS Matrix Diagrams Solution from the Management Area is a powerful software for effective TOWS analysis.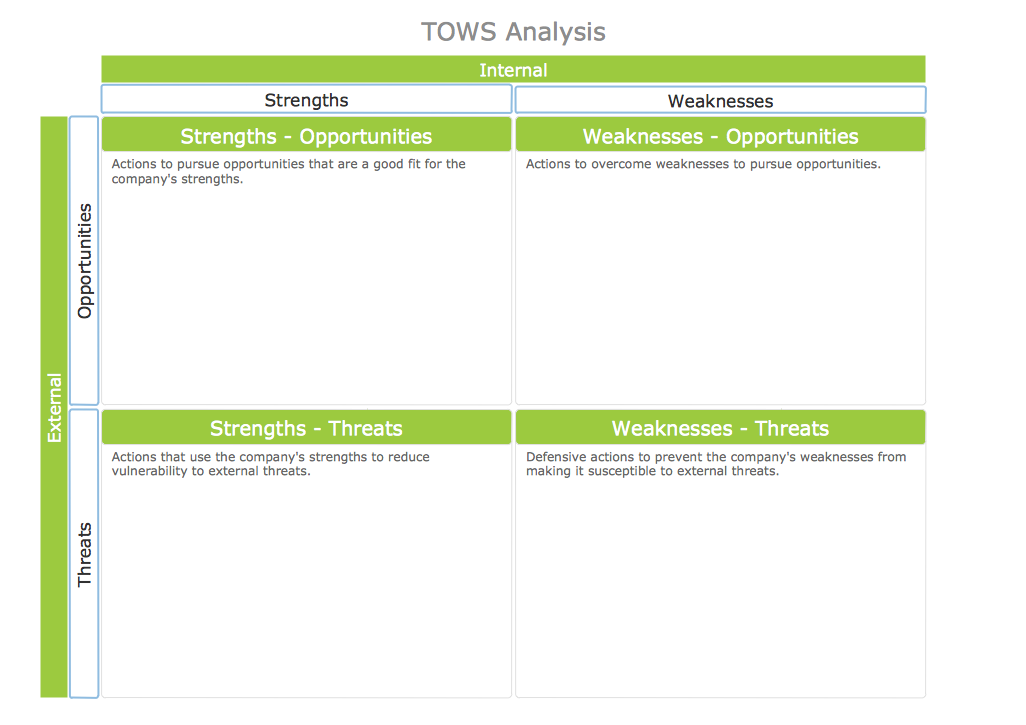
Picture: TOWS Analysis
Related Solution:
ConceptDraw DIAGRAM extended with Fault Tree Analysis Diagrams Solution from the Industrial Engineering Area of ConceptDraw Solution Park is the best Fault Tree Analysis Software.
First of all, Fault Tree Analysis Diagrams Solution provides a set of samples which are the good examples of easy drawing professional looking Fault Tree Analysis Diagrams.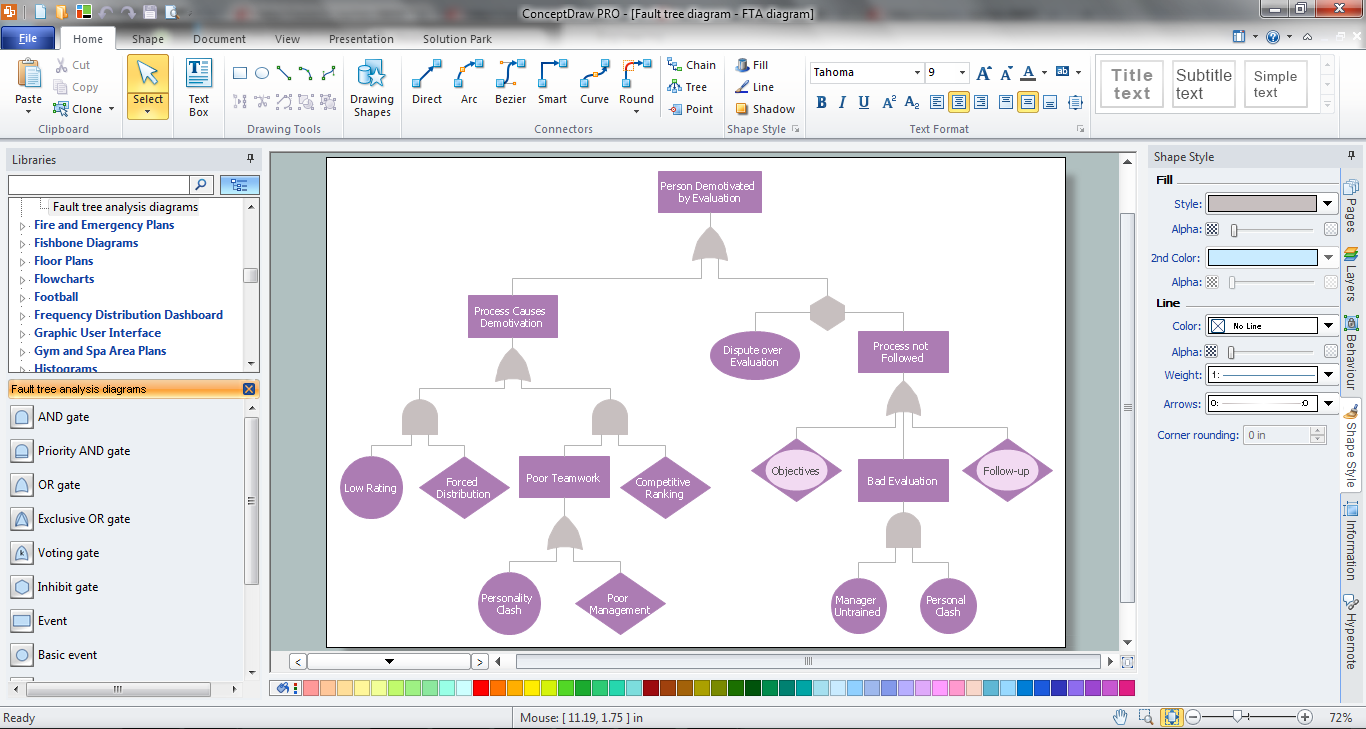
Picture: Fault Tree Analysis Software
Related Solution:
Tracking Olympic results in visual format is the most modern way to deliver statistics to a broad audience. This is a good example of an illustrated table you may easily modify, print, or publish on web from ConceptDraw Winter Sports solution.
Picture: Winter Sports Vector Clipart. Medal Map. Spatial Infographics
Related Solution:
Every company meets some risks during project life cycle. It’s easy to face them using such tools as SWOT analysis matrix diagram that depicts Strengths, Weaknesses, Opportunities and Threats of any proposed subject. ConceptDraw Solution Park contains excellent templates of of SWOT and TOWS matrices.
Making SWOT matrix is frequently used in practical marketing. It is the valuable tool of marketing strategy development. SWOT matrix allows to define the strengths and weaknesses of the organization, possible outside threats and opportunities and evaluate the current strategic competitors. Using ConceptDraw SWOT and TOWS Matrix Diagrams solution you can perform SWOT analysis. You can create a SWOT matrix in and then compare the strengths and weaknesses of your organization and the opportunities and threats of market. The well-performed SWOT-analysis allows you define the steps that can be taken for the improvement of your company market position and determine and problems that need to be solve urgently.
Picture: SWOT analysis matrix diagram templates
This sample shows the Perceptual map. It was created in ConceptDraw DIAGRAM diagramming and vector drawing software using the Matrices Solution from the Marketing area of ConceptDraw Solution Park.
Perception Mapping helps organizations measure and transform all aspects of their business, people and culture. Perception Mapping allows to represent the complex relationships graphically, helps identify potential problems of the organization and make the best decisions.
Picture: Business Tools Perceptual Mapping
Related Solution:
