Made with
ConceptDraw
DIAGRAM 18

Information Architecture

Making such structural design as information architecture with the help of ConceptDraw DIAGRAM diagramming and drawing software, especially in case you have Enterprise Architecture Diagrams Solution downloaded from ConceptDraw STORE application, is always much simpler rather than doing the same thing from a scratch. The main feature of the well developed drawing product, mentioned above, is that you can always use the described solution full of the pre-made vector shapes for explaining such terms as “Enterprise”, “Business Model”, “Operating model”, “Governance”, “Business Capabilities”, “People”, “Business Processes”, “Technology”, “Business Intent sector”, “Business Design sector”, “Influencers”, “Drivers”, “Partners”, “Box (level 1)”, “Box (level 2)”, “Box (level 3)”, etc.

Having the pre-made examples of the diagrams, such as “Enterprise Architecture Diagram”, “Enterprise Architecture Diagram Template”, “Enterprise Architecture Diagram — ISE Enterprise Architecture Framework”, “Enterprise Architecture Diagram — TEAF Work Products” and “Enterprise Architecture Domains Diagram” can simplify your work with creating your own Enterprise Architecture Diagrams as you can always use one of already offered in the “Enterprise Architecture Diagrams Solution” layouts, which can become a base for your own professionally looking drawings.

Information Architecture *

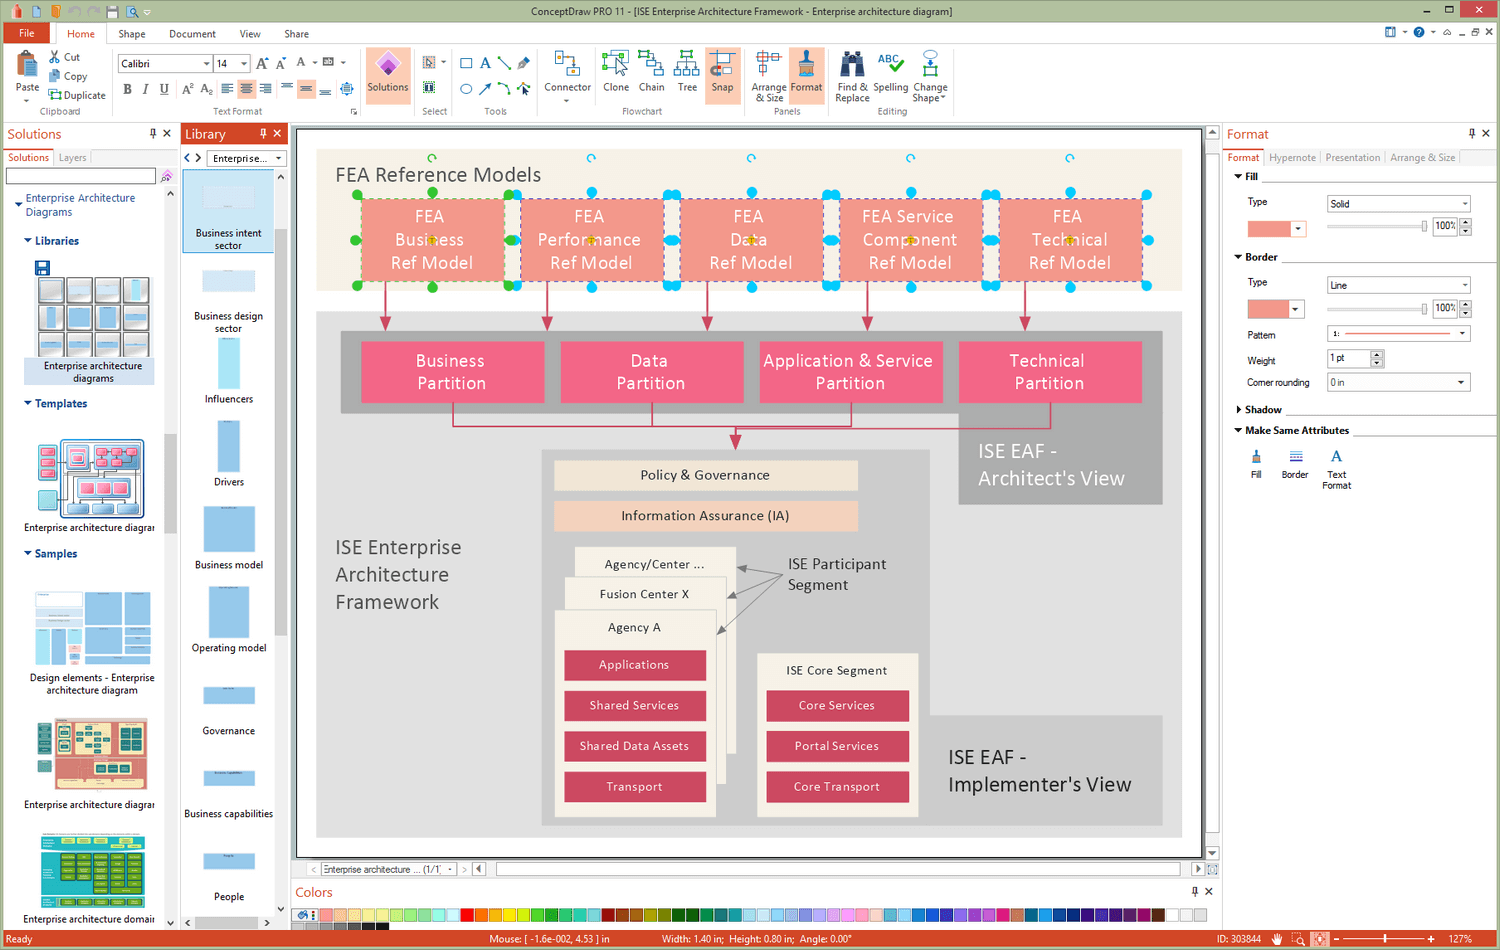
Example 1. Information Architecture

Knowing information architecture as the structural design of some information environment, it is also interesting to get to know that it involves science as well as the art of labelling and organizing different websites, online communities, software and intranets in order to be able to support both findability and usability. It is also an emerging community of the practice, which is known to be focused on using the principles of both architecture and design to the digital landscape. Usually, the mentioned process is known to be involving a concept or some model of information, both used and later applied to activities, which are known to be requiring the explicit details of some complex, usually large, information systems. The mentioned activities can include database development as well as library systems.

Information architecture is simply known to be considered as something founded by Richard Saul Wurman. Nowadays there is a growing network of the active IA specialists who are known to be constituting the Information Architecture Institute. Any information architecture has a few different meanings, depending on which of the branches of information technology or information systems it is used in. Thus, it can be used in the structural design of the shared information environments, the art and/or science of organizing and labelling some websites, online communities, software and/or intranets for supporting the findability as well as usability.

Information architecture can be also used in an emerging community of the practice, which is known to be focused on upbringing the principles of either design or architecture, or both, to the digital landscape. The combination of the process of labelling, search, organization and navigation systems within some particular intranets and websites can be also the field of activity where Information architecture is a commonly used term.

Enterprise Architecture Diagrams Library Design Elements

In order to extract some required parameters or data of the Engineering Designs during the process of creating a so-called “knowledge-base” for linking different systems as well as different standards, Information architecture is also a necessary thing to involve. Information architecture can be also a navigational aid as well as a blueprint to the content of the so-called “information-rich” systems. It is also known to be a subset of the data architecture, where some usable data/information is known to be constructed in. Such data can be designed or arranged in a fashion most useful or/and simply holistic to the users of such data.

The practice of a process of organizing some information, content and/or functionality of some website, presenting the best user experience, having an information as well as the services which are being easily findable and usable (due to the development as well as web design), is also known to be connected with term of “information architecture”. The most difficulty within such processes is to establish a common definition for the "information architecture" term, known to be arising partly from its own existence in the multiple fields. For instance, in the field of the systems design, the information architecture is simply one of the components of the enterprise architecture, known to be dealing with the information component while describing the structure of an enterprise itself.

Thus, as the definition of such term as “information architecture” is known to be well-established, at least within the field of systems design, it is known to be much more debatable within the context of the online information systems (such as websites). Sometimes, information architecture can involve more than just the organization of a website, but also the factors in user experience, considering the usability issues of the information design in this way.

TEAF Work Products for EA Direction, Description and Accomplishment

Example 3. TEAF Work Products for EA Direction, Description and Accomplishment

The information design itself is a commonly known practice of presenting some information so it becomes effective as well as efficient for understanding it. The term itself has come to be used specifically within such field of activity as graphic design for displaying the information in an effective way, instead of making it attractive or using for the artistic expression. The term of information design is also known to be closely related to the field of data visualization, that is why it is known to be often taught as a part of the graphic design courses, as it is an explanation design, used for explaining the facts of the world, leading to knowledge as well as informed action.


NINE RELATED HOW TO's:
When designing a network, it is important to take into account the hierarchy of network devices. When you have a root device you should consider a tree network topology that might have any number of lower levels as you might need. This technology is based on star and bus network topologies. This is a schematic representation of a Tree computer network topology. A tree topology means that some star networks are linked together. A star network is a topology of the local network where a central workstation is connected with each end-user computer or peripherals. A tree structure means that, the central nodes of these star networks are linked to a main cable (the Bus topology). So, a Tree network topology is a few Star networks connected into a Bus topology. This scheme can be applied to draw the particular physical or logical network diagrams using the ConceptDraw Computer and Networks solution.Tree Network Topology Diagram *
Picture: Tree Network Topology Diagram
Related Solution:
In ConceptDraw DIAGRAM it really is sp simple to draw even the most complex cross-functional flowcharts. Use the RapidDraw technology and Cross-Functional libraries in ConceptDraw DIAGRAM for the best results.How to Simplify Flow Charting — Cross-functional Flowchart
Picture: How to Simplify Flow Charting — Cross-functional Flowchart
Related Solution:
ConceptDraw DIAGRAM is a powerful tool that helps you create a Cross Functional Flow Chart quickly and easily. Fine-tuning the objects in ConceptDraw DIAGRAM allows you to create a really professional finished article. ConceptDraw Arrows10 Technology gives drawing connectors a smart behavior that provides quick and precise placement, allows for easy changes and automatic rearrangement.Double-headed Cross Functional Flowchart *
Picture: Double-headed Cross Functional Flowchart
Related Solution:
An event-driven process chain diagram is a flowchart used in business process analysis. It evolved from Architecture of Integrated Information Systems (ARIS) and utilised in the business process improvement and analysis. It is also used to facilitate enterprise resource planning. An EPC diagram is a complex flowchart that shows different business processes through various workflows. The workflows are seen as functions and events that are connected by different teams or people, as well as tasks that allow business processes to be executed. ConceptDraw DIAGRAM is a software for making EPC diagrams that allows managers visually present business process models for making decisions for business.How to Draw EPC Diagram Quickly *
Picture: How to Draw EPC Diagram Quickly
Related Solution:
It’s very important for any establishment to have a fire exit plan and to train it several times a year. The plan must be put on each floor of the building in a way that it could be easily seen. To make the plan clear and descriptive, you should look through examples and then create one for you your building. Find out the fire exit plan example created with ConceptDraw DIAGRAM and its Fire and Emergency Plans solution. This plan is a floor plan that shows the ways in which people inside the building can be evacuated in the event of a fire. The location of telephones, fire extinguishers and first aid kits are indicated on the fire exit plan. The Legend in the lower right corner of the plan makes it clear and easy-to-read. Such plan should be placed on the wall on each floor of the building.Fire Exit Map Example
Picture: Fire Exit Plan. Building Plan Examples
Related Solution:
ConceptDraw DIAGRAM extended with Mathematics solution from the Science and Education area is a powerful diagramming and vector drawing software that offers all needed tools for mathematical diagrams designing. Mathematics solution provides 3 libraries with predesigned vector mathematics symbols and figures: Solid Geometry Library, Plane Geometry Library and Trigonometric Functions Library.Mathematics Symbols *
Picture: Mathematics Symbols
Related Solution:
This sample shows the UML Class Diagram that was created in ConceptDraw DIAGRAM on the Mac and then was opened for editing in MS Visio. Using the 13 libraries of the Rapid UML Solution for ConceptDraw DIAGRAM you can create your own visual vector UML diagrams quick and easy.UML Diagram Visio *
Picture: UML Diagram Visio
Related Solution:
There are many ways to define the flow of information within a system. Structured-systems analysis method often uses data flow diagrams to show data flow, data storages and data processing visualization. These diagrams are easy to develop and quite useful. Here is a dataflow diagram presenting an example of the manufacturing process flow. The oval process shapes represent a process that controls data within the current system. The process may produce data or make some action based on data. Data flows are represented by lines. They show the movement of information through the system. The direction of the data flow is depicted by the arrow. The external entities are shown by rectangles. They represent the external entities interacting with the system. The data store objects (unclosed rectangles) are used to show data bases participating in a process flow.Data Flow Diagram *
Picture: Data Flow Diagram
Related Solution:
ConceptDraw DIAGRAM software extended with Fishbone Diagrams solution from the Management area of ConceptDraw Solution Park is perfect for Cause and Effect Diagram creating. It gives the ability to draw fishbone diagram that identifies many possible causes for an effect or a problem. Causes and Effects are usually grouped into major categories to identify these sources of variation. Causes and Effects in the diagram show relationships among various factor. Fishbone diagram shows factors of Equipment, Process, People, Materials, Environment and Management, all affecting the overall problem.Cause and Effect Diagram *
Picture: Cause and Effect Diagram
Related Solution:
ConceptDraw
DIAGRAM 18