Amazon Cloud Computing Architecture
The term “Amazon Web Services” describes both a company (“Amazon”) and the technology this company provides. The “Amazon” company has its site, which is www.amazon.com, providing the computer platforms to its users, as well as the government representatives and different companies, offering the “free-tier” option, which expires in 1 year after registration. The “Amazon” technology allows its subscribers to have full-fledged virtual computers. These computers are available any time to any of the “Amazon” users, who need them, while they use the internet. The virtual computers, which are provided, have the real computer attributes, such as a choice of operating systems, networking and pre-loaded application software (for example, web servers, databases, etc.).
Each of the Amazon Web Services systems virtualizes its console, including the display, mouse and keyboard. This console allows its subscribers to connect to their Amazon Web Services system using their browser. This browser acts as a window into their “virtual computer”. The users of AWS can log-in any time they need their virtual computers and they can use any of them as if they used the real physical computers. The users can also choose to deploy their AWS systems in order to provide all of the needed internet-based services for their own as well as their customers' benefit.
This AWS technology bases on a single virtual AWS computer, a physical computer or even a few different physical computers. Amazon keeps its right to upgrade, provide and manage the industry-standard security to each of its subscribers’ system. The AWS services can be found in many global geographical regions and they include one of the services named “Amazon Elastic Compute Cloud”.
Amazon Elastic Compute Cloud is one of the main services, provided by the Amazon.com’s cloud-computing platform – AWS. It allows Amazon’s users to rent the virtual computers, which they can use to run their own computer applications on. “Amazon Elastic Compute Cloud” is also known as “EC2”. It encourages the scalable deployment of applications by providing a web service, with the help of which any Amazon user can boot a so-called “Amazon Machine Image” or “AMI”. He can do that in order to configure his virtual machine, known in Amazon as "instance". This "instance" contains any needed software, so any user can launch, terminate and create the server-instances any time he needs. EC2 is useful for providing its users the control over their geographical locations of the instances, allowing the so-called “latency optimization” as well as the high levels of redundancy.
AWS comprised over 70 services, including computing, database, analytics, management, application, services, networking, deployment, storage, mobile and other different developer tools. The tools also include so-called “Internet of Things”. “Amazon Simple Storage Service” is also a quite popular service, most of which are not exposed directly to the end users, but they offer their functionality through APIs. Having these services working this way is very useful for the developers in order for them to have it in their applications. The Amazon developers offer their users a large scale of computing capacity for cheaper and still quick use, instead of building their own physical server farm. All of the services provided by Amazon are billed and they are based on the usage.
There are still very many other services provided by “Amazon Web Services” we have not mentioned yet, such as “Amazon CloudSearch”, “Amazon DevPay”, “Amazon Elastic Transcoder”, “Amazon Simple Email Service”, “Amazon Simple Queue Service”, “Amazon Simple Notification Service”, “Amazon Simple Workflow”, “Amazon Cognito”, “Amazon AppStream 2.0”, “Amazon Athena”, “Amazon Elastic MapReduce”, “Amazon Machine Learning”, “Amazon Kinesis”, “Amazon EC2 Container Service”, “Amazon Elasticsearch Service”, “Amazon QuickSight”, “Amazon Marketplace Web Service”, “AWS Direct Connect”, “Amazon Fulfillment Web Service”, “Amazon Historical Pricing”, “Amazon Product Advertising API”, “Amazon Gift Code On Demand” or “AGCOD”, “AWS Partner Network” or “APN”, “Amazon Lumberyard”, “Amazon Chime”, “Amazon DynamoDB”, “Amazon ElastiCache”, “Amazon Relational Database Service”, “Amazon Redshift”, “Amazon SimpleDB”, “AWS Data Pipeline”, “Amazon API Gateway”, “Amazon Aurora”, “AWS CloudFormation”, “AWS Elastic Beanstalk”, “AWS OpsWorks”, “AWS CodeDeploy”, “Amazon Identity and Access Management”, “AWS Directory Service”, “Amazon CloudWatch”, “AWS Management Console” or “AWS Console”, “Amazon CloudHSM”, “AWS Key Management Service”, “Amazon Elastic Load Balancing”, “AWS Elastic Network Adapter”, “Amazon CloudFront”, “Amazon Simple Storage Service”, “Amazon Glacier”, “AWS Storage Gateway”, “Amazon Elastic Block Store”, “AWS Import/Export”, “Amazon Elastic File System” and other.
Now, knowing the description of what “Amazon Web Services” is, you can always make your own “Amazon Web Services diagrams”. Using ConceptDraw DIAGRAM software as a powerful diagramming and vector drawing tool, you can always make any needed diagram within only a couple of hours or even a couple of minutes, having the right solution downloaded from ConceptDraw STORE. In case you have ConceptDraw DIAGRAM as well as ConceptDraw STORE downloaded on your computer, then you will find the process of achieving the needed result much simpler in order for you to make any drawing needed getting a great looking result.
The “AWS Architecture Diagrams solution” developed by the CS Odessa team was created especially for ConceptDraw DIAGRAM users for a purpose of simplifying their work with making the diagrams, such as “Amazon Web Services” ones. You can always find and download this solution from the “Computer and Networks Area” on this site, or you can simply get it from ConceptDraw STORE application, which allows choosing any of the solutions you need, each of which is full of the stencil libraries with design elements, such as different symbols, icons, etc.
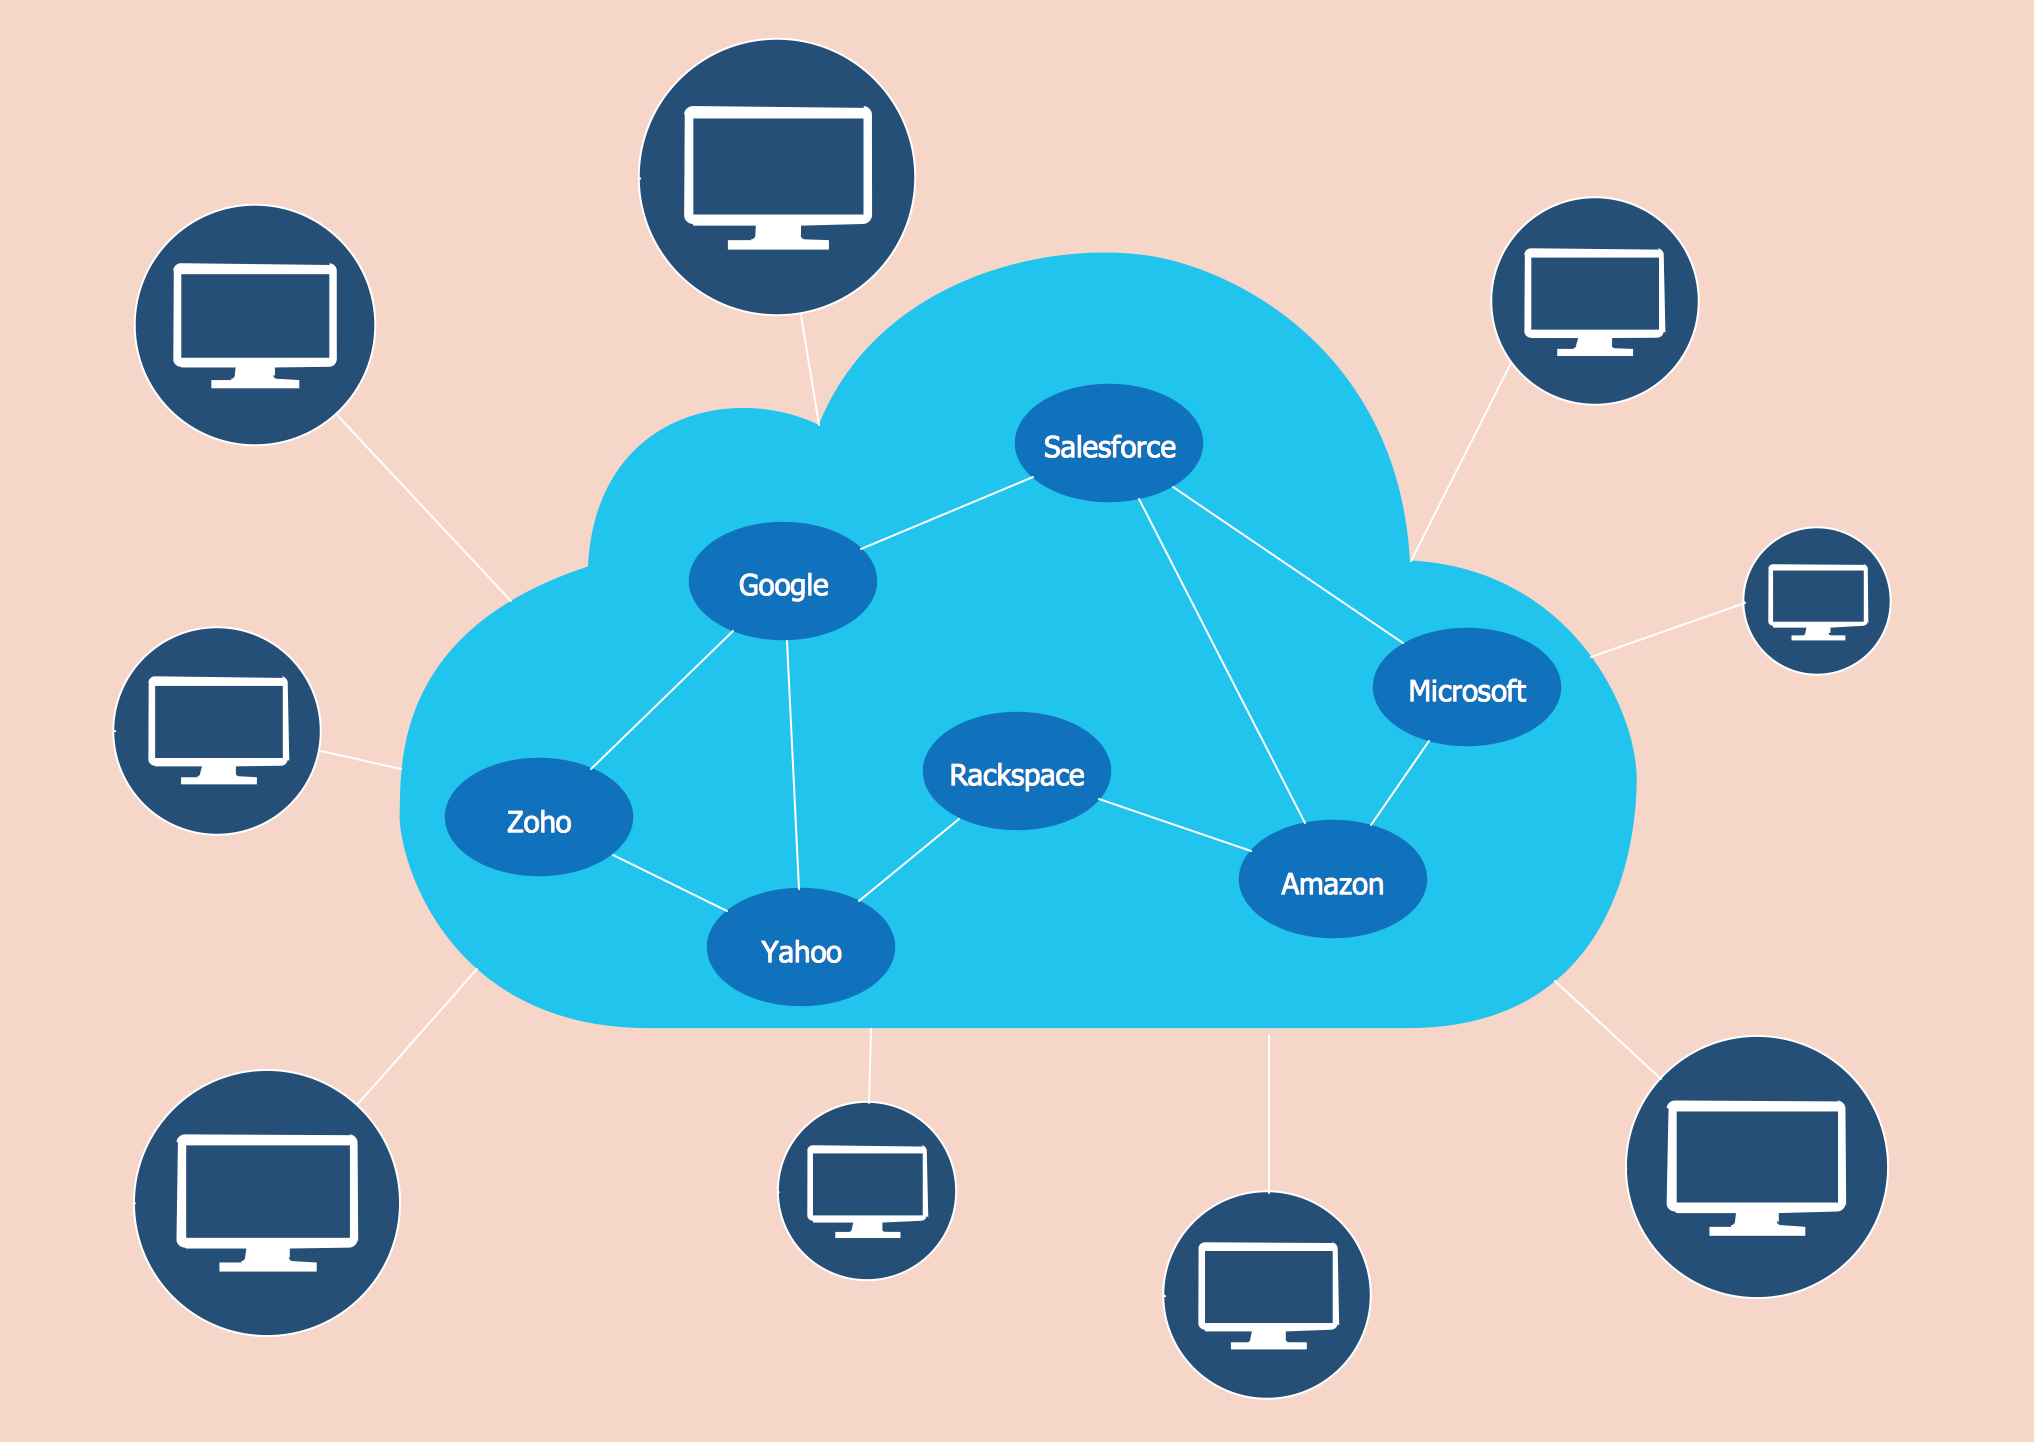
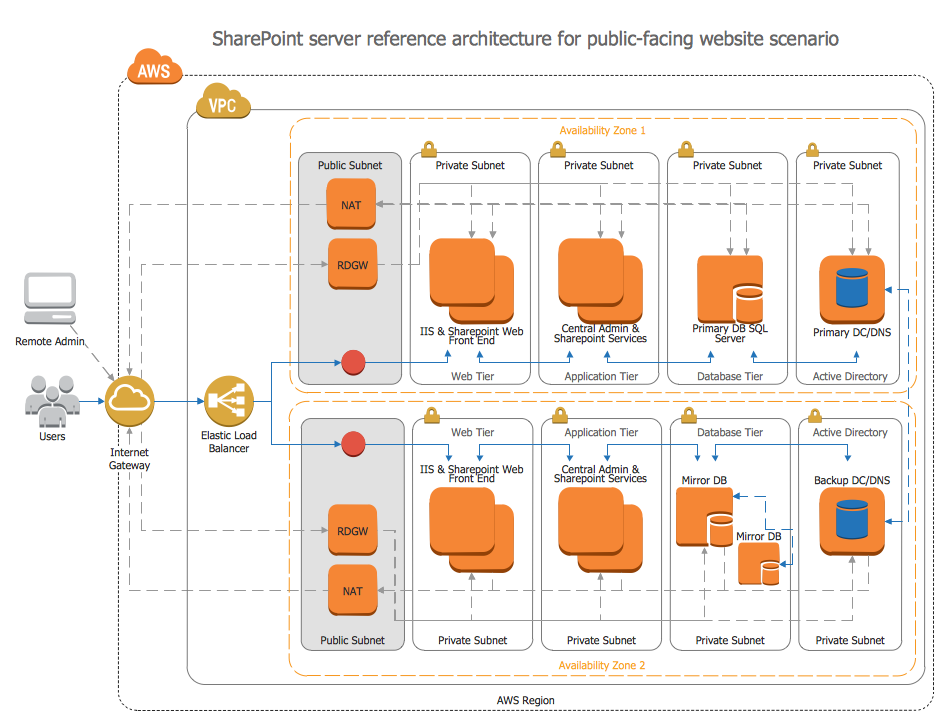
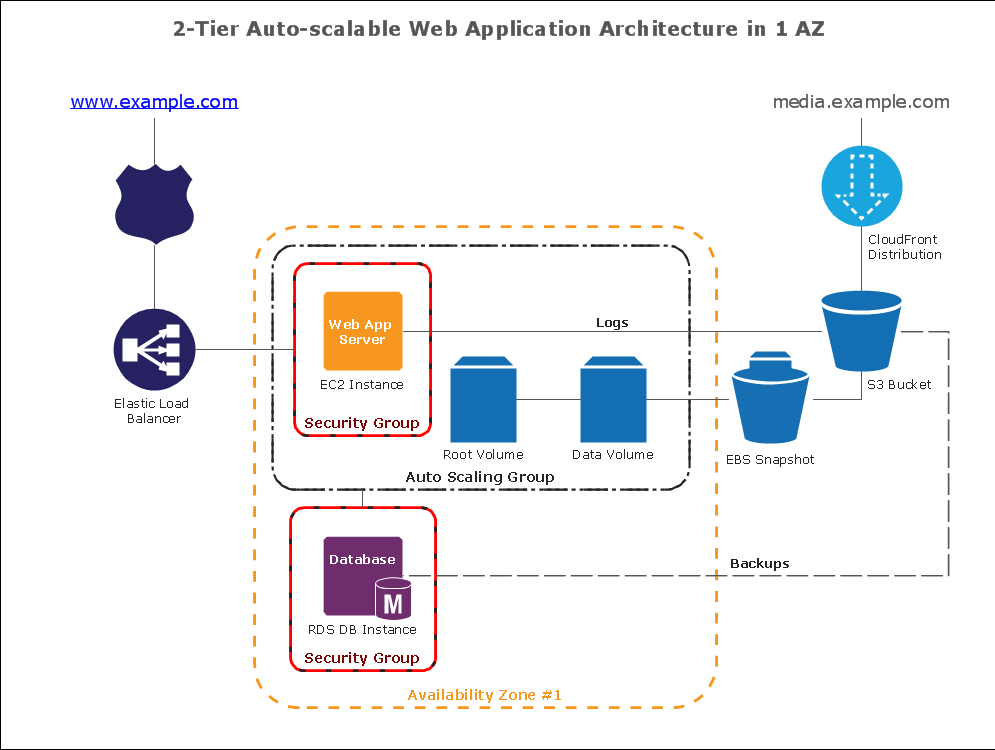
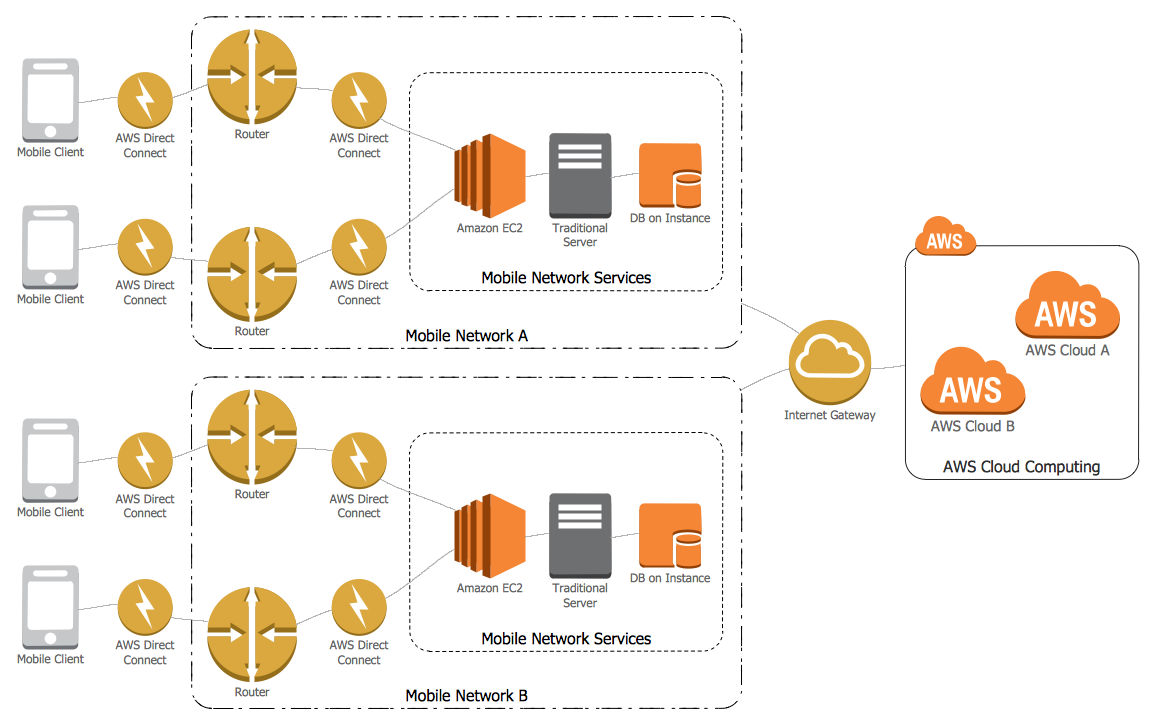
Example 1. Amazon Cloud Computing Architecture
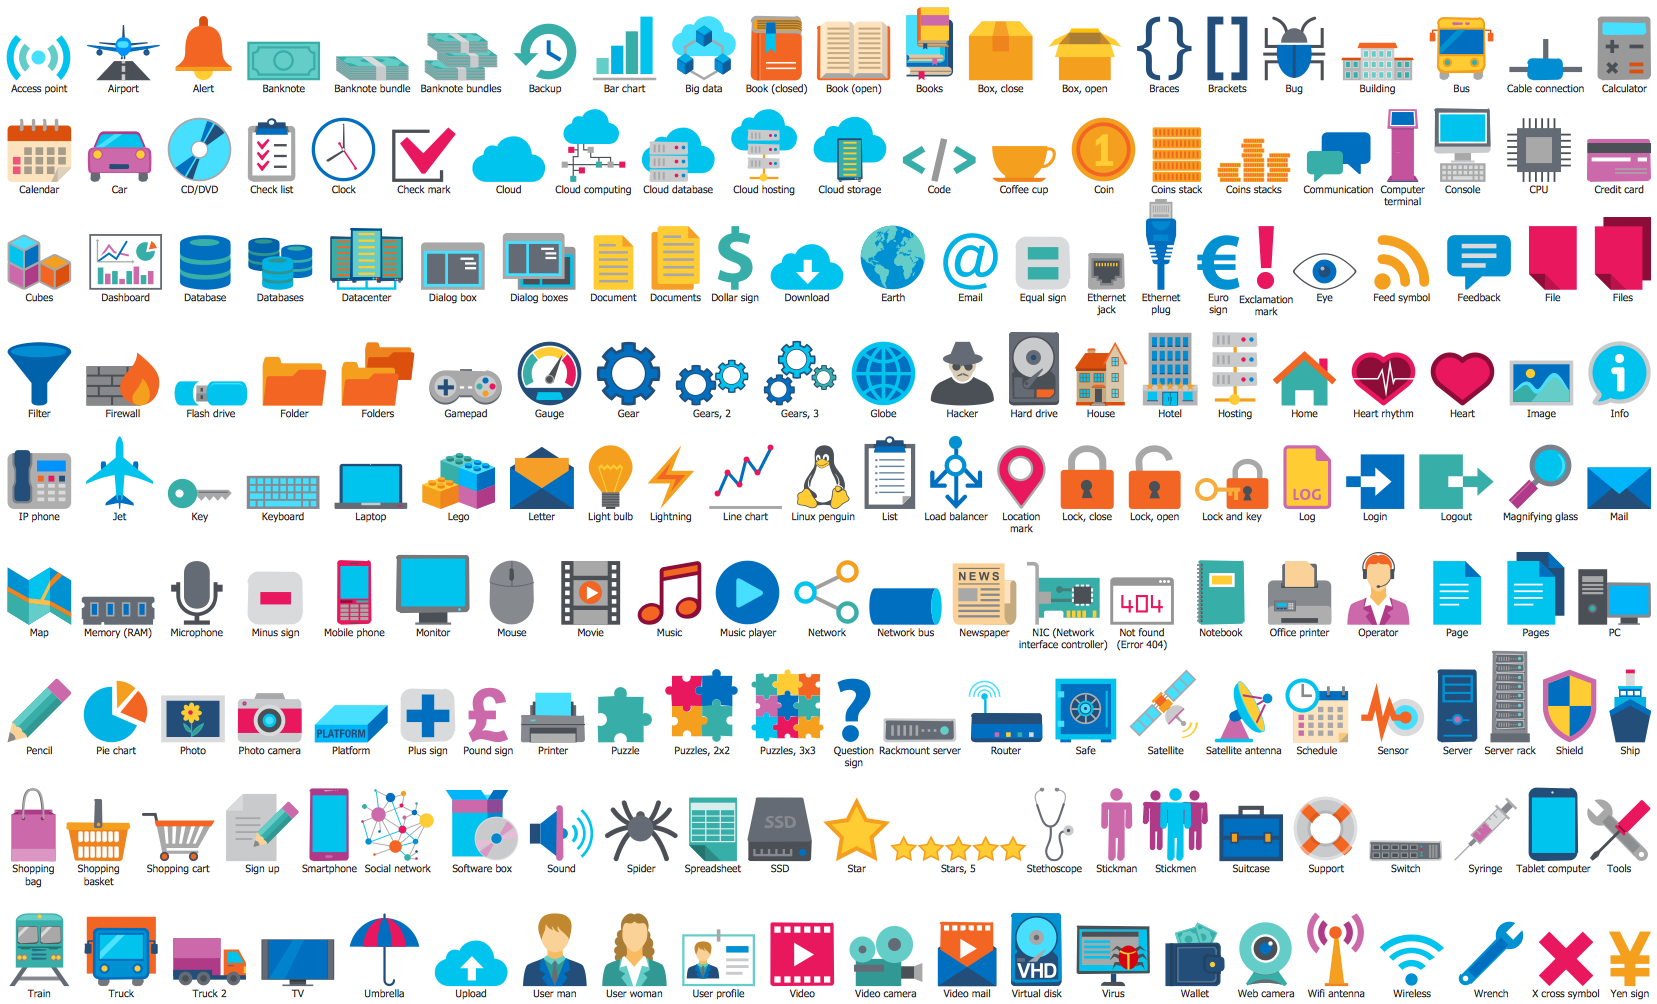
Below are represented 4 libraries of Cloud Computing Diagrams Solution which contain 492 ready-to-use vector objects which will be useful for you when designing the Amazon Cloud Computing Architecture.

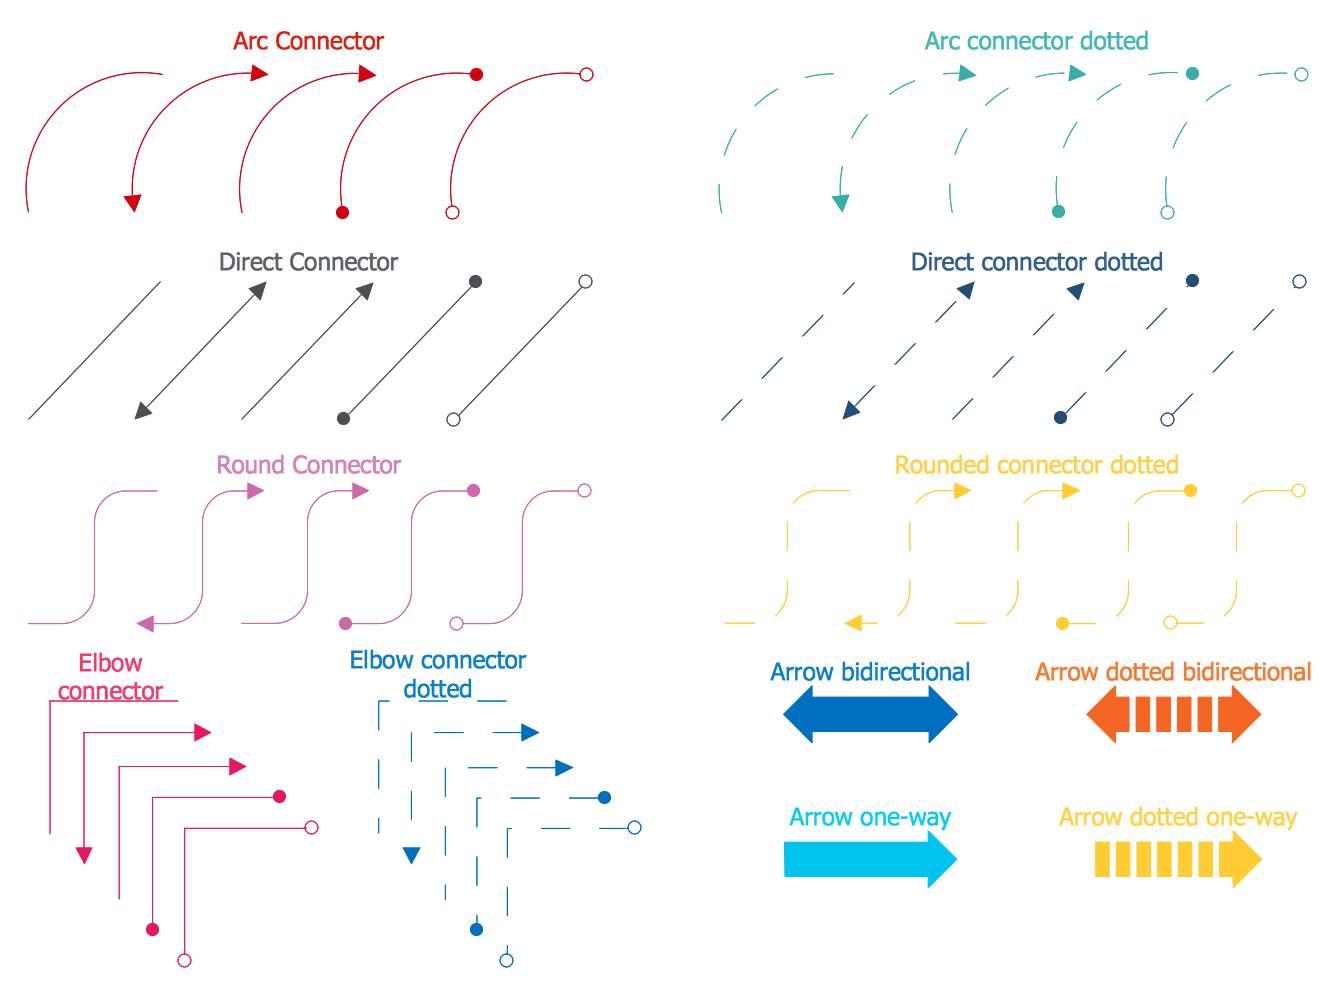
To design your own Cloud Architecture Diagram in minutes, follow the next easy steps:
- drag the required objects from the libraries of Cloud Computing Diagrams solution to your document,
- arrange the objects and connect them with ConceptDraw's Smart Connector tool or using the arrows from the Cloud Connectors library,
- type the text, add color background or other color accents to your diagram to make it attractive and successful.
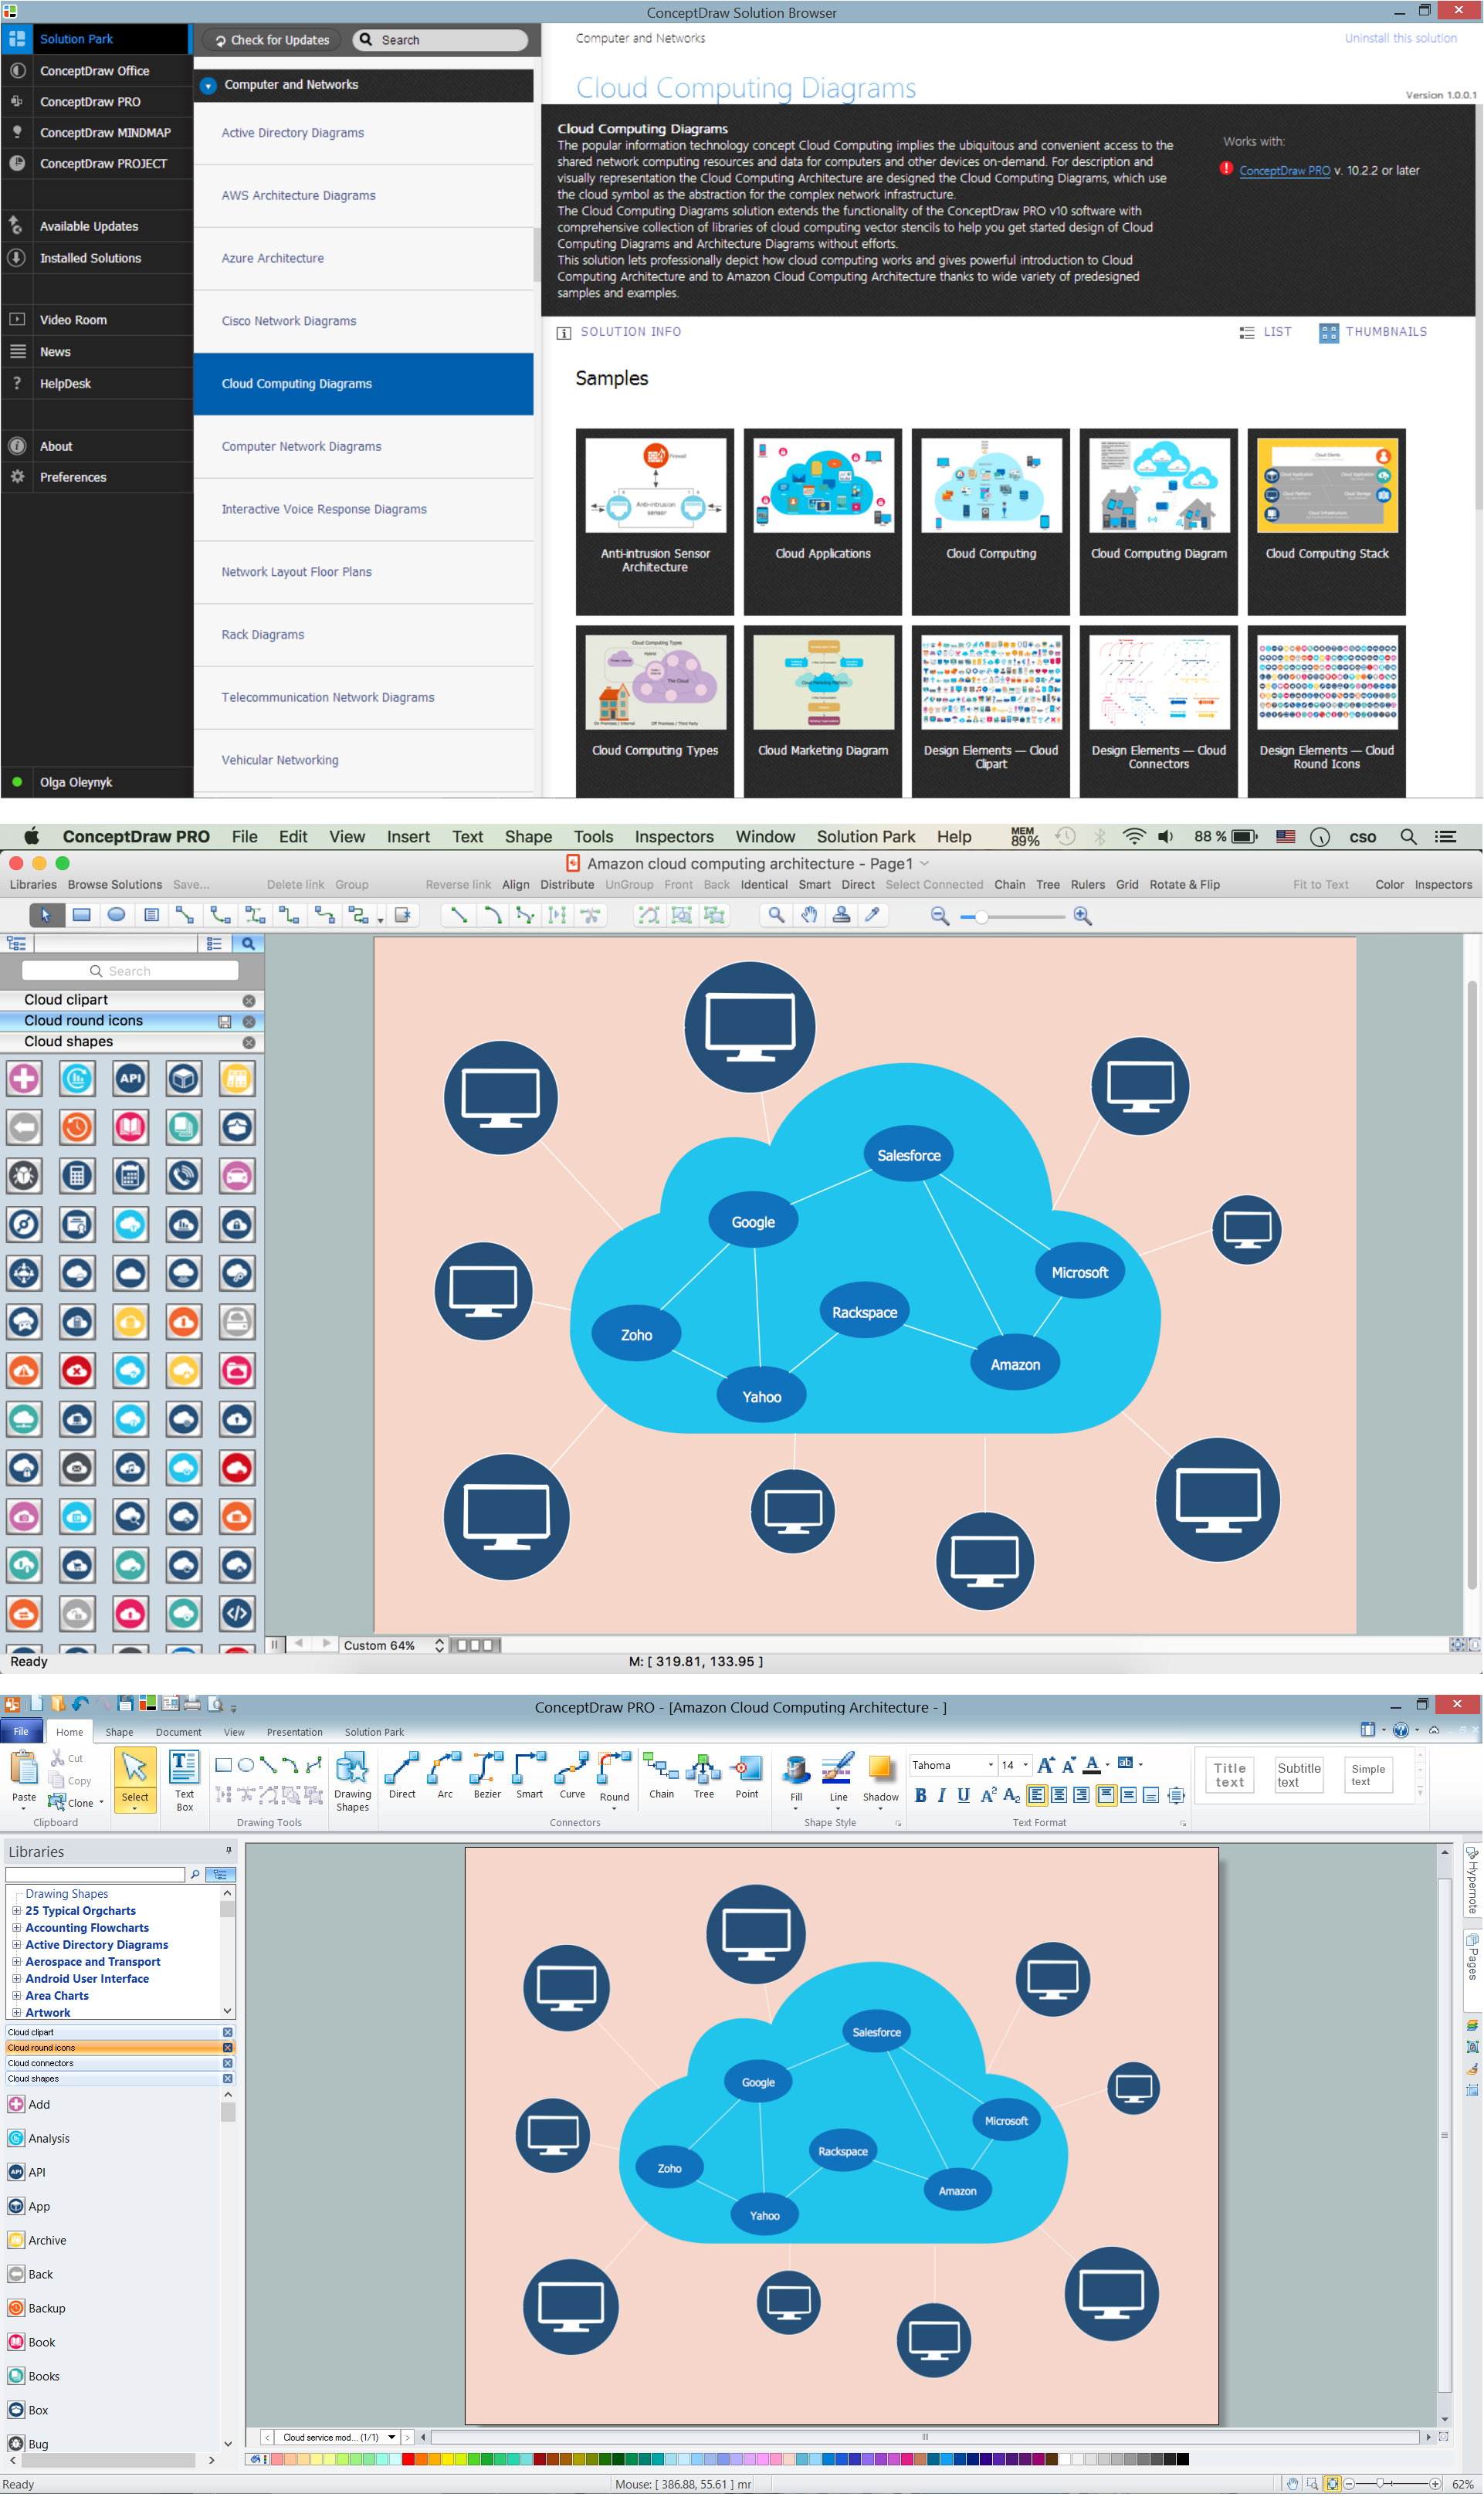
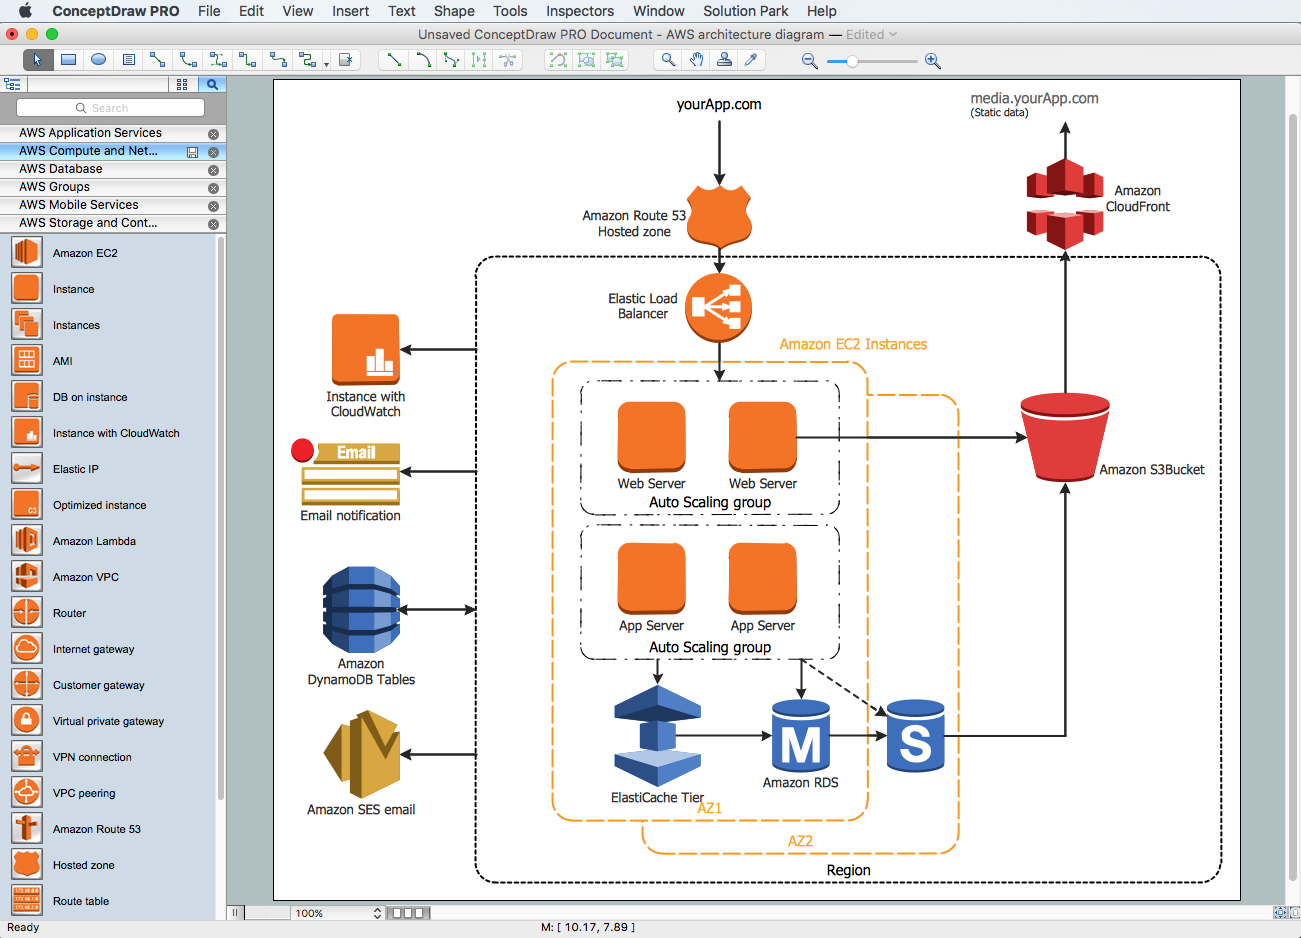
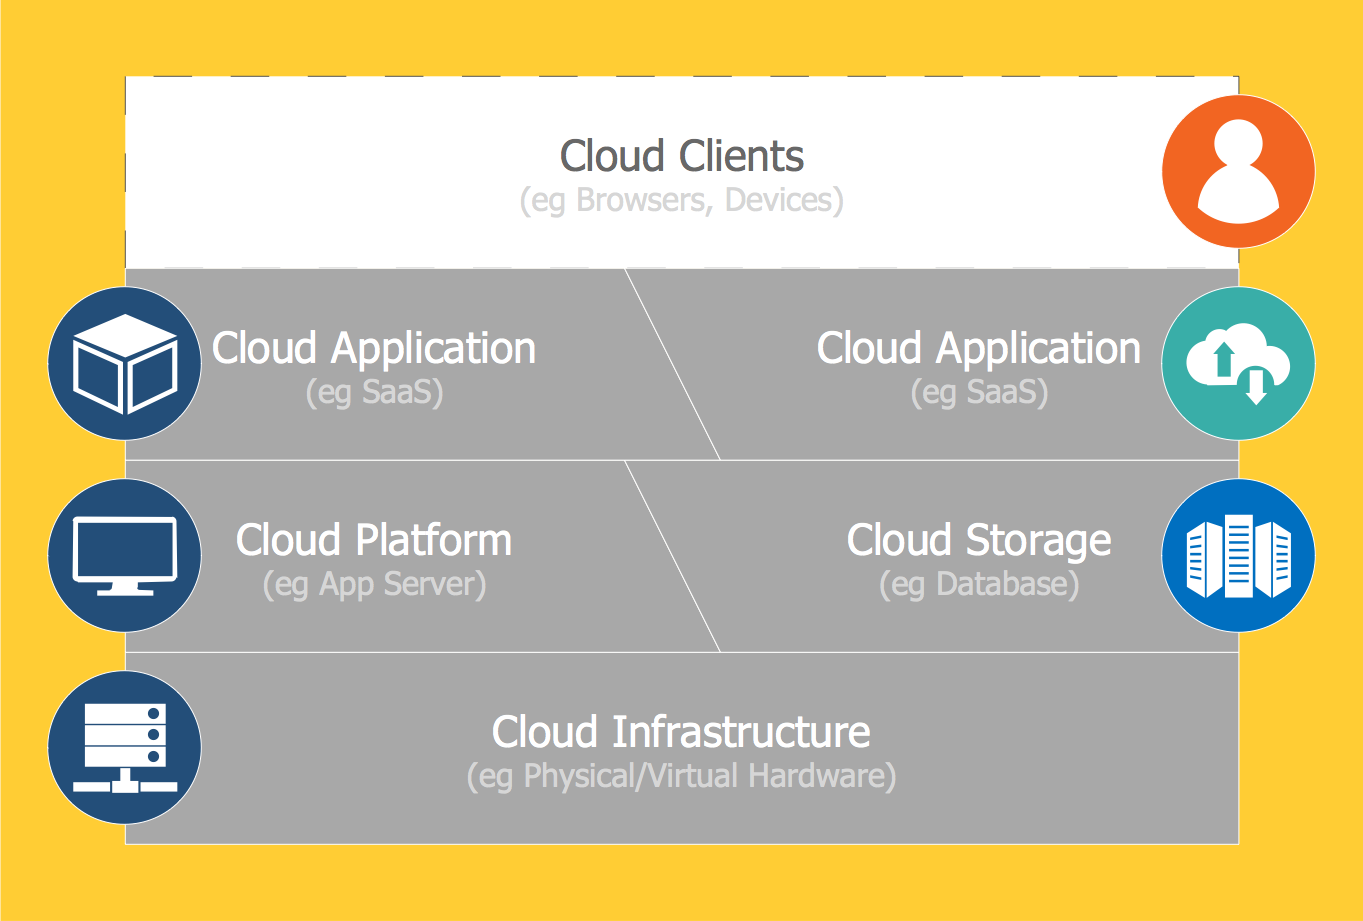
Example 2. Amazon Cloud Computing Architecture, Apple OS X and Windows
The Amazon Cloud Computing Architecture diagram you see on this page was designed in ConceptDraw DIAGRAM An experienced user spent 5 minutes creating this sample using the tools of Cloud Computing Diagrams Solution for ConceptDraw Solution Park.
Use the Cloud Computing Diagrams Solution for ConceptDraw DIAGRAM software to create your own professional looking Cloud Computing Architecture diagrams fast, easy and effective, and then successfully use them in your life and work activity.
All source documents are vector graphic documents. They are available for reviewing, modifying, or converting to a variety of formats (PDF file, MS PowerPoint, MS Visio, and many other graphic formats) from the ConceptDraw STORE. The Cloud Computing Diagrams Solution is available for all ConceptDraw DIAGRAM users.
_Win_Mac.png)