
Example 1. Cause and Effect Fishbone Diagram - Causes of Low Quality Output
Fishbone Diagrams Solution provides the extensive drawing tools, the Fishbone Diagrams library with large quantity of ready-to-use vector objects, and also collection of predesigned Fishbone, Cause and Effect,and Ishikawa Diagrams.

Example 2. Fishbone Diagrams Solution in ConceptDraw STORE
All Cause and Effect Fishbone Diagram samples are available for viewing and editing from ConceptDraw STORE. Here you can also find the template specially prepared for quick creating the Cause and Effect Fishbone diagram on its base.

Example 3. Cause and Effect Fishbone Diagram - Increase in Productivity
The samples you see on this page were created in ConceptDraw DIAGRAM using the tools of the Fishbone Diagrams Solution. An experienced user spent 10 minutes creating each of these Cause and Effect Fishbone Diagram samples.
Use the Fishbone Diagrams Solution for ConceptDraw DIAGRAM Solution Park for effective cause and effect analysis and easy Cause and Effect Fishbone Diagram creating.
All source documents are vector graphic documents. They are available for reviewing, modifying, or converting to a variety of formats (PDF file, MS PowerPoint, MS Visio, and many other graphic formats) from the ConceptDraw STORE. The Fishbone Diagrams Solution is available for all ConceptDraw DIAGRAM or later users.
TEN RELATED HOW TO's:
Cause and Effect diagram (Ishikawa diagram or Fishbone diagram) software helps you to show in one diagram the factors of Equipment, People, Process, Environment, Management and Materials, which all in general affect the overall problem and gives the base for the further analysis. ConceptDraw DIAGRAM is perfect software for designers and software developers who need to create Fishbone diagrams. You will get a simple problem-analysis tool - Fishbone software tools for design element to easy construct specific diagrams and identify many possible causes for an effect to attack complex problem solving._Win_Mac.png)
Picture: Fishbone Software Tools for Design Element
Related Solution:
Common uses of the Fishbone (Ishikawa) diagrams are product design and quality defect prevention. They are effectively used to identify potential factors causing an overall effect for making possibility to solve a problem.
To create Fishbone Diagrams, Cause-and-Effect Diagrams, Ishikawa Diagrams, we recommend to use a ConceptDraw DIAGRAM software enhanced with Fishbone Diagrams solution from the Management area of ConceptDraw Solution Park.
Picture: Create Fishbone Diagrams
Related Solution:
Interactive Voice Response (IVR) Balance Recharge Diagram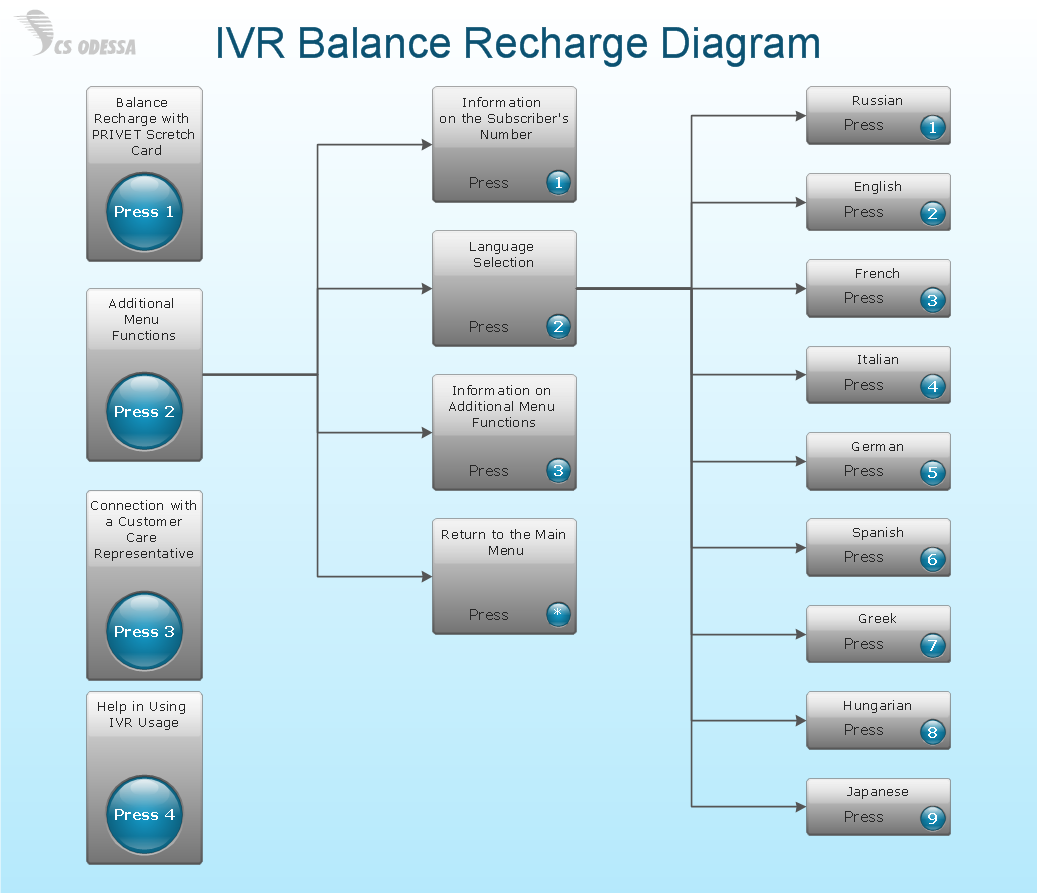
Picture: Network Diagram SoftwareIVR Balance Recharge Diagram
When you have some problems you need first to explore the reasons which caused them. Cause and Effect Analysis is a perfect way to do this. ConceptDraw DIAGRAM software enhanced with Fishbone Diagrams solution from the Management area of ConceptDraw Solution Park gives the ability to draw fast and easy Fishbone diagram that identifies many possible causes for an effect.
Picture: Cause and Effect Analysis
Related Solution:
ConceptDraw DIAGRAM software extended with Fishbone Diagrams solution from the Management area of ConceptDraw Solution Park is perfect for Cause and Effect Diagram creating. It gives the ability to draw fishbone diagram that identifies many possible causes for an effect or a problem. Causes and Effects are usually grouped into major categories to identify these sources of variation. Causes and Effects in the diagram show relationships among various factor. Fishbone diagram shows factors of Equipment, Process, People, Materials, Environment and Management, all affecting the overall problem.
Picture: Cause and Effect Diagram
Related Solution:
ConceptDraw DIAGRAM diagramming and vector drawing software enhanced with powerful HR Flowcharts Solution perfectly suits for Human Resource Management.
Picture: Human Resource Management
Related Solution:
A causal model is an abstract concept, that describes the causal mechanisms of a system, by noting certain variables and their influence on each other, in an effort to discover the cause of a certain problem or flaw. This model is presented in diagram form by using a fishbone diagram.
ConceptDraw DIAGRAM diagramming and vector drawing software enhanced with Fishbone Diagrams solution helps you create business productivity diagrams from Fishbone diagram templates and examples, that provide to start using of the graphic method for the analysis of problem causes. Each predesigned Fishbone Diagram template is ready to use and useful for instantly drawing your own Fishbone Diagram.
Picture: Fishbone Diagram Template
Related Solution:
The Project Management Triangle Diagram depicts three main constraints of any project: scope, time and cost. Projects have to comply with the specified scope, projects should be finished in time and projects need to consume the budget. Each of the constraints represents one side of the triangle, and any change in budget or timing or scope affects the entire diagram.
Picture: Pyramid Diagram
Related Solution:
While creating flowcharts and process flow diagrams, you should use special objects to define different statements, so anyone aware of flowcharts can get your scheme right. There is a short and an extended list of basic flowchart symbols and their meaning. Basic flowchart symbols include terminator objects, rectangles for describing steps of a process, diamonds representing appearing conditions and questions and parallelograms to show incoming data.
This diagram gives a general review of the standard symbols that are used when creating flowcharts and process flow diagrams. The practice of using a set of standard flowchart symbols was admitted in order to make flowcharts and other process flow diagrams created by any person properly understandable by other people. The flowchart symbols depict different kinds of actions and phases in a process. The sequence of the actions, and the relationships between them are shown by special lines and arrows. There are a large number of flowchart symbols. Which of them can be used in the particular diagram depends on its type. For instance, some symbols used in data flow diagrams usually are not used in the process flowcharts. Business process system use exactly these flowchart symbols.
Picture: Flowchart Symbols: Meaning and Examples
Related Solution:
To support you in your tasks you can use the power of ConceptDraw DIAGRAM providing
intelligent vector graphics that are useful for management diagramming and
ConceptDraw MINDMAP for key management mind maps.
Picture: Business Productivity - Management
Related Solution:

