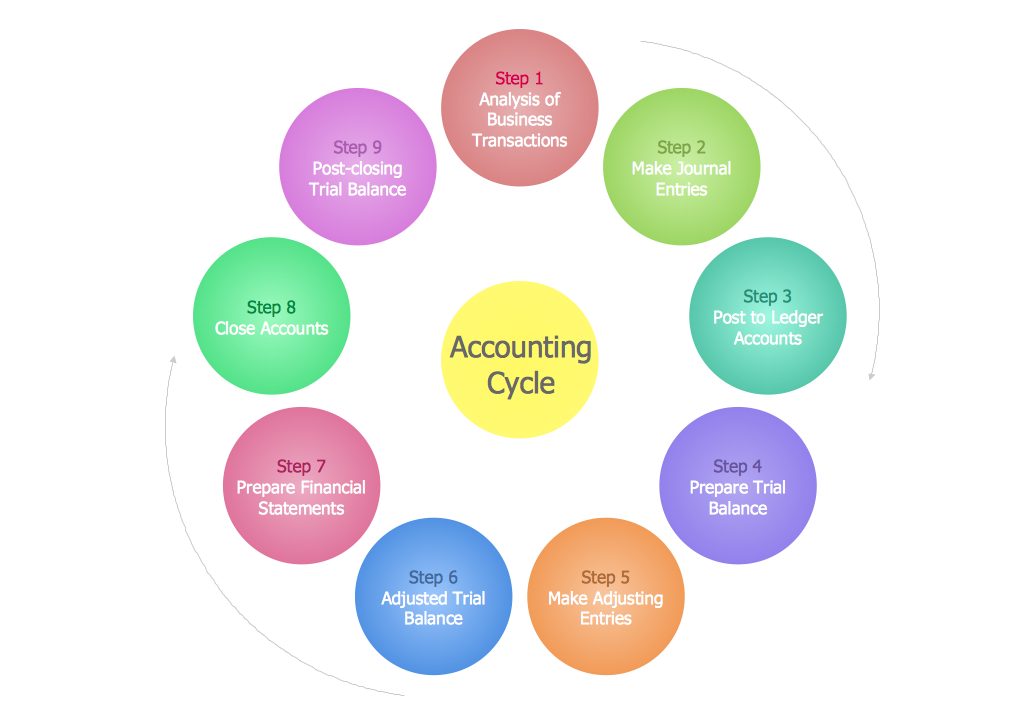
Sample 1. Steps in the Accounting Process
This diagram was created in ConceptDraw DIAGRAM and illustrates the steps in the accounting process.
ConceptDraw DIAGRAM extended with Accounting Flowcharts Solution will help you facilitate your accounting process. Accounting Flowcharts Solution contains the useful and convenient tools for easily drawing the Accounting Flowcharts.
Designing the accounting flowcharts with complex steps in the accounting process, you can use the useful technique – replace some details in a separate flowchart.

Sample 2. Accounting Flowchart – Procurement Process Mapping
This sample was created in ConceptDraw DIAGRAM using the Accounting Flowcharts library from the Accounting Flowcharts Solution and shows the accounting flowchart of the procurement process mapping. An experienced user spent 10 minutes creating this sample.
Use the ConceptDraw DIAGRAM with Accounting Flowcharts Solution to show the steps in the accounting process, the steps of accounting cycle and to create your own professional looking Accounting Flowcharts of any complexity quick and easy.
The Accounting Flowcharts produced with ConceptDraw DIAGRAM are vector graphic documents and are available for reviewing, modifying, and converting to a variety of formats (image, HTML, PDF file, MS PowerPoint Presentation, Adobe Flash or MS Visio).
TEN RELATED HOW TO's:
Use ConceptDraw DIAGRAM software with Flowcharts Solution to create Process Flow Charts, Flow Chart Process Maps, and High-Level Process Flow Charts to illustrate ✔️ high-level processes in industrial, chemical, and process engineering, ✔️ major plant processes, ✔️ minor details
Picture: Process Flow Chart
Related Solution:
This sample was created in ConceptDraw DIAGRAM diagramming and vector drawing software using the Flowcharts solution from the Diagrams area of ConceptDraw Solution Park.
This sample shows the Flowchart of the Subprime Mortgage Crisis. This Flowchart describes the decline in housing prices when the housing bubble burst and what it caused on the housing and financial markets. You can also see the Government and Industry responses in this crisis situation.
Picture: Flowchart on Bank. Flowchart Examples
Related Solution:
There are many ways to define the flow of information within a system. Structured-systems analysis method often uses data flow diagrams to show data flow, data storages and data processing visualization. These diagrams are easy to develop and quite useful.
Here is a dataflow diagram presenting an example of the manufacturing process flow. The oval process shapes represent a process that controls data within the current system. The process may produce data or make some action based on data. Data flows are represented by lines. They show the movement of information through the system. The direction of the data flow is depicted by the arrow. The external entities are shown by rectangles. They represent the external entities interacting with the system. The data store objects (unclosed rectangles) are used to show data bases participating in a process flow.
Picture: Data Flow Diagram
Related Solution:
Use ConceptDraw DIAGRAM business diagramming and business graphics software for general diagramming purposes, it inludes tousands colored professional flowchart symbols, examples and samples which saves time when you prepare documents, professional presentations or make an explanation of process flow diagram.
Picture: Flow Chart Design — How to Design a Good Flowchart
Related Solution:
Process mapping helps with sharing business results and reorganizing workflow. In almost every case, after creating a sales process flowchart the steps that are redundant become obvious for a manager. It's easy to find a flowchart examples that will help in developing one for your business.
This sales process flowchart consists of a sequence of steps that represent a simple sale process. Each step is shown graphically by a rectangle representing processing steps or an activity, or a diamond representing a decision. These rectangles are linked by arrows, that indicate the direction of the sales workflow. ConceptDraw Sales Flowcharts solution delivers a the full set of classical flowchart notation symbols, along with sales-related icons and pictograms.
Picture:
Sales Process Flowchart
Flowchart Examples
Related Solutions:
Make sure that your purchasing process complies with the standards and regulations. Common key elements of purchasing process.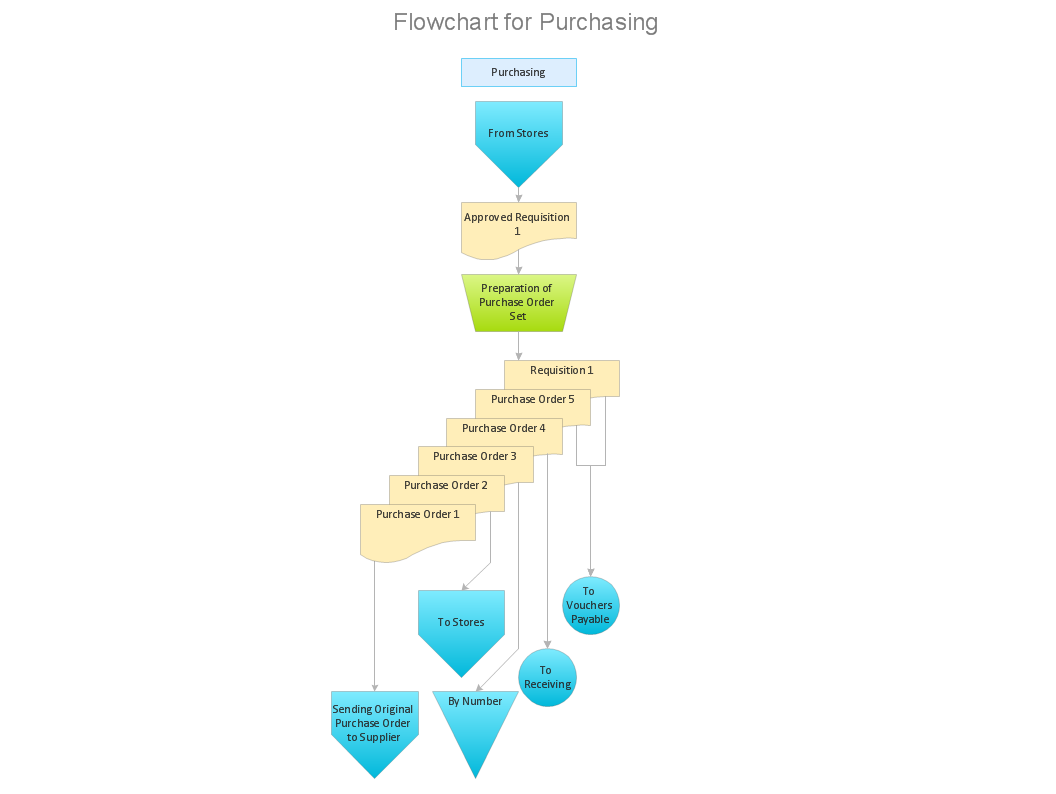
Picture: What can go wrong if the purchasing process is not followed?
Related Solution:
Steps in the Accounting Process - The Accounting Process is a sequence of organization activities that is used for gaining quantitative information about the finances. This complex process consists of a set of sequential steps.
9 steps in the accounting process: Analysis of Business Transactions, Make Journal Entries, Post to Ledger Accounts, Prepare Trial Balance, Make Adjusting Entries, Adjusted Trial Balance, Prepare Financial Statements, Close Accounts, Post-Closing Trial Balance.Picture: Steps in the Accounting Process
Related Solution:
Process Flow Chart is a visual illustration of overall flow of activities in producing a product or service. How do you make a Process Flow Chart usually? Drawing process flow charts, diagrams and maps is quite complex and lengthy process, especially if you draw free-hand. But now thanks to the ConceptDraw DIAGRAM diagramming and vector drawing software extended with Flowcharts solution from the Diagrams area of ConceptDraw Solution Park this process became simple and fast. A confirmation of this can serve many Process Flow Chart examples included in Flowcharts solution.
Picture: Process Flow Chart Examples
Related Solution:
The audit process is a definite set of steps used in a financial, operational or compliance audit. This set of steps depends of the audit services company. The auditing process usually includes three main steps: planning, fieldwork and reporting.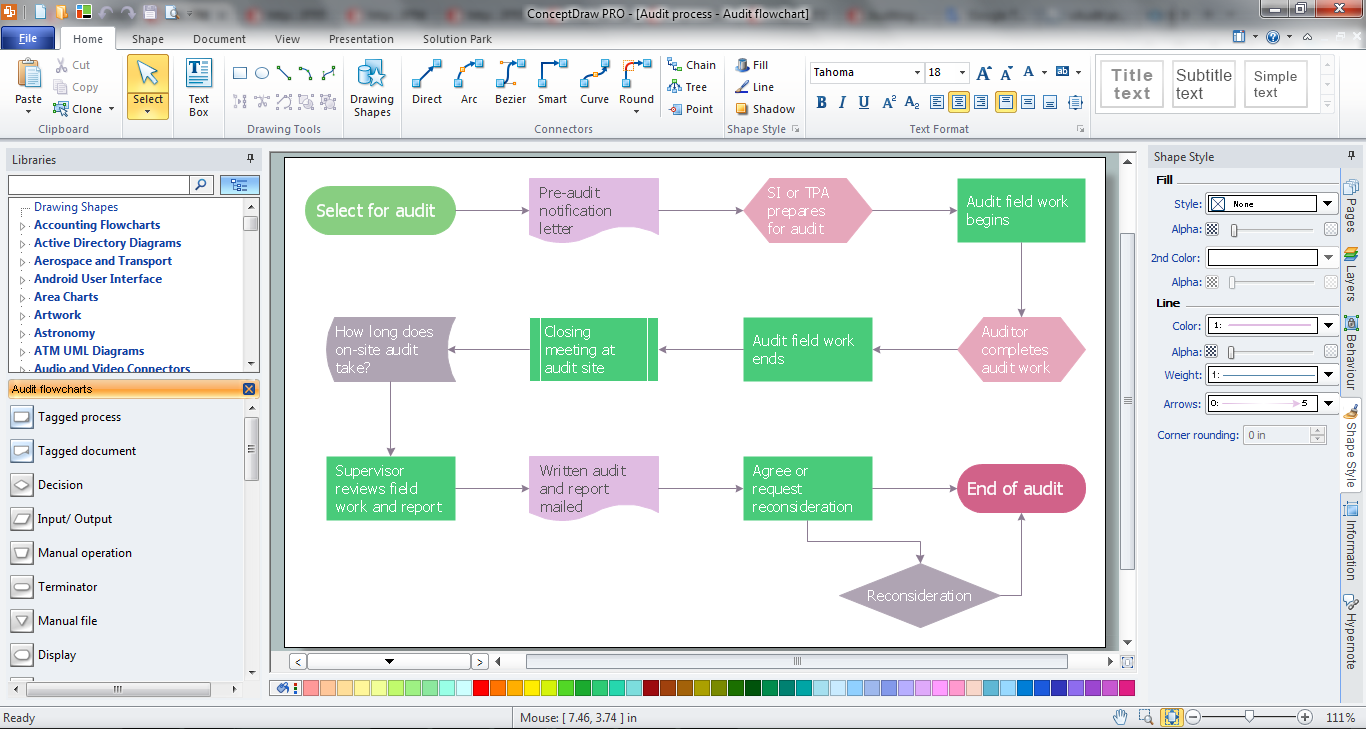
Picture: Audit Process
Related Solution:
ConceptDraw DIAGRAM extended with Interactive Voice Response Diagrams Solution from the Computer and Networks Area enables to make quick and effective drawing the IVR diagrams describing the IVR systems of any complexity quick and effective.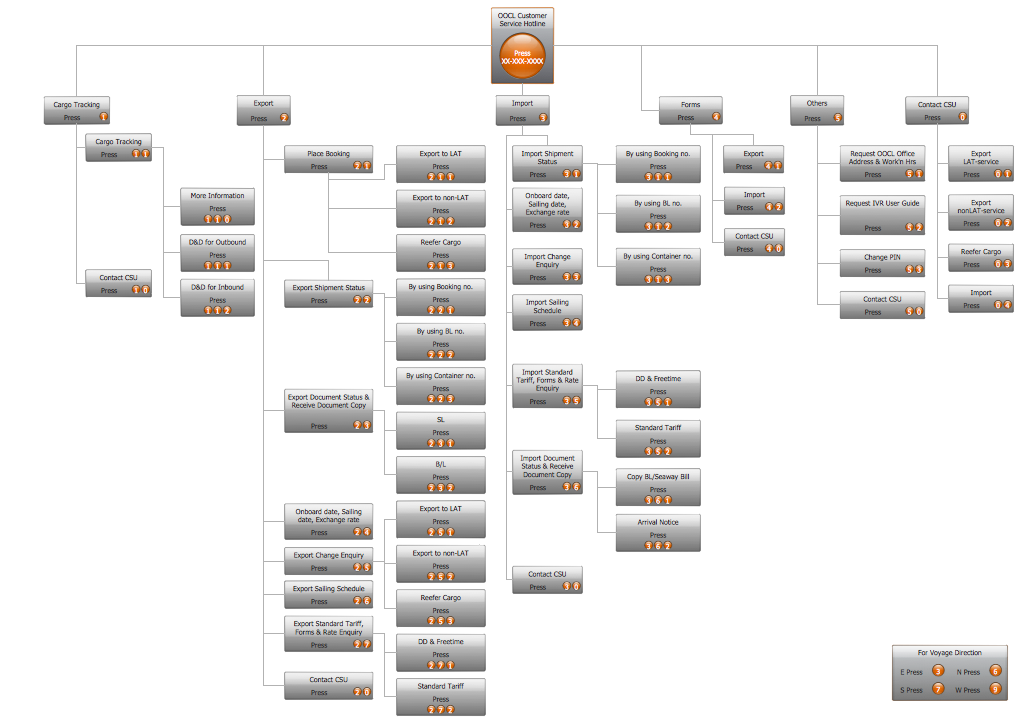
Picture: IVR Systems
Related Solution: