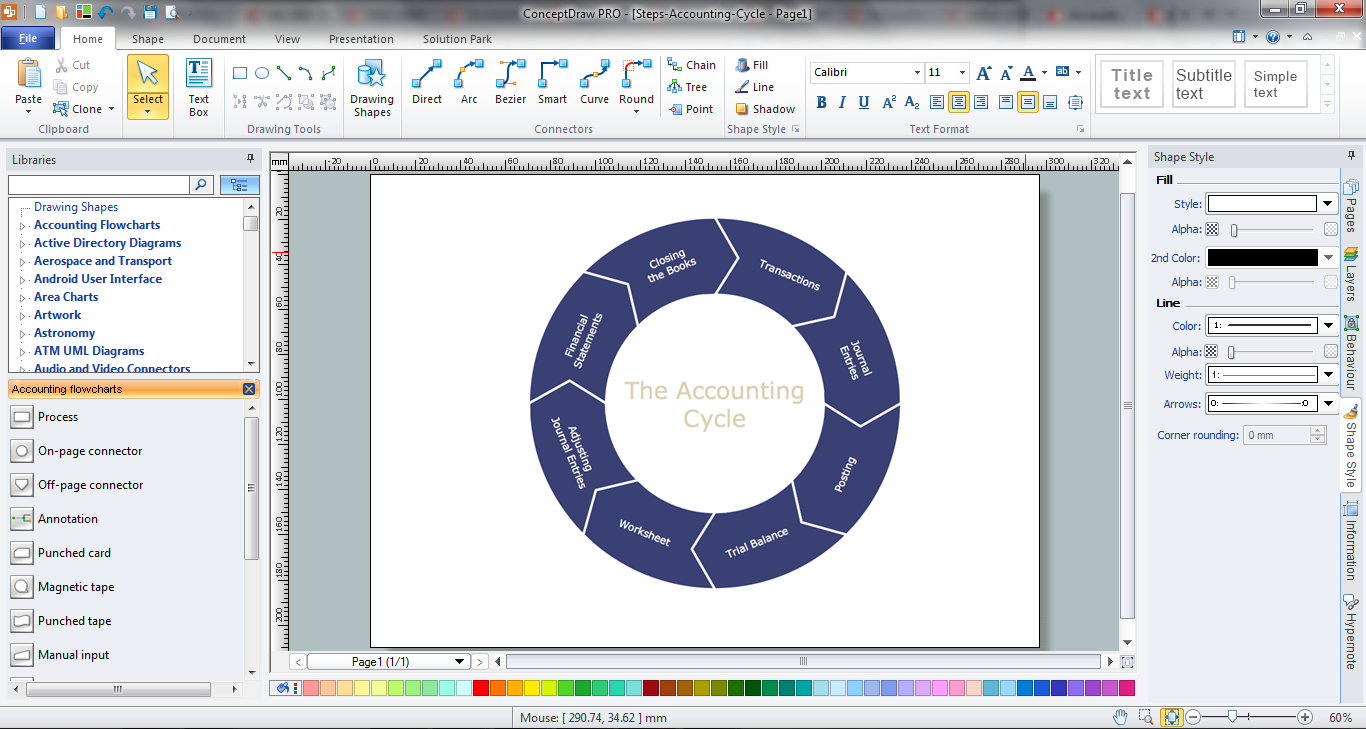
Example 1. Accounting Cycle Example in ConceptDraw DIAGRAM
Accounting Flowcharts Solution is a set of powerful tools. It includes numerous collection of predesigned vector objects grouped in Accounting Flowcharts library, accounting flowchart template and the set of useful samples and examples. All they are available for viewing and editing from ConceptDraw STORE.

Example 2. Accounting Flowcharts Solution in ConceptDraw STORE
Each accounting cycle example included in Accounting Flowcharts Solution is well thought-out sample, and can be used as is or easy modified in ConceptDraw DIAGRAM according to your needs.

Example 3. Payment Flowchart for Treasurer
Each accounting cycle example you see on this page was created in ConceptDraw DIAGRAM software using the tools of Accounting Flowcharts Solution. An experienced user spent 10 minutes creating each of these samples.
Use the Accounting Flowcharts Solution for ConceptDraw DIAGRAM software to create your own professional accounting cycle example of any complexity fast and easy.
All source documents are vector graphic documents. They are available for reviewing, modifying, or converting to a variety of formats (PDF file, MS PowerPoint, MS Visio, and many other graphic formats) from the ConceptDraw STORE. The Accounting Flowcharts Solution is available for all ConceptDraw DIAGRAM or later users.
EIGHT RELATED HOW TO's:
To describe the accounting processing use ConceptDraw Flowchart set of symbold created for Accounting data processing.
Tips, Methods and Symbols on How to Create Flowcharts for an Accounting Information System.
Picture: How Do You Make An Accounting Process Flowchart?
Related Solution:
Looking for a professional flow chart creator? Learn what a flowchart creator is, see real examples, explore symbol libraries and templates, and follow a step-by-step guide to create flowcharts in ConceptDraw DIAGRAM with the Flowcharts Solution.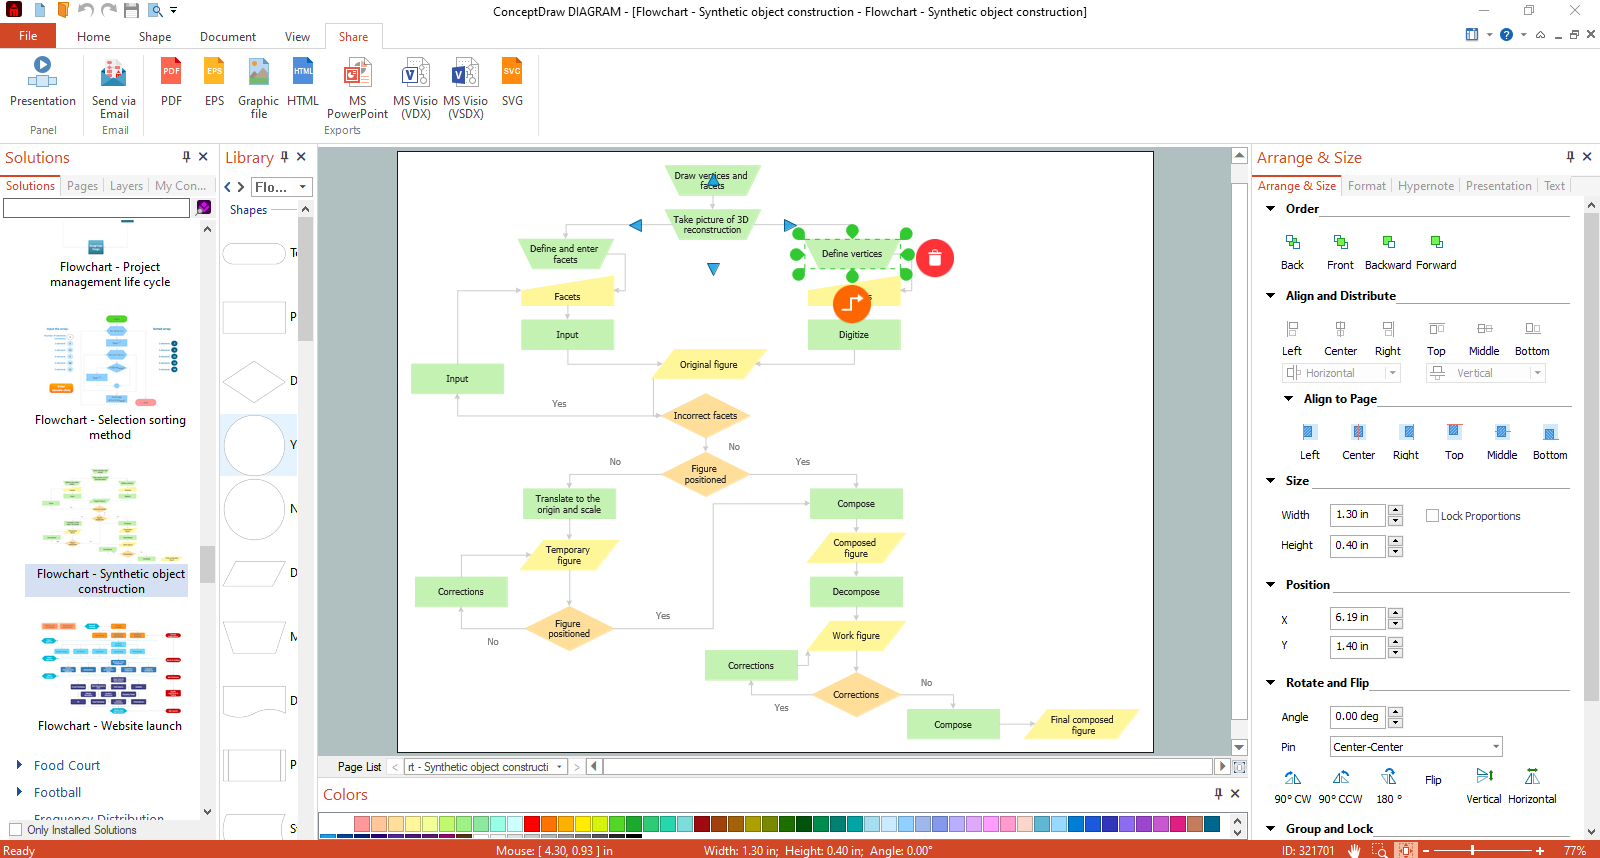
Picture: Flow Chart Creator
Related Solution:
When used in different areas, flowcharts use specific symbols to depict different elements. ConceptDraw DIAGRAM offers libraries of symbols for many areas. One of such libraries is flowchart symbols accounting, which provides symbols for accounting diagrams. Activity-based costing calculates the costs of all products and services based on activities in an organization. A type of accounting flowchart that shows how costs are assigned to products with resources and activities is called Activity-based costing (ABC) flowchart. It can be designed in a digital drawing software such as ConceptDraw DIAGRAM.
Here is an accounting flowchart template and symbols. These flowchart symbols are applied for making accounting flow charts in ConceptDraw DIAGRAM and with its Accounting Flowcharts solution. An accounting flowchart is a specific type of a flow diagram. Practically a number of flowchart-type diagrams commonly utilized to clarify many parts of an accounting department working process. Accounting flowchart assists a process of preparing accounting documentation. It shows who responsible for implementation of each step in the workflow of accounting department.
Picture:
Flowchart Symbols Accounting
Activity-based costing (ABC) flowchart
Related Solution:
The purchasing process follows very specific guidelines and includes a purchasing cycle flowchart and receiving process flow chart. Common key elements of purchasing process.
It is important to know how purchasing processes work and how each operation is done.
Picture: Purchase Process Flow Chart,Receiving Process Flow Chart,Accounting Flowchart Example.
Related Solution:
pyramida
Picture: Pyramid Diagram
Related Solution:
The Accounting flowchart shows how information flows from source documents through the accounting records. The are based on the accounting procedures or processes.
Flowcharts are used to represent accounting information in a system. There are special symbols which are used to create accounting flowcharts. Try conceptdraw flowcharting set of symbols to draw a professional charts.
Picture: Why Flowchart Important to Accounting Information System?
Related Solution:
Many people who use mind mapping software for personal organizing find ConceptDraw MINDMAP sufficiently useful mind mapping tool in their business and daily life. Especially many positive responses receive ConceptDraw MINDMAP as cross platform tool to mind maps for Macintosh and Windows.
Picture: Think and act effectively
ConceptDraw MINDMAP - an excellent tool for exporting mind maps to PowerPoint to visualize and presenting your project. You can simply generate, change, update your mindmap and then make a presentation in PowerPoint.
Picture: How To Do A Mind Map In PowerPoint
Related Solution:

