Made with
ConceptDraw
PROJECT 15

Construction Project Chart Examples

Examples for construction projects are an effective approach to start project management. Both a commercial building and residential construction is a best software to get started any project. Construction management needs a designing, task tracking, and information to the project manager. Make your project applying one of our ready-made examples. With best construction project charts, one can focus on getting own job done.

is a powerful tool for project planning and resource management. It provides a set of extensive tools that will help project managers quickly plan and easily monitor project development and resource allocation.

uses the Gantt Charts to display graphically the tasks of your project and timelines. It also allows to build project dashboards and diagrams, generate various reports and easily view the project progress.

Software

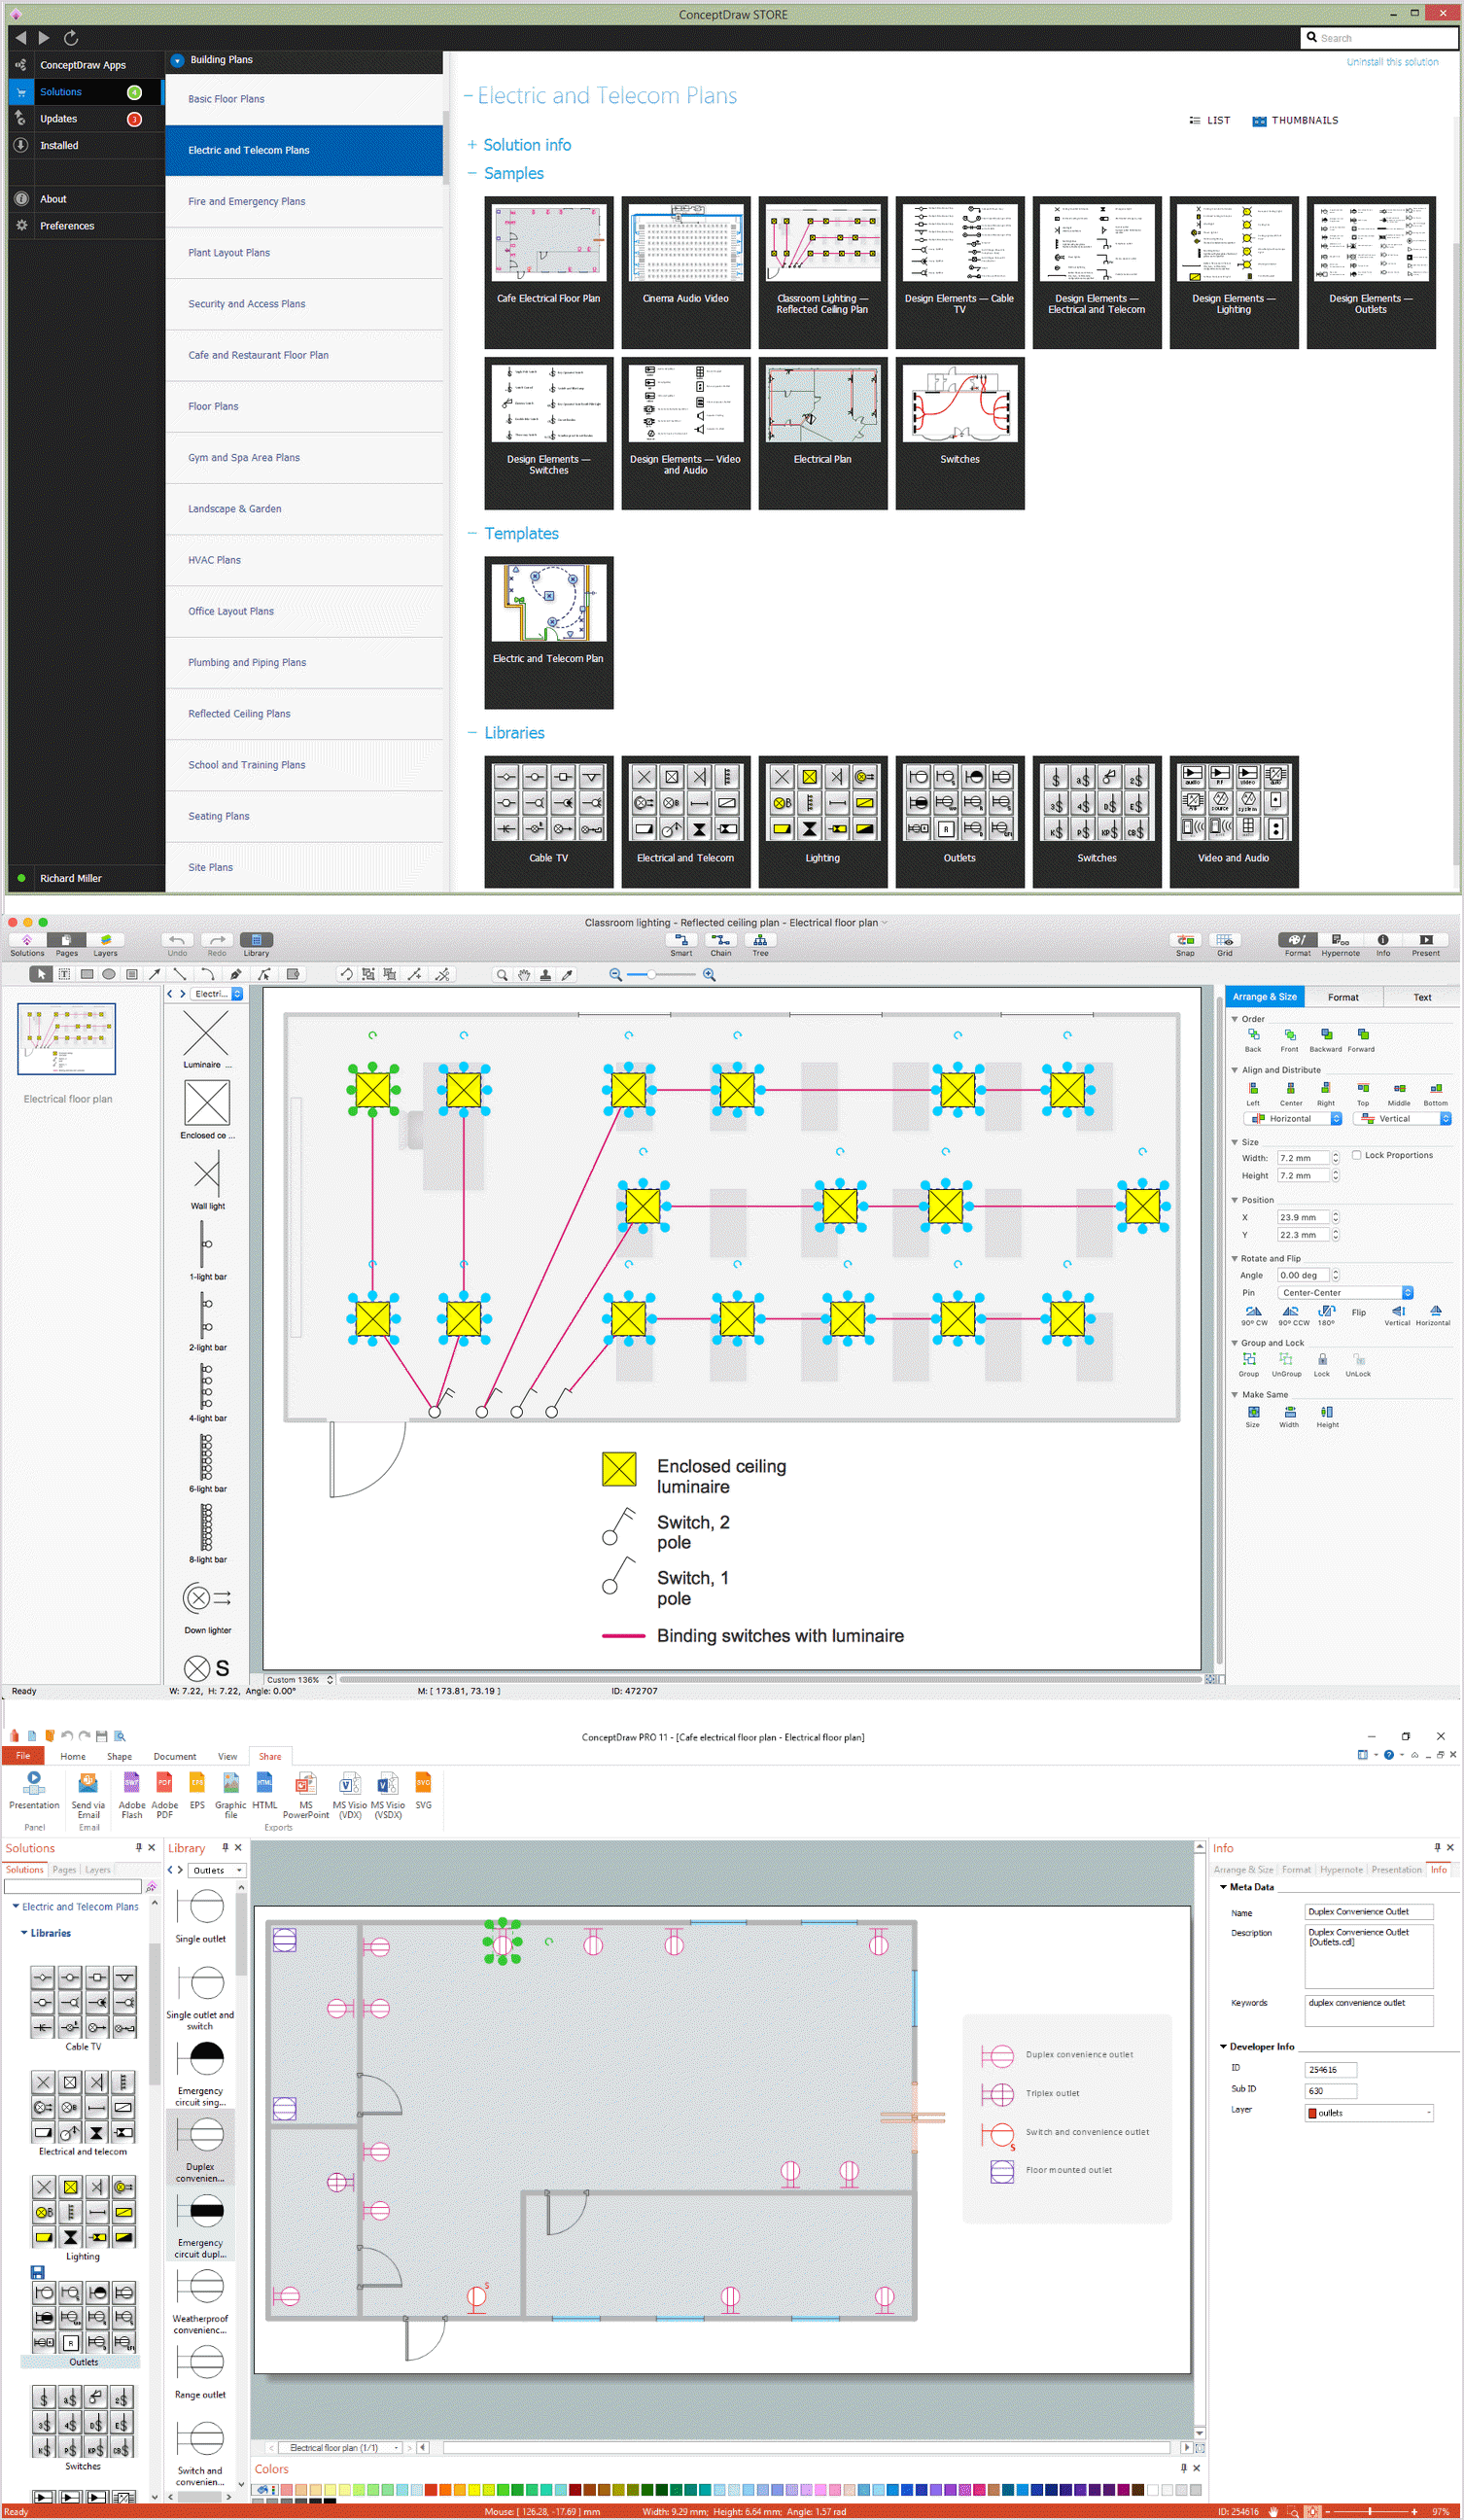
Pic 1. Software

provides a set of project management examples that are available from the program. The examples are so diverse and cover many spheres of life and activity – marketing, government, education, development, construction, aerospace, and many others.

All predesigned examples are available for change and can be used for construction your own Gantt Charts on their base.

Construction Project Chart Examples *

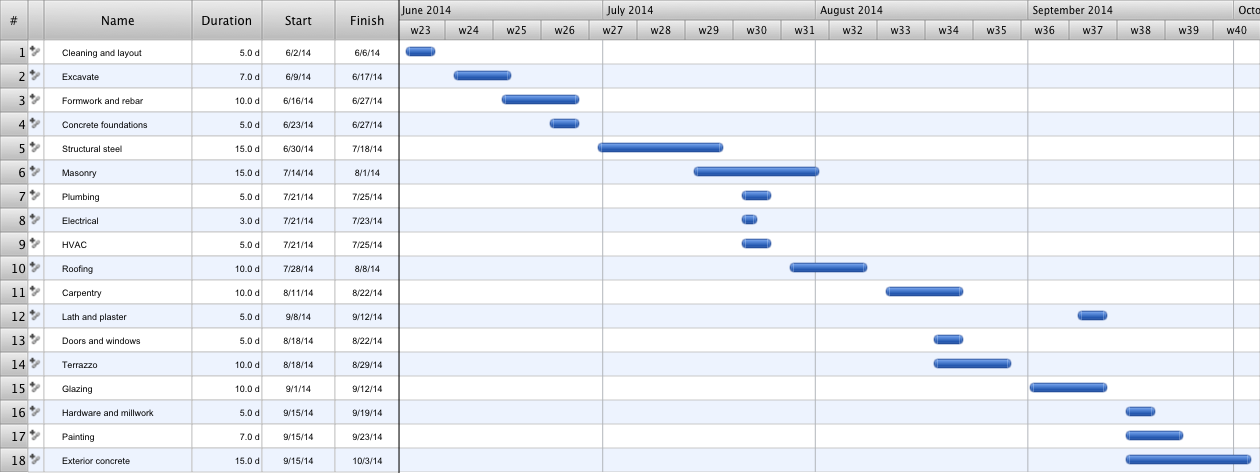
Pic 2. Construction Project Gantt Chart Example

To construct your own Gantt Chart, you need:

  • create the new project,
  • add the tasks,
  • assign resources,
  • define dependencies between the tasks,
  • add text notes and hyperlinks if needed,
  • and certainly highlight by colors the important tasks or apply the predesigned theme.

Doing these simple steps you will get the professionally looking project that you will effectively track and manage. ConceptDraw PROJECT allows you to export your project in various formats (Microsoft Project, ConceptDraw MINDMAP, Mindjet MindManager, PDF file), send to the colleagues, publish on web, present on the conferences and discussions.

Gantt Chart Example

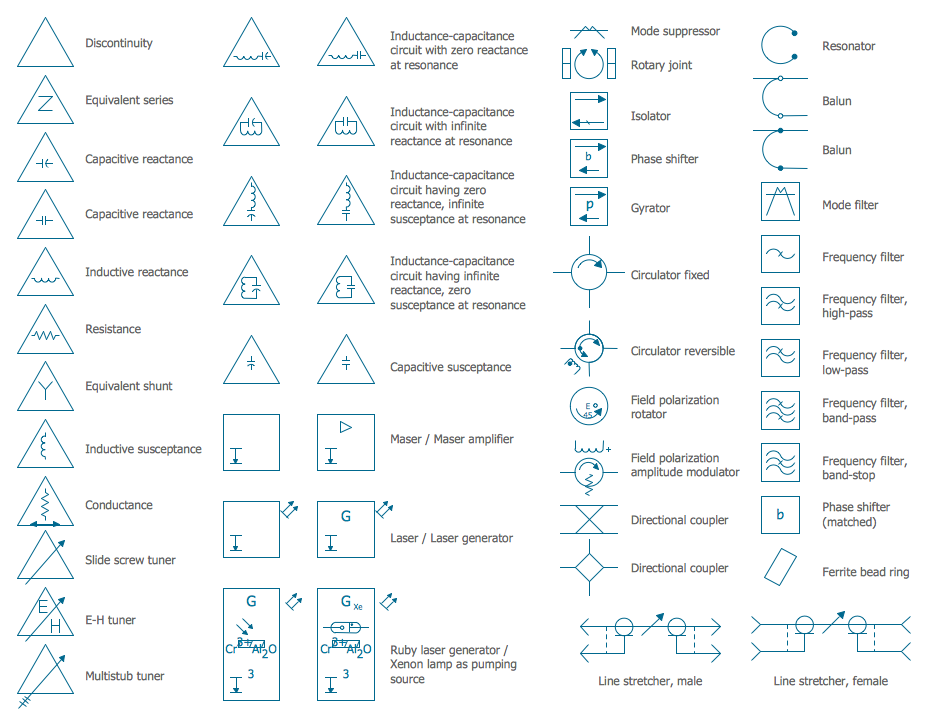
Pic 3. Gantt Chart Example

ConceptDraw PROJECT lets you also the wonderful possibility to create not only single projects, but also multiprojects.
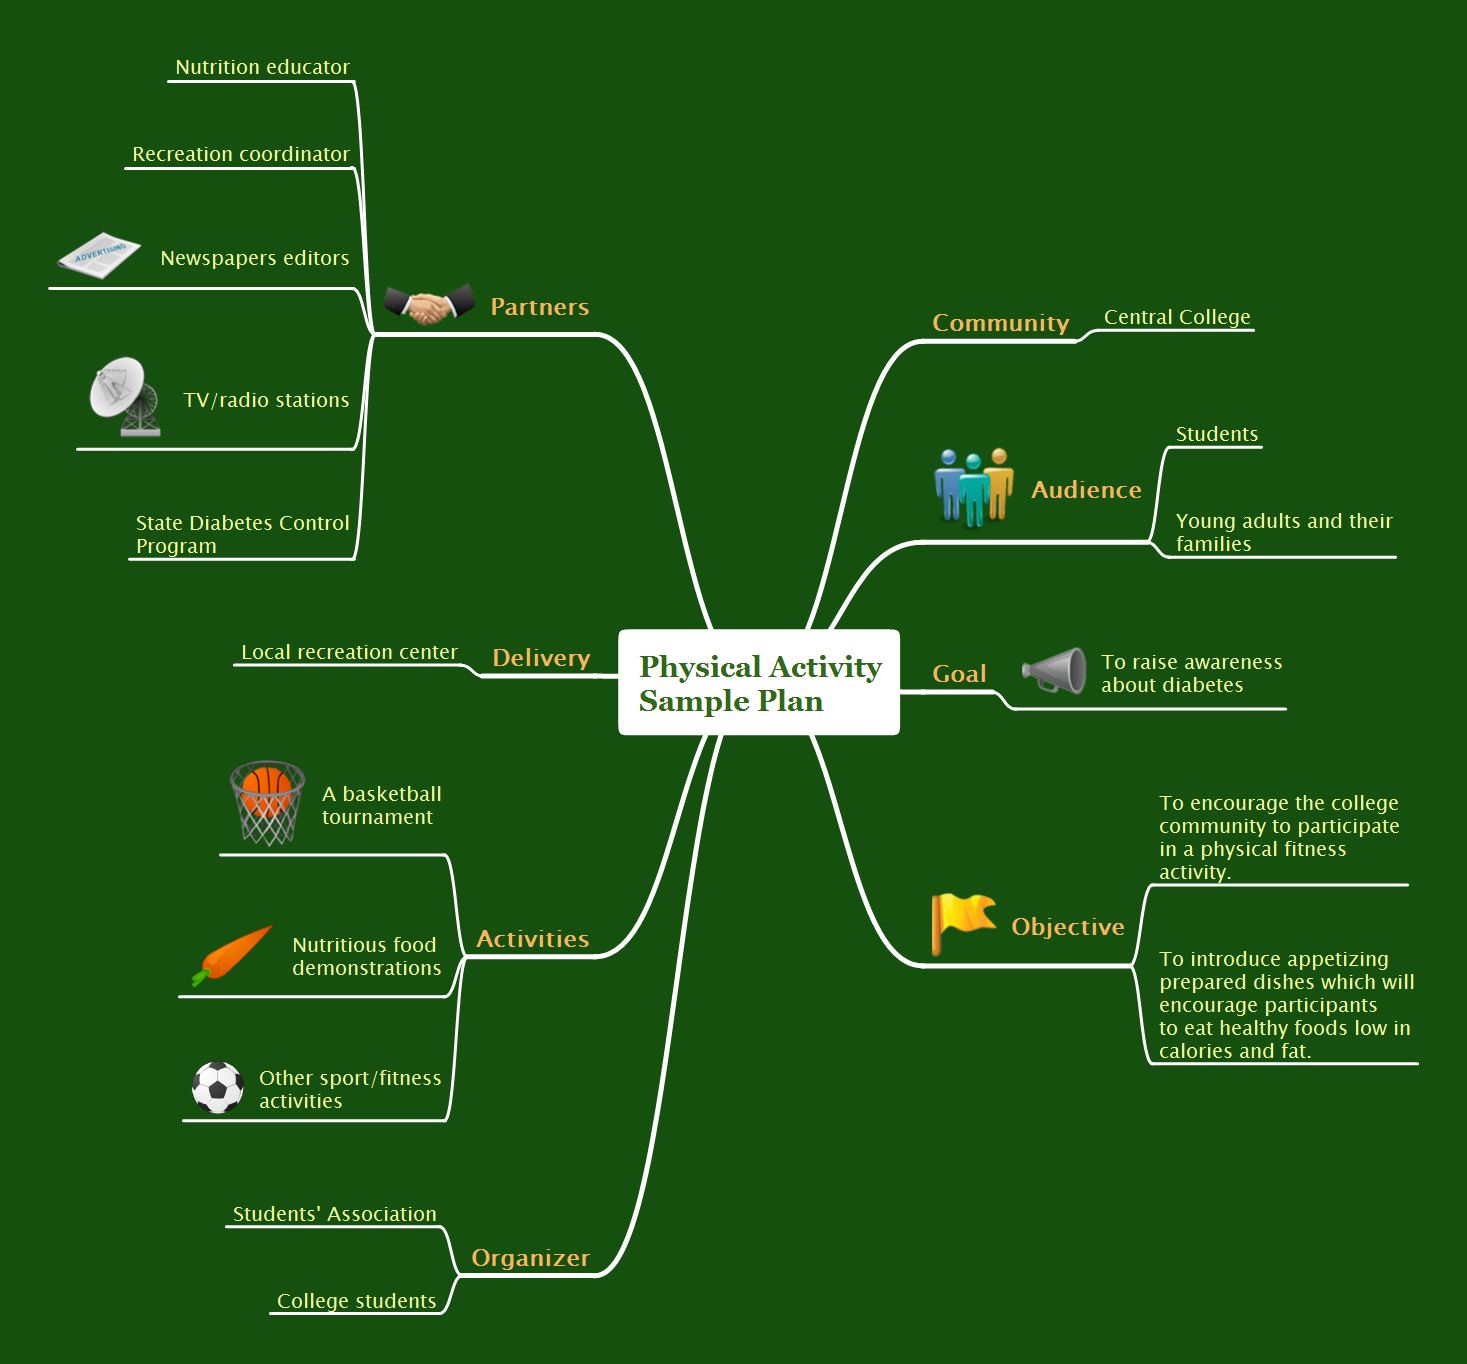


TEN RELATED HOW TO's:
There are many tools to manage a process or to illustrate an algorithm or a workflow. Flowcharting is one of those tools. However, it may be difficult to show complex processes that require multiple attributes or several people in a simple flowchart, so a cross-functional flowchart would be a solution for that situation. To create such flowchart, group processes and steps to labeled rows or columns, and divide those groups with horizontal or vertical parallel lines. It is worth mentioning that there are different types of cross-functional flowcharts, like opportunity or deployment flowchart. This diagram shows a cross-functional flowchart that was made for a trading process. It contains 14 processes, distributed through 5 lines depicting the participants who interact with the process. Also there are connectors that show the data flow of information between processes. The cross-functional flowchart displays a detailed model of the trading process, as well as all participants in the process and how they interact with each other. The lines in the flowchart indicates the position, department and role of the trading process participants.Cross-Functional Flowchart
Picture: Cross-Functional Flowchart
Related Solution:
The Accounting flowchart shows how information flows from source documents through the accounting records. The are based on the accounting procedures or processes.What process should be essentially adopted.<br>Accounting Flowchart Example *
Picture: What process should be essentially adopted.Accounting Flowchart Example
Related Solution:
An Example world map, showing a simple outline of world map. The world map is vector and can be edited or export to svg format.Geo Mapping Software Examples - World Map Outline *
Picture: Geo Mapping Software Examples - World Map Outline
Related Solution:
Building plans are usually very complicated and a hard work to do. It would be nice to use a proper drawing software to facilitate the task. Design a site plan quick and easily with all the stencils and samples from ConceptDraw libraries. This drawing shows content of the ConceptDraw vector libraries related to the site planning and arrangement of the living environment. ConceptDraw delivers about 50 libraries containing near one and a half thousands vector objects that will help you to design territory arrangement plans and make the Site plan sketches. You can use the Parking and Roads library for designing a parking space, or drawing transport management schemes. The Site Accessories library provides a number of objects, that allow you to depict various equipment of vehicle access control, street lamps, benches, trash cans and other items of the street environment.Building Drawing Software for Design Site Plan
Picture: Building Drawing Software for Design Site Plan
Related Solution:
Create value stream maps - for value stream analysis and value stream management, material and information flow mapping, using our quick start templates included with ConceptDraw.Best Value Stream Mapping mac Software *
Picture: Best Value Stream Mapping mac Software
Related Solution:
Separated into categories of Basic, Intermediate, and Advanced categories, the new instructional videos about ConceptDraw PROJECT cover a huge breadth of topics. Users new to ConceptDraw PROJECT will find the Basic lessons an essential platform for familiarizing themselves with the programs′s functions. This video lesson is the first in Basic lessons series.What Constitutes a Project? *
Picture: What Constitutes a Project?
Users new to ConceptDraw PROJECT will find the Basic lessons an essential platform for familiarizing themselves with the program′s functions. This video lesson will teach you how to set up task trees and dependencies.Project —Task Trees and Dependencies *
Picture: Project —Task Trees and Dependencies
A detailed mind map about the various elements and stages of project management.Project Management *
Picture: Project Management
Related Solution:
This sample was created in ConceptDraw DIAGRAM diagramming and vector drawing software using the UML Class Diagram library of the Rapid UML Solution from the Software Development area of ConceptDraw Solution Park. This sample shows the structure of the building and can be used by building companies, real estate agencies, at the buying / selling of the realty.UML Class Diagram Example -  Buildings and Rooms *
Picture: UML Class Diagram Example - Buildings and Rooms
Related Solution:
Historical reference about the Gantt chart.What is Gantt Chart  (historical reference) *
Picture: What is Gantt Chart (historical reference)
ConceptDraw
PROJECT 15