Steps of Accounting Cycle
The accounting cycle is a complex process that consists of a set of steps occurred in the accounting period. It is called a cycle because the accounting workflow is circular: after execution one accounting period consisting of a sequence of steps of accounting cycle, starts the next accounting period.
The steps of accounting cycle include the processes of identifying, collecting, analyzing documents, recording transactions, classifying, summarizing, posting, and preparing trial balance, making journal entries, closing the books and final reporting financial information of an organization.

Sample 1. Steps of Accounting Cycle
The execution of the eight basic steps of accounting cycle leads to success work of your organization.
ConceptDraw DIAGRAM diagramming and vector drawing software extended with Accounting Flowcharts Solution provides the Accounting Flowcharts library with predesigned vector shapes, variety of templates and samples to help you easily show the steps of accounting cycle and quickly design the accounting flowcharts.
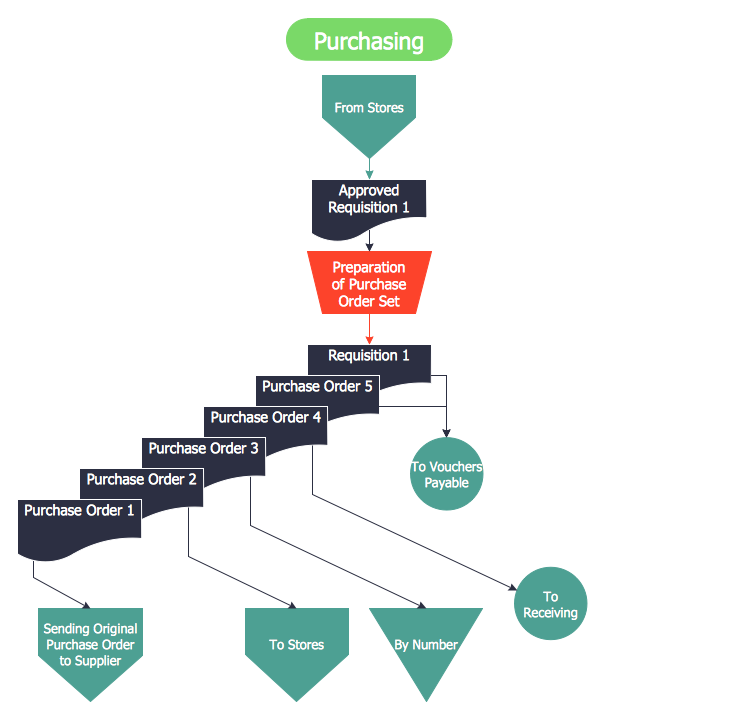
Sample 2. Accounting Flowcharts – Purchasing Flowchart
This sample was created in ConceptDraw DIAGRAM using the Accounting Flowcharts library from the Accounting Flowcharts Solution and shows the purchasing process flow. An experienced user spent 10 minutes creating this sample.
Use the ConceptDraw DIAGRAM with Accounting Flowcharts Solution to create your own professional Accounting Flowcharts of any complexity quick and easy.
The Accounting Flowcharts produced with ConceptDraw DIAGRAM are vector graphic documents and are available for reviewing, modifying, and converting to a variety of formats (image, HTML, PDF file, MS PowerPoint Presentation, Adobe Flash or MS Visio).
TEN RELATED HOW TO's:
ConceptDraw RapidDraw technology is a simple point-and-click design that helps create professional, presentation-ready business process diagrams quickly and efficiently.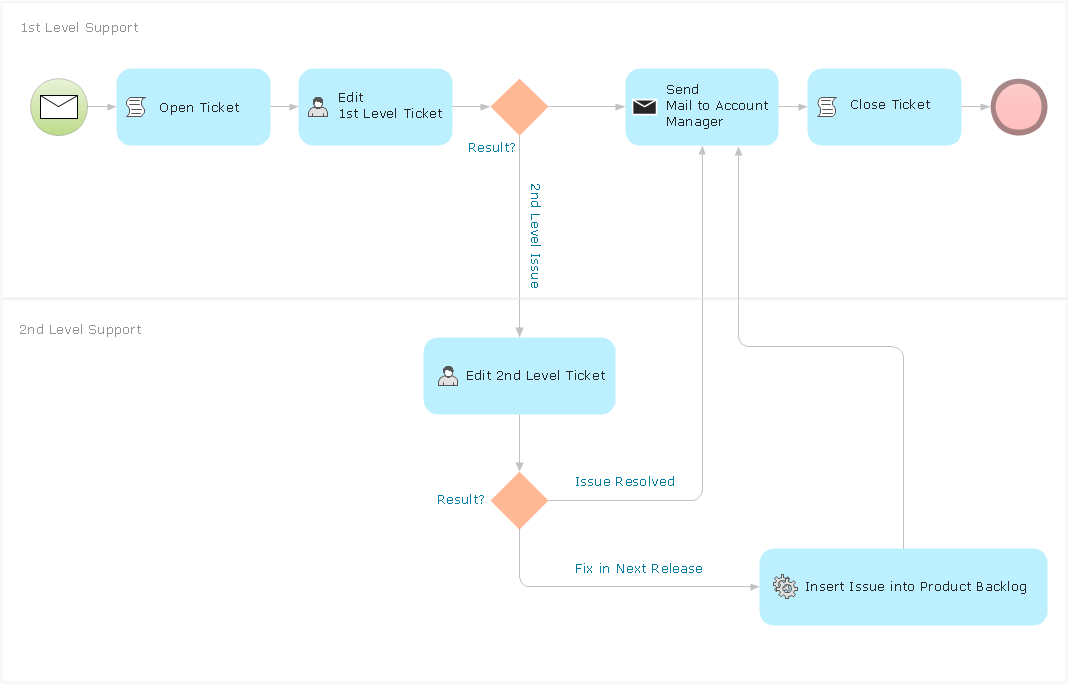
Picture: Business Process Management
Accounting Data Flow from the Accounting Flowcharts Solution visually describes the financial accounting process, shows the accumulated information about transactions and events for creating the balance sheet and the final income statement.
Accounting Flowcharts Solution contains also a wide variety of templates and samples that you can use as the base for your own Accounting Flowcharts of any complexity.
Picture: Accounting Data Flow from the Accounting Flowcharts Solution
Related Solution:
A flowchart is a simple but very functional tool when it comes to understanding a workflow or to removing unnecessary stages from a process. When drawing flowcharts, keep in mind that there are four common types of flowcharts, like document flowcharts and data flowcharts that show control over a data or document flow over a system. To show controls on a physical level, use system flowcharts. In addition, to show controls in a program, you can draw a program flowchart.
This flowchart diagram represents the piece of an article editing process, that involves the author and editor. It was created using the Basic Flowchart notation that consists from the basic flowchart symbols. The start and the end of the process are indicated with "Terminator" symbols. The "Process" symbols show the action steps consisting from making edits and searching for a compromise, when the author does not agree with the suggestions of the editor. The "Process" symbol is the general symbol in process flowcharts. The "Decision" symbol indicates a branching in the process flow. There are two branches indicated by a Decision shape in the current flowchart (Yes/No, Disagree/Agree). This basic flowchart can be used as a repeating unit in the workflow diagram describing the working process of some editorial office.
Picture: Types of Flowcharts
Related Solution:
Electrical rotating machines, such as motors and generators, are vital assets for any power plant or large industrial company.
An electric motor is an electrical machine that converts electrical energy into mechanical energy. The reverse of this would be the conversion of mechanical energy into electrical energy and is done by an electric generator.
In normal motoring mode, most electric motors operate through the interaction between an electric motor's magnetic field and winding currents to generate force within the motor. In certain applications, such as in the transportation industry with traction motors, electric motors can operate in both motoring and generating or braking modes to also produce electrical energy from mechanical energy.
26 libraries of the Electrical Engineering Solution of ConceptDraw DIAGRAM make your electrical diagramming simple, efficient, and effective. You can simply and quickly drop the ready-to-use objects from libraries into your document to create the electrical diagram.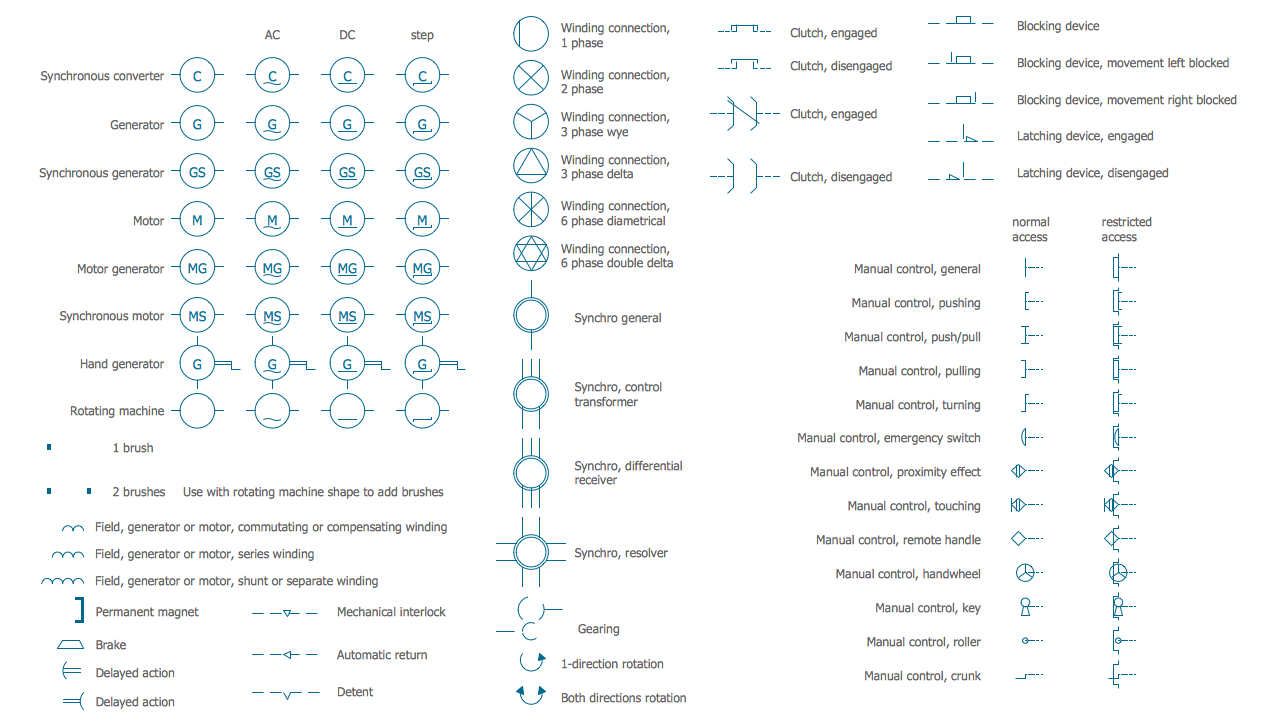
Picture: Electrical Symbols — Rotating Equipment
Related Solution:
What is organizational charts and why your business need them? How to use business process diagram software? Explore how advanced organization chart software transforms the way companies ✔️ visualize, ✔️ communicate, and ✔️ streamline their organizational hierarchies
Picture:
What is an Organizational Chart and how it works?
Organization Chart Software
Related Solution:
This sample was created in ConceptDraw DIAGRAM diagramming and vector drawing software using the Flowcharts solution from the Diagrams area of ConceptDraw Solution Park.
This sample shows the Flowchart of the Subprime Mortgage Crisis. This Flowchart describes the decline in housing prices when the housing bubble burst and what it caused on the housing and financial markets. You can also see the Government and Industry responses in this crisis situation.
Picture: Flowchart on Bank. Flowchart Examples
Related Solution:
The purchasing process follows very specific guidelines and includes an purchasing cycle flowchart. Common key elements of purchasing process.
Picture: How well does Your Purchase Process Flow?
Related Solution:
The Process Flowchart or Process Flowchart Diagram (PFD) is a visual representation relations between major parts of the system, the steps in a process, and even connections between various systems. The possibility to easy create professional-looking and attractive Process Flowcharts, Business Process Diagrams and Maps which visualize the steps of complex processes is provided by Business Process Diagram Solution from the Business Processes Area of ConceptDraw Solution Park and 16 libraries with 230 process flowchart symbols from BPMN 1.2 and BPMN 2.0.
Picture: Process Flowchart Symbols
Related Solution:
What is Purchasing Process and How to Meet The Standards. Common key elements of purchasing process representation.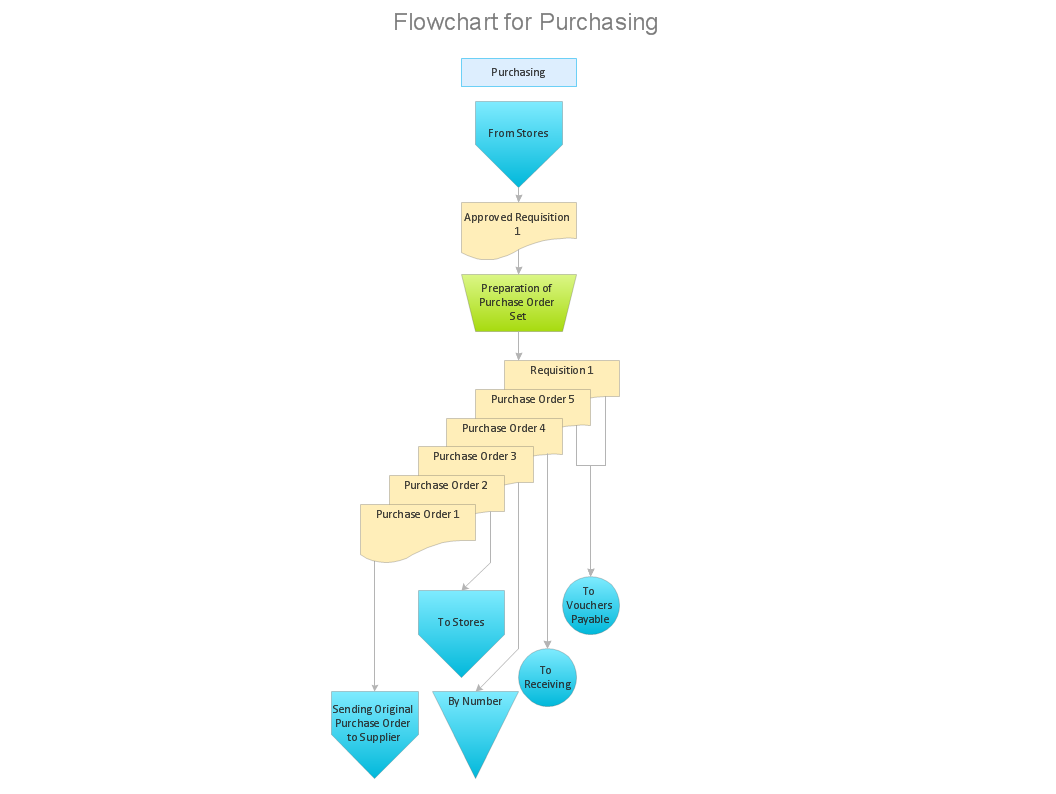
Picture: Why is it important to have a formal purchasing process?
Related Solution:
The Nature Solution addition to ConceptDraw Solution Park for ConceptDraw DIAGRAM includes new libraries that provide a wide range nature objects and it can be used in many areas.
Picture: Drawing Illustration
