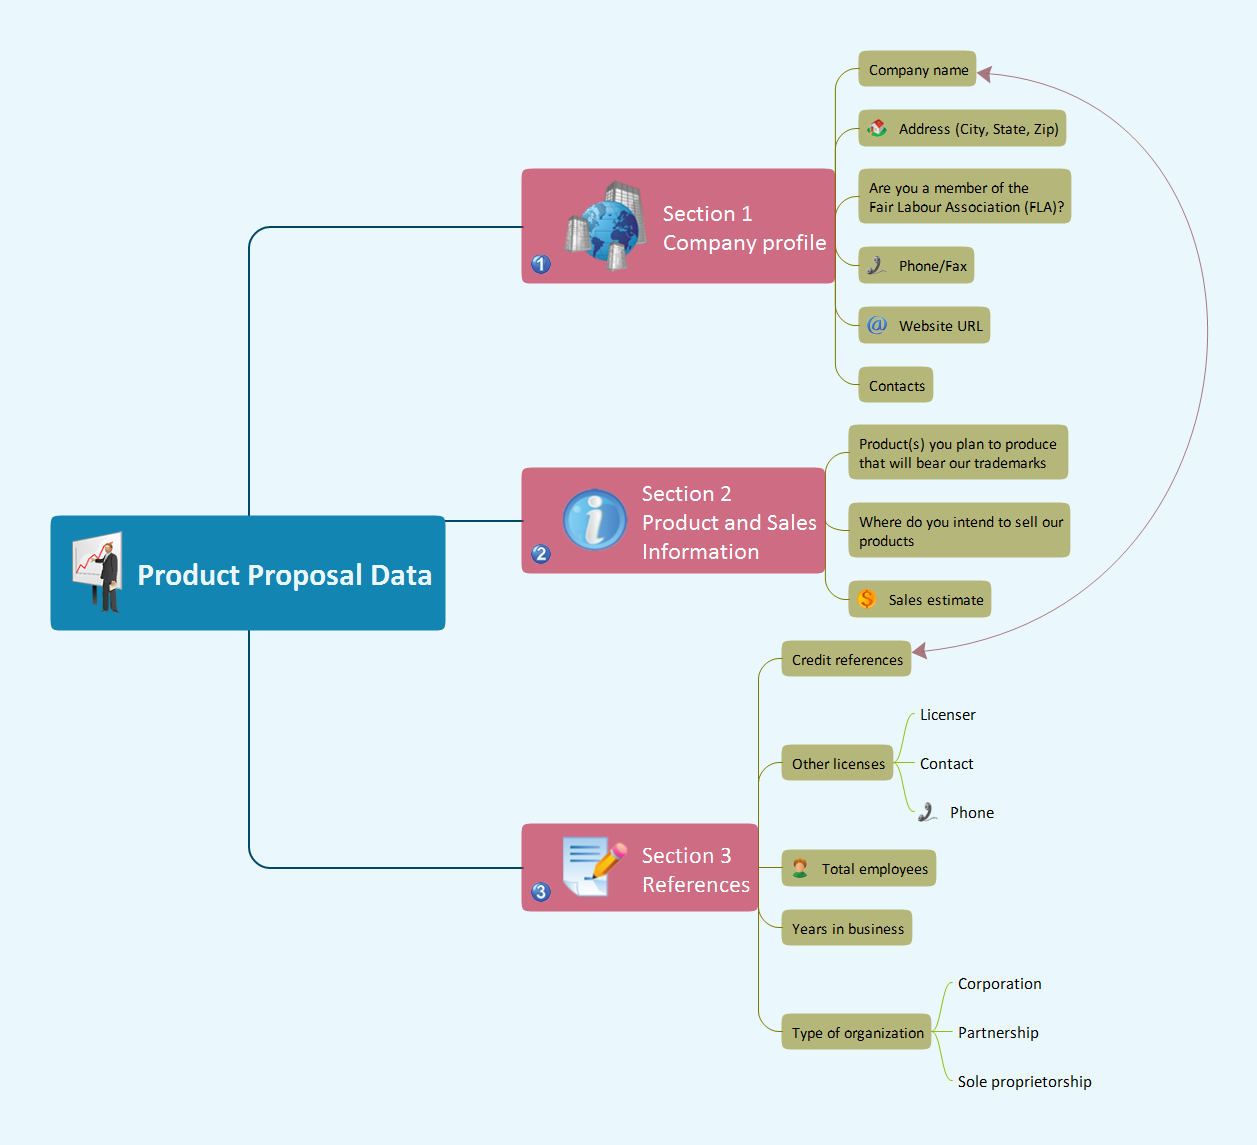
Sample 1. Product proposal data
This mindmap was created in ConceptDraw MINDMAP mind mapping software by experienced user for 30 minutes as a sample for solution Note Exchange from ConceptDraw Solution Park.
The Note Exchange solution extends ConceptDraw MINDMAP with the ability to exchange with Evernote, and access mind maps anywhere, on any computer or mobile device via Evernote.
Use ConceptDraw MINDMAP enhanced with Note Exchange solution as a requirement management tool, sending day-to-day requirements from your mind map to Evernote.
Using the Note Exchange solution you can upload a whole map, or specific parts relating to a certain person, requirement or meeting, and you can access your requirement mind maps wherever you are.
TEN RELATED HOW TO's:
ConceptDraw MINDMAP preserves total quality management and helps bring out the best in your products and services.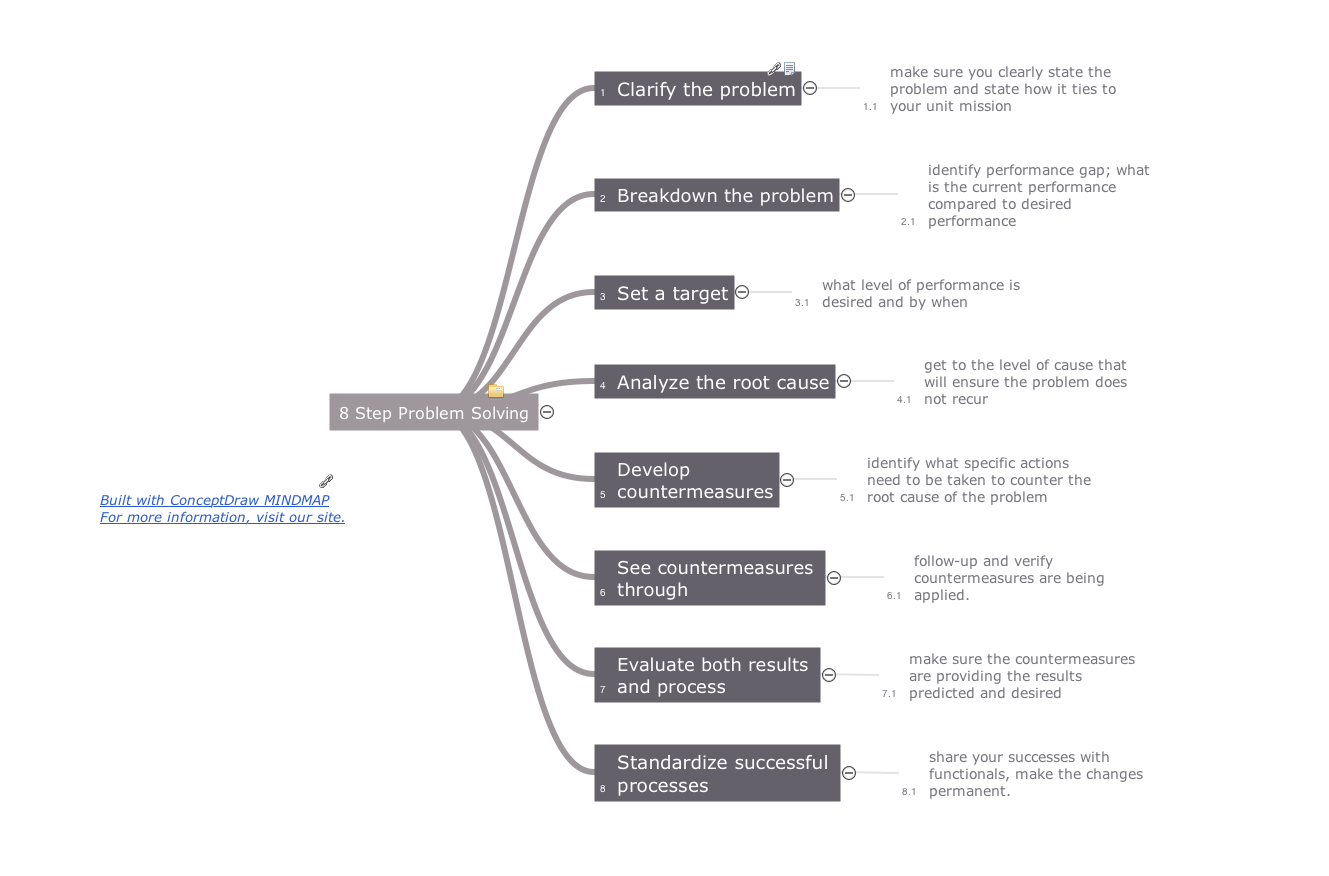
Picture: Mind Maps at work for Quality Managers
Related Solution:
ConceptDraw DIAGRAM system design software is a product of CS Odessa that was developed especially for making it much simpler to create all the needed diagrams, charts, flowcharts, schemes and other drawings when there is such a need in it. Having the Specification and Description Language (SDL) solution installed from the ConceptDraw STORE application may be another bonus to any ConceptDraw DIAGRAM diagramming and drawing software’s user as it offers both stencil libraries with the design elements and the pre-made examples of the diagrams, such as the SDL ones.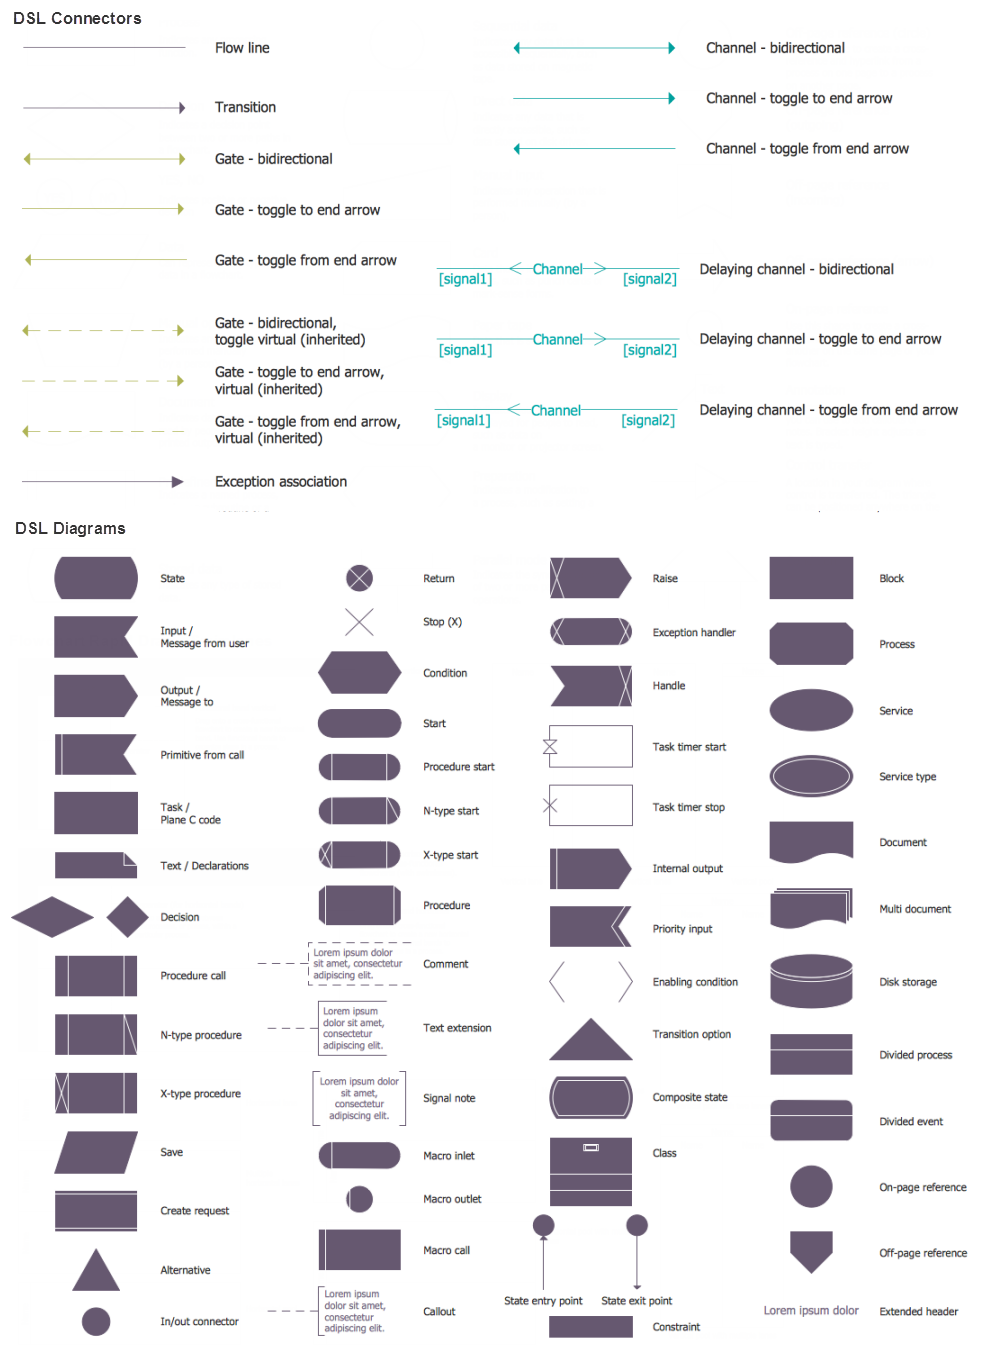
Picture: System Design
Related Solution:
Professional Mind Mapping. ConceptDraw MINDMAP professional software to create documents. Mac and PC compatible. MS Office Exchange Solutions. Skype Collaboration. Presentation Tools.
Picture: One formula of professional mind mapping :input data + output data + make great presentation
Related Solution:
ConceptDraw Arrows10 Technology - This is more than enough versatility to produce professional diagrams more quickly.
Professional diagramming software for mac helps you create variety diagrams, graphics, charts, live dashboards and plenty of graphics and pictures for your business and study.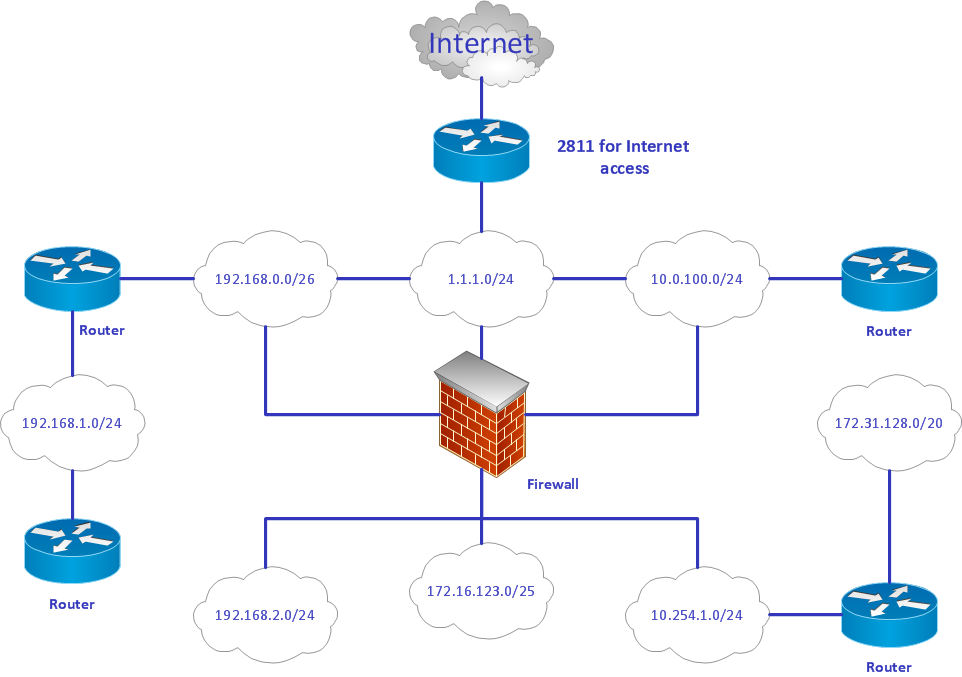
Picture: Produce Professional Diagrams More Quickly, Easily and Cost Effectively
To launch Projects Exchanging Mind Maps with Evernote using ConceptDraw MINDMAP simply and easily.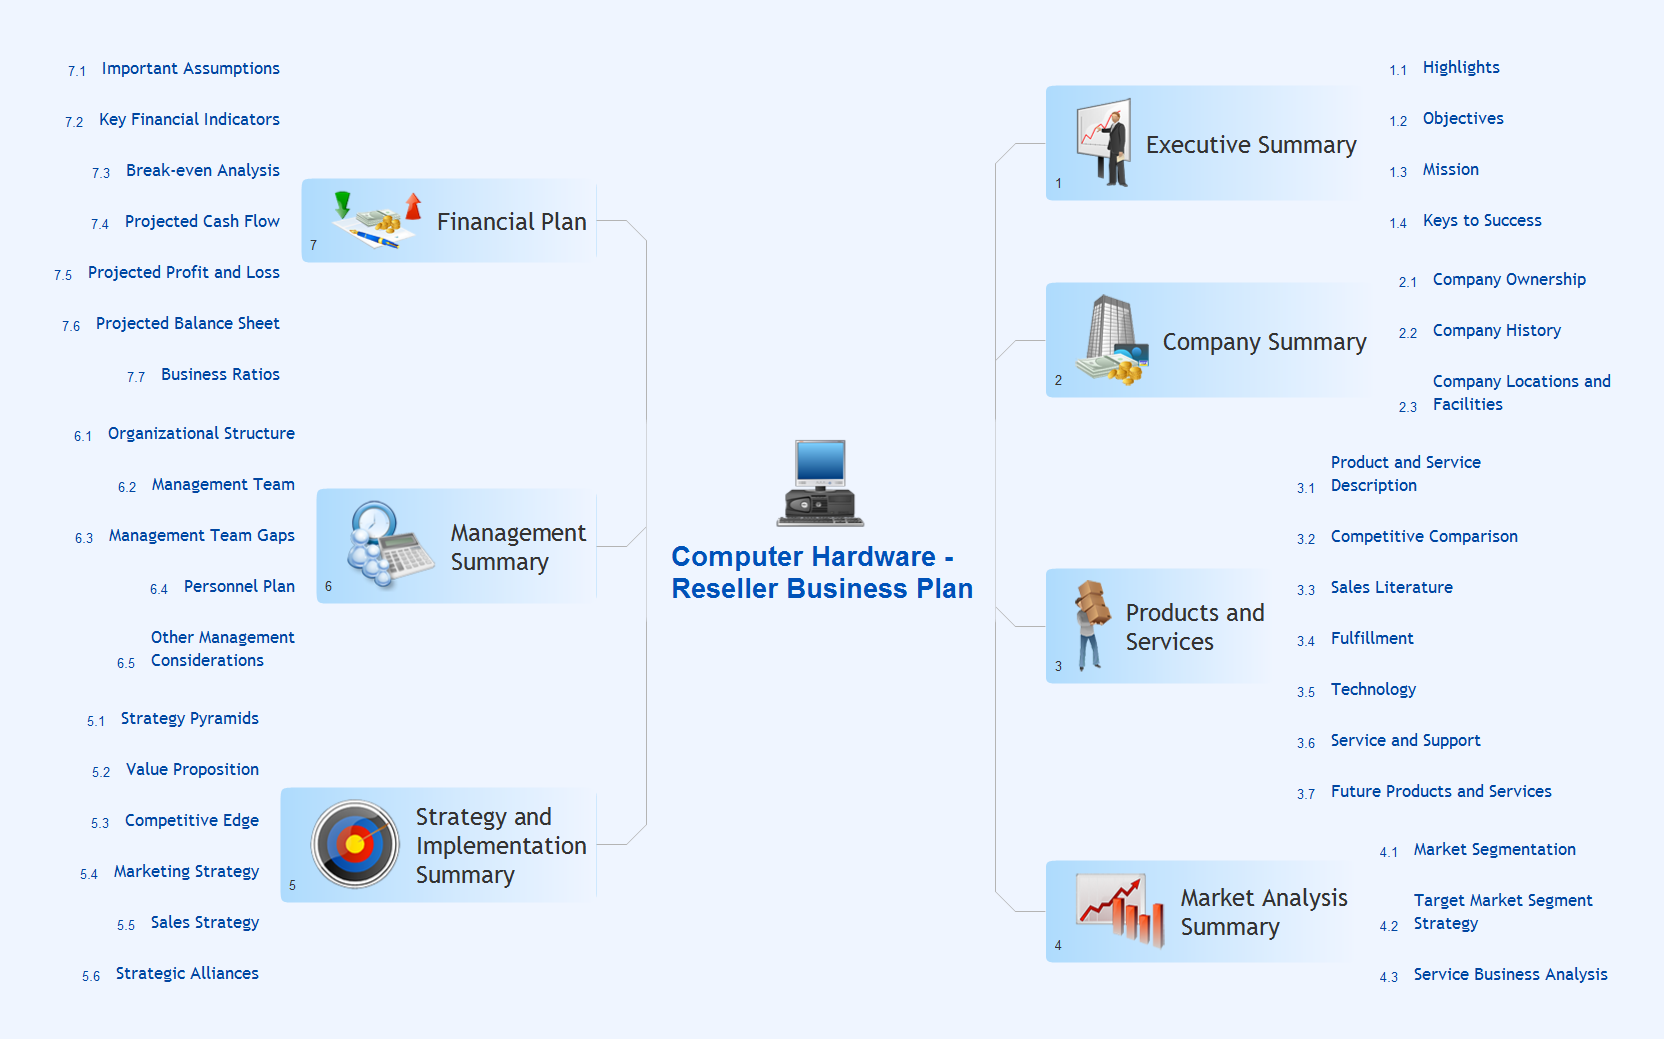
Picture: Launch Projects Exchanging Mind Maps with Evernote
Related Solution:
ConceptDraw DIAGRAM is a professional software for creating great looking flowcharts. The samples included in this set of software allows users to draw any type of flowchart.
Picture: Flowchart Process Example
Related Solution:
What is the accounting cycle? The accounting cycle is a sequence of steps that occur in the accounting period and include the processes of identifying, collecting, analyzing documents, recording transactions, classifying, summarizing, and reporting financial information of an organization.
Picture: What is the Accounting Cycle?
Related Solution:
Create value stream maps - for value stream analysis and value stream management, material and information flow mapping, using our quick start templates included with ConceptDraw.
Picture: Best Value Stream Mapping mac Software
Related Solution:
The library with 40 vector stencils is included in the ConceptDraw Value Stream Mapping solution.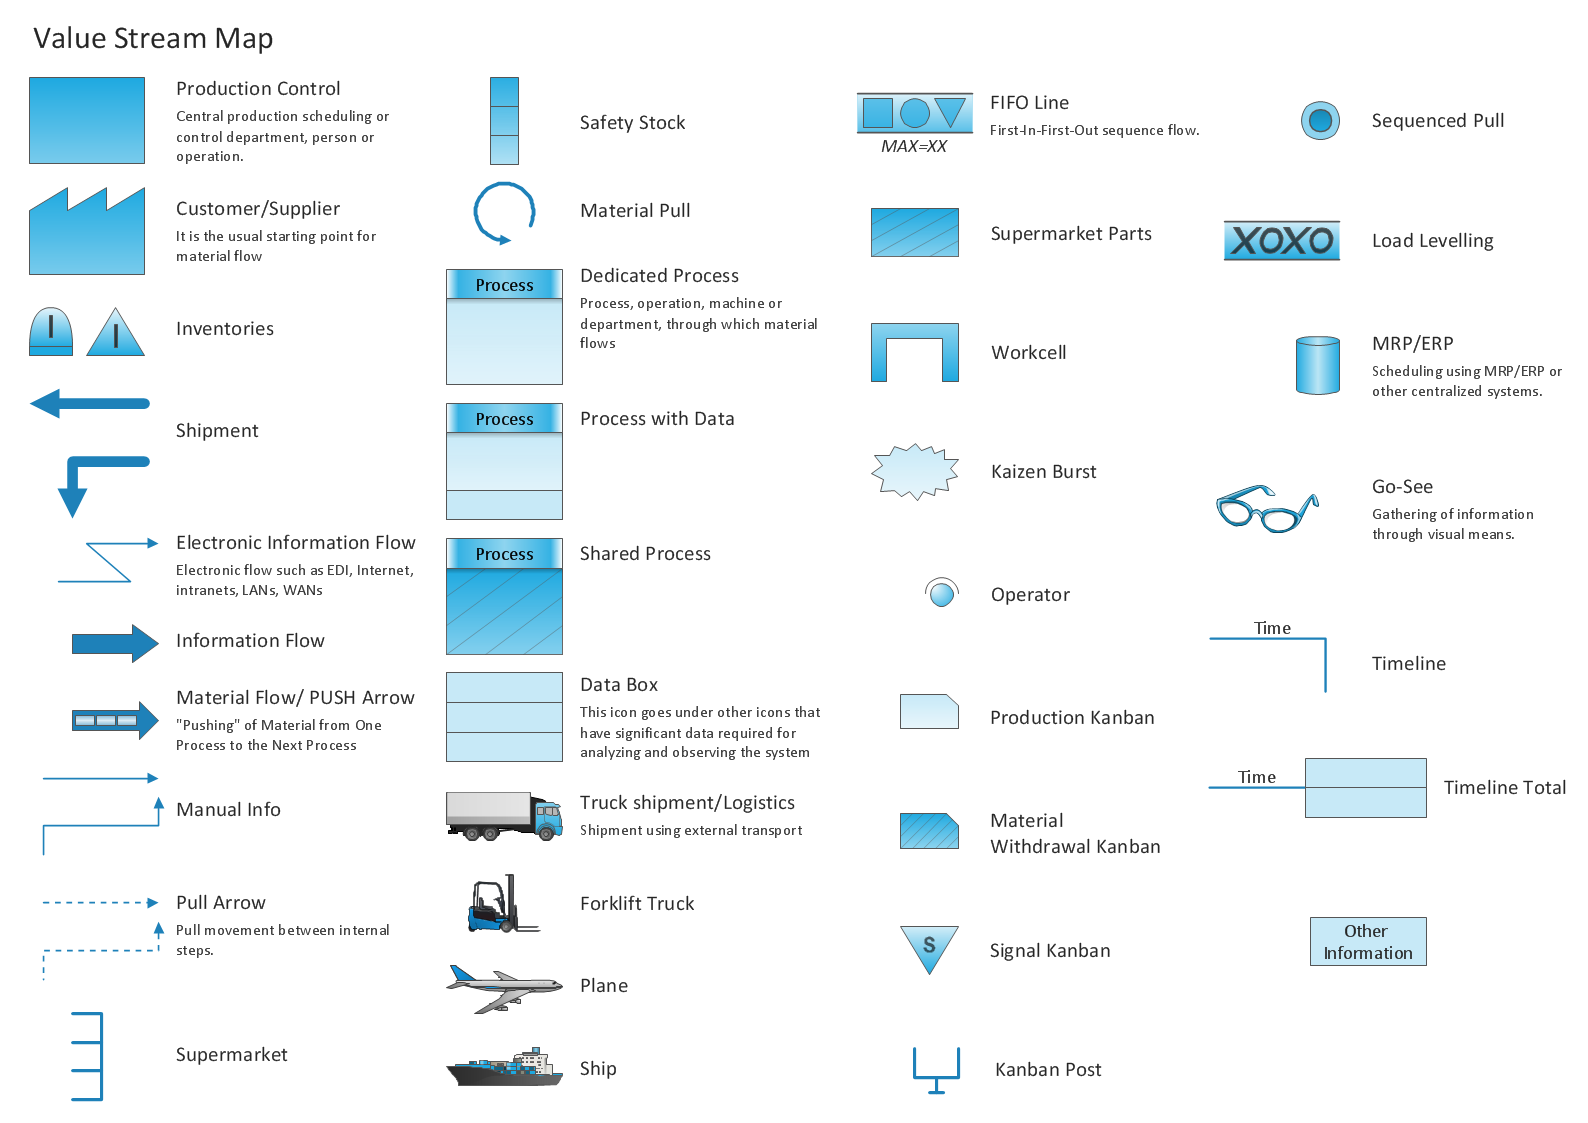
Picture: Value Stream Mapping Icons
Related Solution:
Tips on how to present a slide show to a group. Deliver a successful presentation to your team.
Picture: Presenting a Slide Show to a Group of People
Related Solution: