Problem solving
Management and Planning
ConceptDraw OFFICE suite is a software for the problem solving. The Seven Management and Planning Tools solution is a set of such tools for investigating complex problems.
These tools are exemplary at
- organizing research,
- parsing complex problems,
- providing a structure for the details,
- helping managers make decisions,
- and organizing effective communications in a visual manner that keeps everyone involved.

Pic.1 Problem Solving — Root Cause Analysis Tree Diagram
With a root cause identified, you can work on causation, and solutions to implement that will address this problem. Problems and solutions are displayed side by side to help when analyzing.
See also:
NINE RELATED HOW TO's:
The HR Management Software is an incredibly powerful tool for those who need to analyze or present human resource process flows in a visually effective manner.
Picture: HR Management Software
Related Solution:
Create flowcharts, org charts, shipping flowcharts, floor plans, business diagrams and more with ConceptDraw. Includes 1000s of professional-looking business templates that you can modify and make your own.
Picture: Basic Diagramming
Related Solution:
Electrical Engineering Solution used together with ConceptDraw DIAGRAM drawing facilities makes short a work of drawing various electrical and electronic circuit schemes. A library of vector objects composed from symbols of Analog and Digital Logic elements of electric circuit includes 40 symbolic images of logic gates, bistable switches of bi-stable electric current, circuit controllers, amplifiers, regulators, generators, etc. All of them can be applied in electronic circuit schemes for showing both analog and digital elements of the circuit.
Electrical Engineering Solution used together with ConceptDraw DIAGRAM drawing facilities makes short a work of drawing various electrical and electronic circuit schemes. A library of vector objects composed from symbols of Analog and Digital Logic elements of electric circuit includes 40 symbolic images of logic gates, bistable switches of bi-stable electric current, circuit controllers, amplifiers, regulators, generators, etc. All of them can be applied in electronic circuit schemes for showing both analog and digital elements of the circuit.
Picture:
Electrical Diagram Symbols F.A.Q.
How to Use Electrical ConceptDraw Diagram Software
Related Solution:
Create value stream maps - for value stream analysis and value stream management, material and information flow mapping, using our quick start templates included with ConceptDraw.
Picture: Value-Stream Mapping for Manufacturing
Related Solution:
Creating and organizing presentations, structuring received presentations, presenting mind maps, and preparing for public presenting.
Picture: How to Deliver Presentations using Mind Maps
Related Solution:
Analyze the root causes of factors that influence the problem. A diagram is constructed separately for each high priority factor.
Identify the root causes for a factor and then list possible corrective action.
The diagram displays the structure of causes for a factor and possible corrective actions.
The Root Cause Tree Diagram is used for further formulation of actions.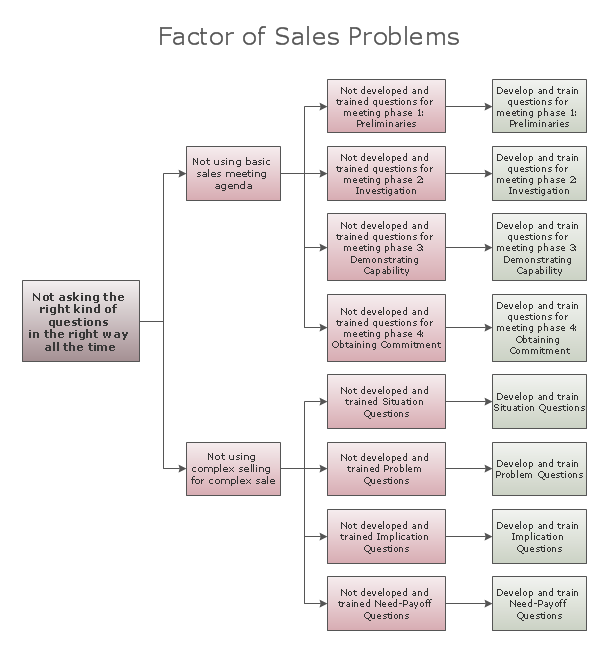
Picture: Root Cause Tree Diagram
Related Solution:
This sample shows the Influence Diagram. It was created in ConceptDraw DIAGRAM diagramming and vector drawing software using the Basic Diagramming Solution from the Universal Diagramming area of ConceptDraw Solution Park.
Influence diagram represents the directed acyclic graph with three types of nodes and three types of arcs that connect the nodes. Decision node is drawn as a rectangle, Uncertainty node is drawn as an oval, Value node is drawn as an octagon.
Picture: Influence Diagram
Related Solution:
You need to draw Authority Matrix Diagram quick and easy? Design it with ConceptDraw DIAGRAM!
ConceptDraw DIAGRAM extended with Seven Management and Planning Tools solution from the Management Area is the best Authority Matrix Diagram Software.
Picture: Authority Matrix Diagram Software
Related Solution:
ConceptDraw MINDMAP is ideal conference planning software. It offers you a wide set of useful tools and drawing capabilities allowing you create professional looking conference planning Mind Maps.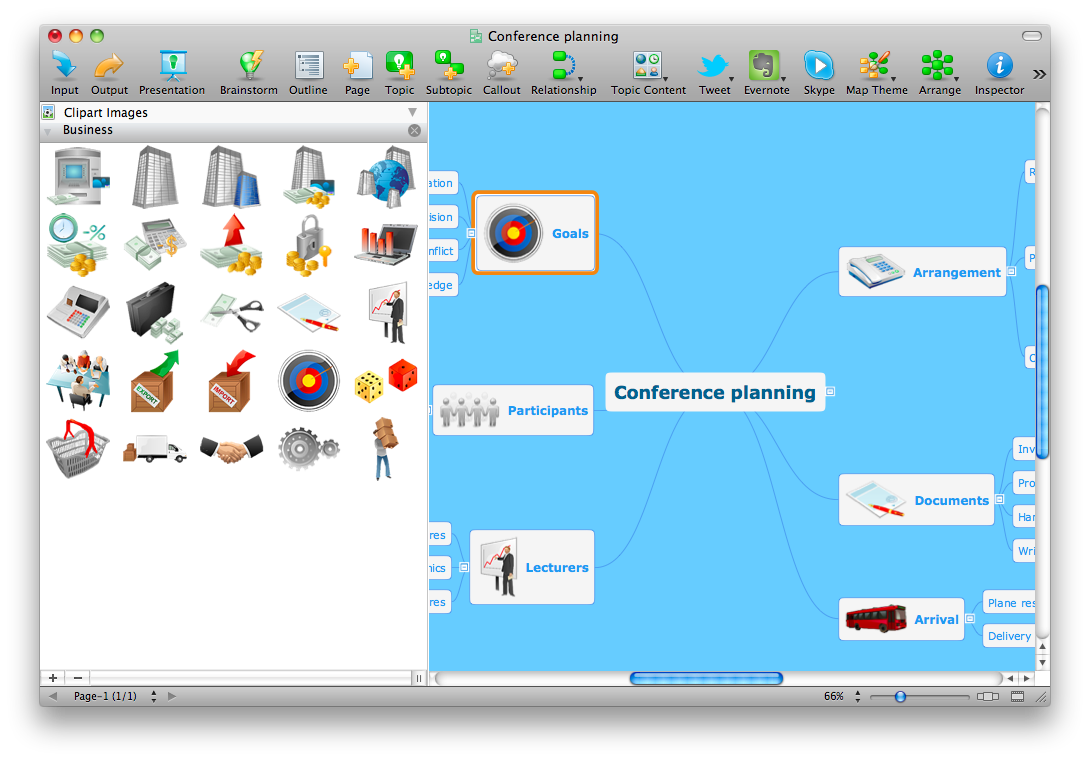
Picture: Conference Planning Software
Related Solution:
ConceptDraw
DIAGRAM 18