Flowchart Program Mac
ConceptDraw DIAGRAM
ConceptDraw DIAGRAM is a Mac OS X Flowchart software. This is professional flowchart maker software as well as excellent graphical tool for common use in graphics. Many vector stencils, samples and templates created by designers are built into this program. This software has been developed for drawing any type of flowchart. Use RapidDraw technology for adding new objects to a flowchart, and you will make great-looking flowchart quickly.
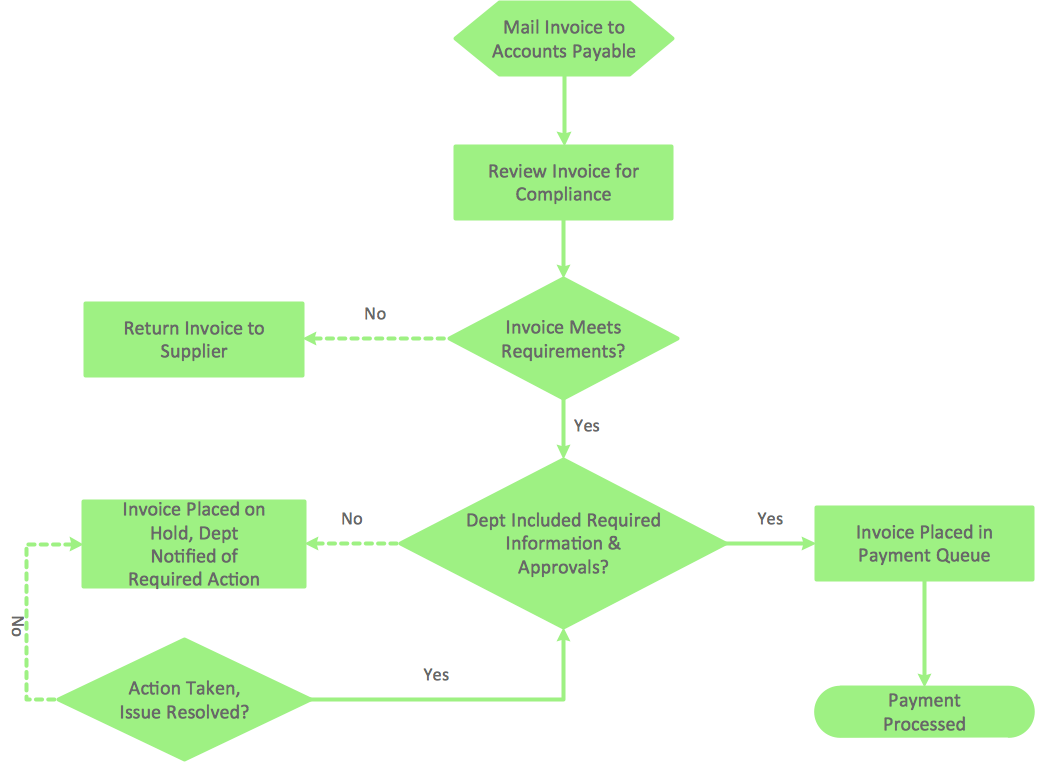
Sample 1. Flowchart sample: Invoice payment process.
This flow chart example visualizes invoice payment process.
Use ConceptDraw DIAGRAM diagramming and business graphics software to draw your own business process flowcharts. This is best flowchart maker used for making professional look.
See also Samples:
NINE RELATED HOW TO's:
Android is a mobile operating system (OS) based on the Linux kernel and currently developed by Google.
One of the most important features of any Android app is, of course, its Android User Interface. It is all what the user sees on the screen of its device and interacts with. Creating of successful Android User Interface and developing Android UI prototypes may be the mighty task. But we recommend you to make it fast and easy in ConceptDraw DIAGRAM specially extended with Android User Interface Solution from the Software Development Area.
Picture: Android User Interface
Related Solution:
ConceptDraw DIAGRAM is a powerful software that helps you create professional looking cross-functional flowcharts with the well-designed objects. ConceptDraw DIAGRAM allows you to focus on work, not the drawing process. ConceptDraw Arrows10 Technology allows to draw connectors with smart behavior that gives flexibility to you during work process.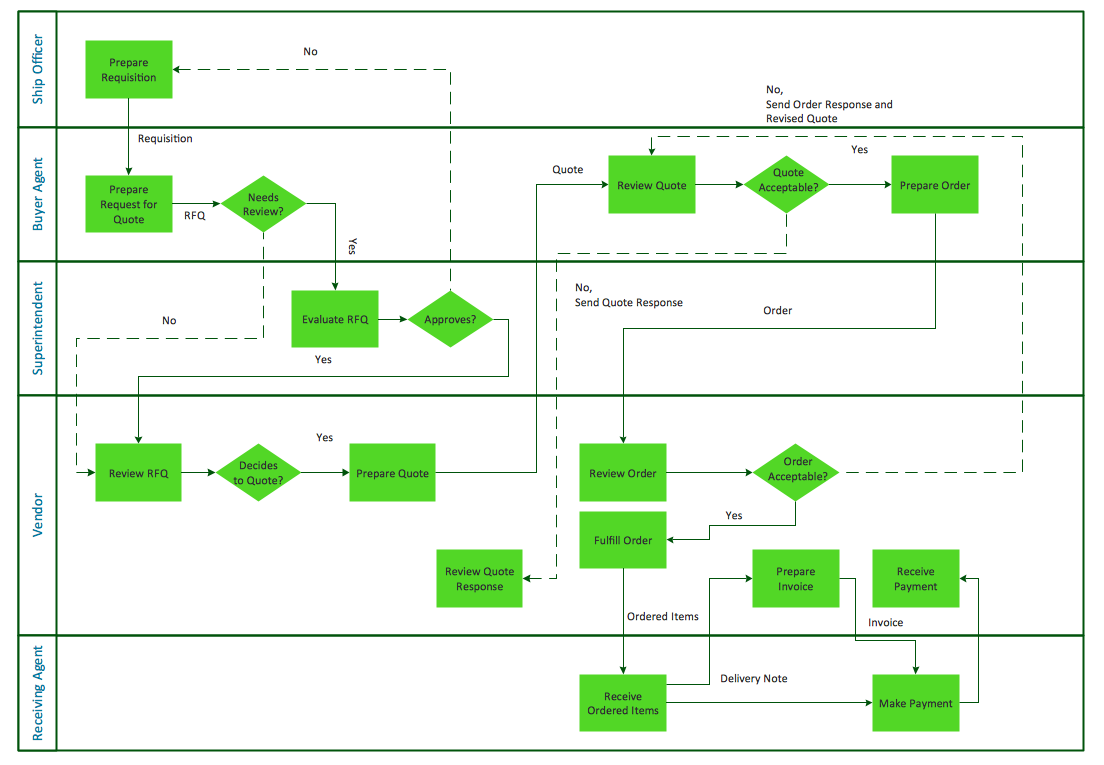
Picture: Horizontal Cross Functional Flowchart
Related Solution:
ConceptDraw DIAGRAM is new software for business and technical drawing. Powerful business drawing tools, extensive libraries with pre-drawn shapes, free samples of business drawings, technical drawings and flowcharts, support of many graphic formats enable users to visually develop their business drawings charts and diagrams in any combination of drawings, diagrams and flow charts.
Picture: ConceptDraw DIAGRAM The best Business Drawing Software
Related Solution:
This sample shows the Flowchart that displays the solid-state welding processes, the types of welding.
Picture: Types of Welding in Flowchart
Related Solution:
Interactive tool helps you find the appropriate response to social media mentions quickly.
Picture: How to Prepare Learning Presentations for Training
Related Solutions:
Mathematical Drawing Software - Draw mathematical illustration diagrams easily from examples and templates!
Picture: Basic Diagramming
Related Solution:
This sample was created in ConceptDraw DIAGRAM software using the Flowcharts solution.
Picture:
Copying Service Process Flowchart.
Flowchart Examples
Related Solution:
It doesn’t matter what kind of business you have, a bar or a gym, there are common concepts for any of them. One of those concepts is accounting, and to facilitate the work with the figures, you can use accounting flowchart symbols and create a clear and representative scheme. You can create flowchart for auditing, tax accounting and even for planning your own budget.
A graphical tool for displaying successive processes is flowchart. This method is mostly suited to represent an accounting process. The sequence of steps in the accounting process usually consists of standard accounting procedures, that can be depicted by using a minimal number of symbols, applied for the basic flowcharting. The advanced opportunity to create professional Accounting Flow charts is provided by ConceptDraw Accounting Flowcharts solution. It includes contains a library of accounting flowchart symbols used when drawing the accounting process flow.
Picture: Accounting Flowchart Symbols
Related Solution:
Create your own flow charts of purchasing business processes using the ConceptDraw DIAGRAM software
Picture:
Purchasing Flowchart - Purchase Order
Flowchart ExamplesRelated Solution:
ConceptDraw
DIAGRAM 18