TQM Diagram Tool
Total quality management (TQM) practice involves visual tools to analyze business and manufacturing processes, and monitor quality metrics and indicators for quality control. These tools include diagrams, charts and graphs as flowcharts, fishbone diagrams, seven management and planning tools, and other.

Pic.1 Quality fishbone diagram template.
In total quality management (TQM) the Ishikawa diagram is used for quality defect prevention by identification of potential factors causing quality variations. These factors are grouped into main categories to identify quality variation sources.
See also Samples:
TEN RELATED HOW TO's:
Using mind mapping for quality management is a creative approach that allows one to structure all key quality points on the one page.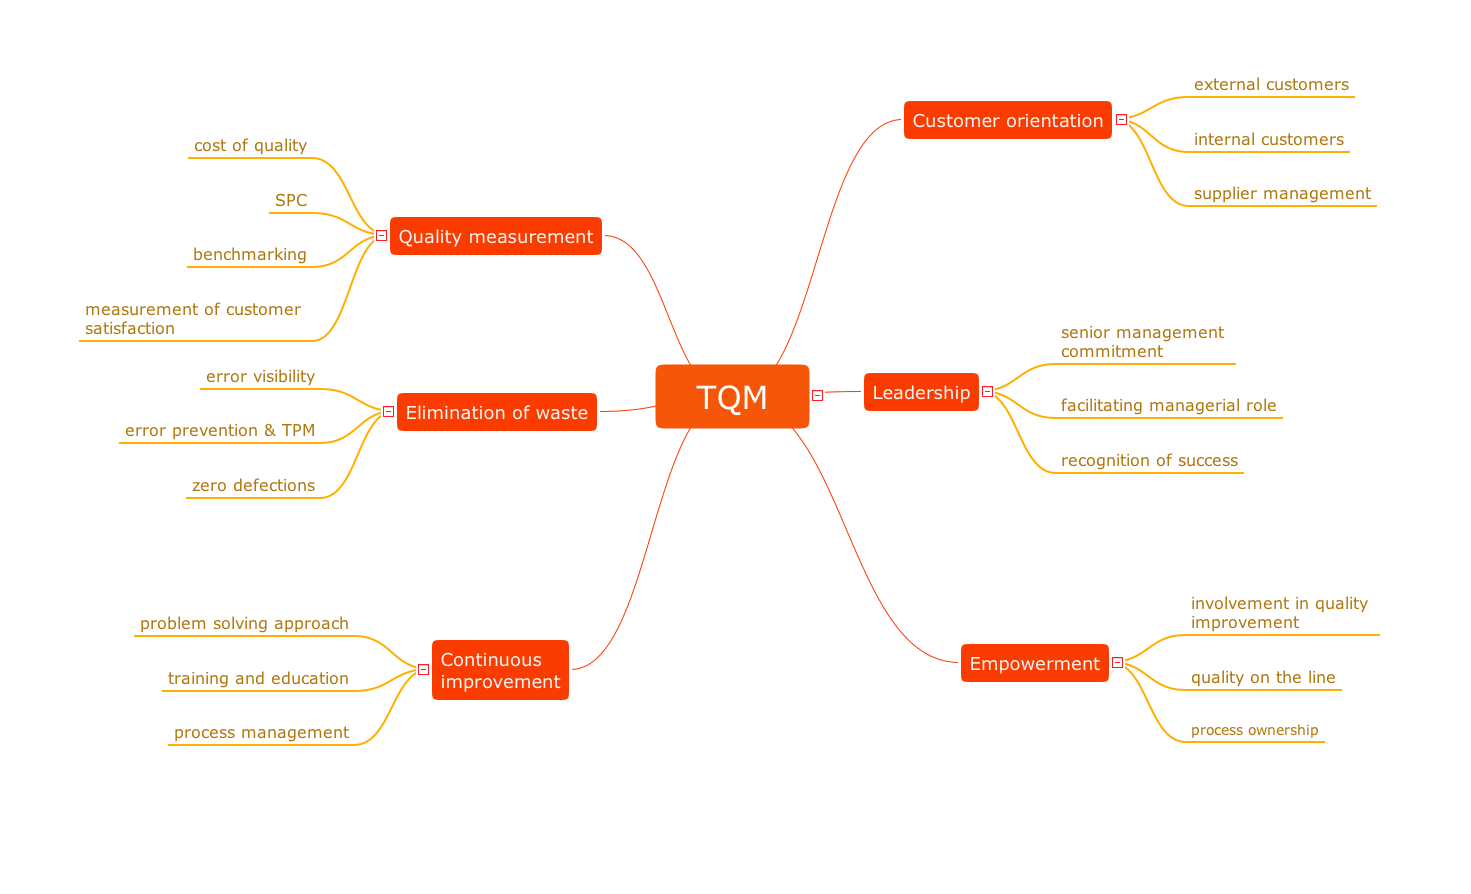
Picture: Quality Control
Related Solution:
This sample was created in ConceptDraw DIAGRAM diagramming and vector drawing software using the Computer and Networks solution from Computer and Networks area of ConceptDraw Solution Park.
This sample shows the Hierarchical network topology.
A Hierarchical network topology interconnects multiple groups that are located on the separate layers to form a larger network. Each layer concentrates on the specified functions, this allows to choose the right equipment for the layer.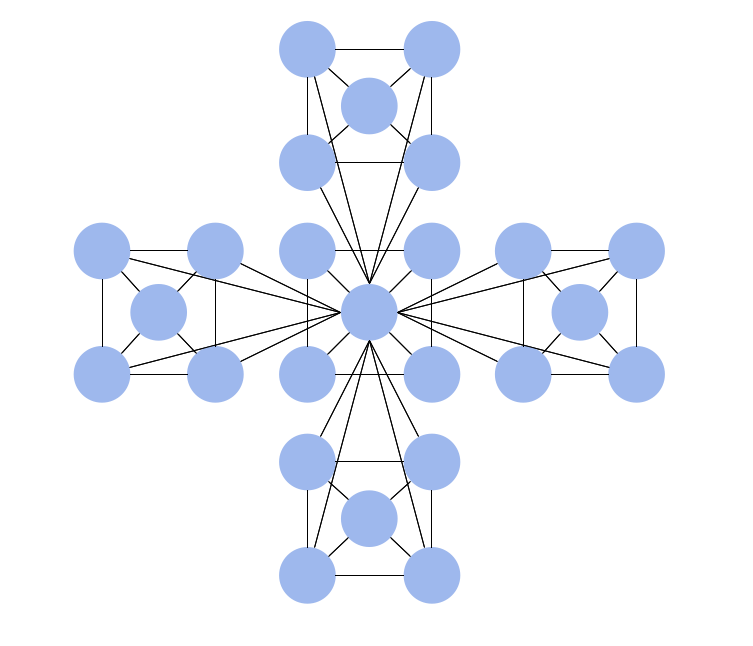
Picture: Hierarchical Network Topology
Related Solution:
Describing a workflow or approval process can take hours and be too complicated, especially since there are options to do it quickly and vividly. Diagrams called flowcharts replace long paragraphs of boring text and represent information in a graphic way. You can draw one on paper or you can use flowchart software to do it quickly and scalable. This kind of software is easy to use and you don’t need any special skills to start using it. In addition, there are a lot examples and predesigned templates on the Internet.
Flowcharts are a best tool for staking out a huge and complex process into some small readable parts. Surely, flowcharts can be drawn manually but the use of standard symbols that make it clear for a wide audience makes a software tool preferred for this task. The core for a successful flowchart is its simplicity. That is why often before beginning making flowchart through software, people draw the sketch on a piece of paper. Designing an effective flowchart means the combination of the data needed to be shown and the simplicity with which you depict it.
Picture: Flowchart Software: A Comprehensive Guide
Related Solution:
This sample shows the Strategic Plan of the Broadband Lifecycle that was developed by Strategic Networks Group. The Broadband Lifecycle represents the advance of the broadband investments.
Picture: Successful Strategic Plan
To support you in your tasks you can use the power of ConceptDraw DIAGRAM providing
intelligent vector graphics that are useful for Quality Solution diagramming and ConceptDraw MINDMAP for key Quality Solution mind maps.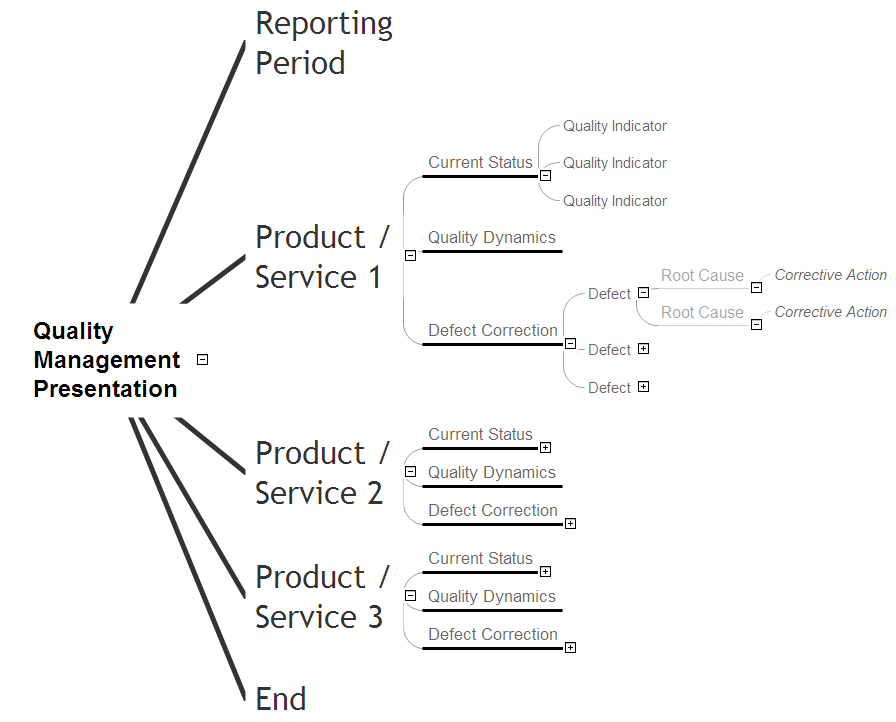
Picture: Business Productivity - Quality
Related Solution:
Online collaboration tool for workgroups that extends Skype conference call possibilities. This professional solution makes meetings more powerful and discussions more lively. Great way to engage your audience.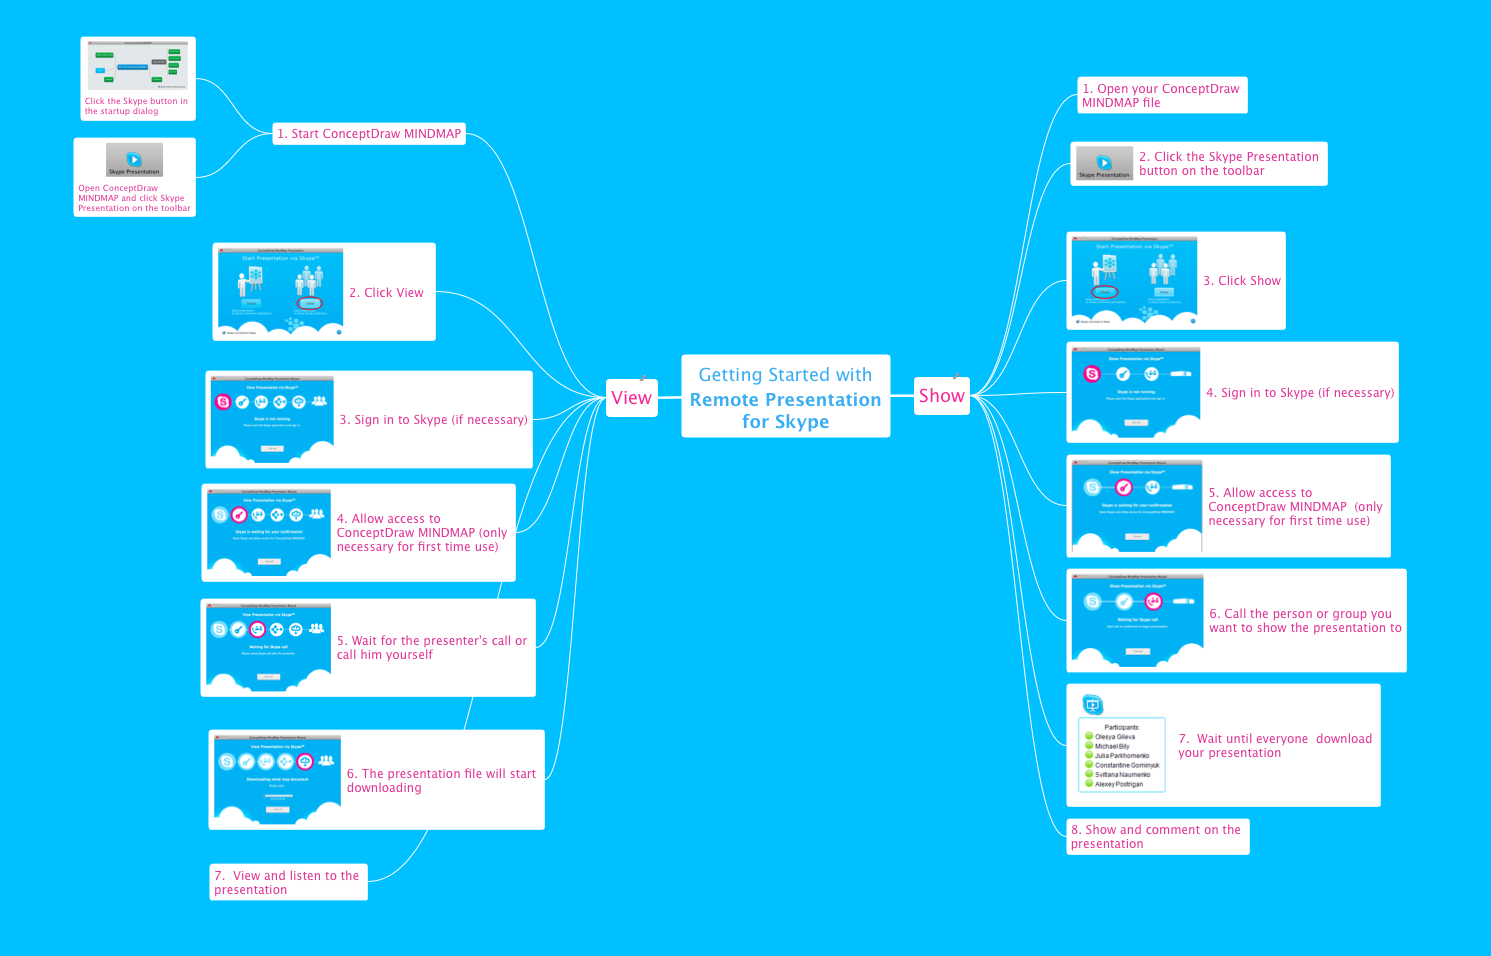
Picture: How To Collaborate via Skype
Related Solution:
Activity on Node Network Diagramming Tool - Activity Network and Project Evaluation and Review Technique, or PERT, charts are a way of documenting and analyzing the tasks in a project.
This sample shows the Activity on node network diagramming method. It was created in ConceptDraw DIAGRAM diagramming and vector drawing software using the Seven Management and Planning Tools solution from the Management area of ConceptDraw Solution Park.
Picture: Activity on Node Network Diagramming Tool
Related Solution:
VSM symbols are the best for a production process designing. The entire Value Stream Mapping method uses a graphical representation of the manufacturing process, factors' pros and cons, that all stakeholders can easily understand. Value Stream Mapping is a graphical technique that provides possibilities to improve analysis of a manufacturing process, at the stage of the transferring information or materials that required to deliver a product or service to the customer.
Picture: Value Stream Mapping Symbols
Related Solution:
Peru, officially the Republic of Peru, is a country in western South America.
The history of Peru goes back to the distant past and its divided into several main stages. Geography of Peru is also diverse - there is a desert, as well as the ocean coast, and of course the mountain ranges.
The Continent Maps solution from Maps area of ConceptDraw Solution Park provides stencil library Peru, which is made up of well-designed vector shapes delivering easy experience in creating diagrams with ConceptDraw DIAGRAM software.
All ConceptDraw DIAGRAM documents are vector graphic files and are available for reviewing, modifying, and converting to a variety of formats: image, HTML, PDF file, MS PowerPoint Presentation, Adobe Flash, MS Visio (.VDX,.VSDX).
Picture: Geo Map — South America — Peru
Related Solution:
Matrix organizational structure is one of the main forms of structures which is actively used by organizations to carry forth the functions of a company visually and effectively.
Now we have ConceptDraw DIAGRAM diagramming and vector drawing software extended with 25 Typical Orgcharts solution from the Management area of ConceptDraw Solution Park which will help easy represent matrix organizational structure of any degree of complexity.
Picture: Matrix Organization Structure
Related Solution:
ConceptDraw
DIAGRAM 18