
Pic. 1. Waterfall bar chart.
This sample shows the waterfall bar chart of the company profit and loss. The values of the figures describe the company profit.
Use the predesigned vector stencils, templates and samples from the Bar Graphs Solution for ConceptDraw DIAGRAM to create your own Waterfall Charts quick and easy.
The Waterfall charts produced with ConceptDraw DIAGRAM are vector graphic documents and are available for reviewing, modifying, and converting to a variety of formats (image, HTML, PDF file, MS PowerPoint Presentation, Adobe Flash or MS Visio).
More Related Diagrams:
TEN RELATED HOW TO's:
Different organizations have different organizational structures. Matrix organization is one of the most popular and widely used type of organizational structure. Use ConceptDraw DIAGRAM diagramming and vector drawing software extended with 25 Typical Orgcharts solution from the Management area of ConceptDraw Solution Park for fast and easy designing matrix organizational chart for your company.
Picture: Matrix Organization
Related Solution:
Using mind mapping in education is very popular way to make your lecture materials more structural and clear both for you and for students. At remote learning session your students also can make notes or type questions to the current slides without interrupting slide show.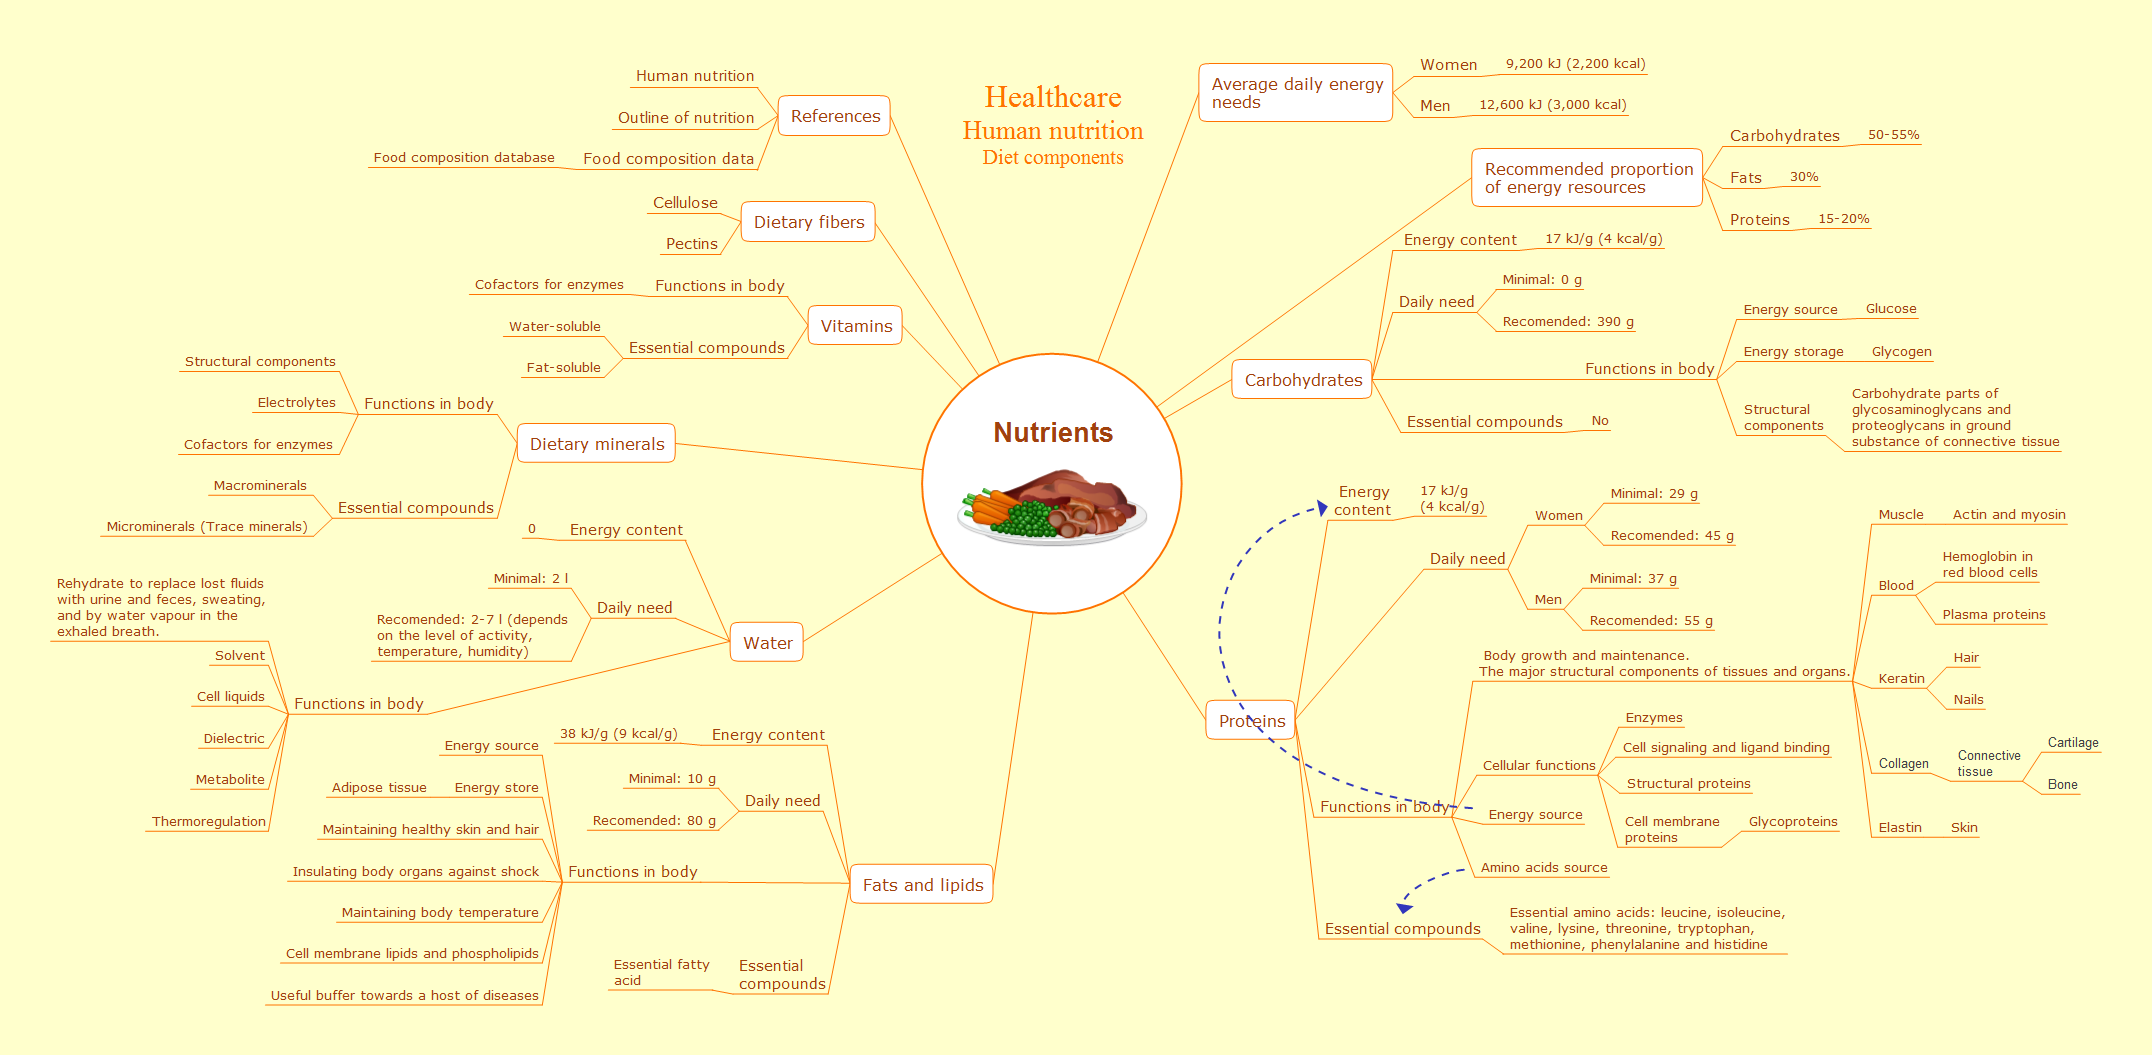
Picture: Presentations in Educational Process
Related Solution:
Developing a corporate network starts from choosing equipment such as servers or routers. You should choose a topology for your network depending on your needs and budget. Thus, a star topology is cheap to implement, and mesh topology, for instance, is more reliable.
This network diagram illustrates various types of computer network diagrams. Here one can find out the samples of Star, Ring, common Bus and even a rather rare fully connected network topologies. This diverse array of diagrams was created using the ConceptDraw DIAGRAM software and its solution designed especially for computer networking: design and documenting. There are more than 2 thousands graphical symbols of network equipment in the solution's vector libraries. You can create a diagram of any type network, containing any equipment and connections - no matter is it the most ancient or the super-modern network
Picture: Network Topology
Related Solution:
An example of marketing analysis diagram, can be used to analyse product market and define marketing strategy.
Picture: Marketing Analysis Diagram
Related Solution:
Cafe Decor is one of the most important components of cafe design. Just thanks to the cafe decor elements is created the unique warm atmosphere of the cafe which makes you come back there again and again. ConceptDraw DIAGRAM extended with Cafe and Restaurant Floor Plan solution can help you create Cafe Decor designs simply and fast.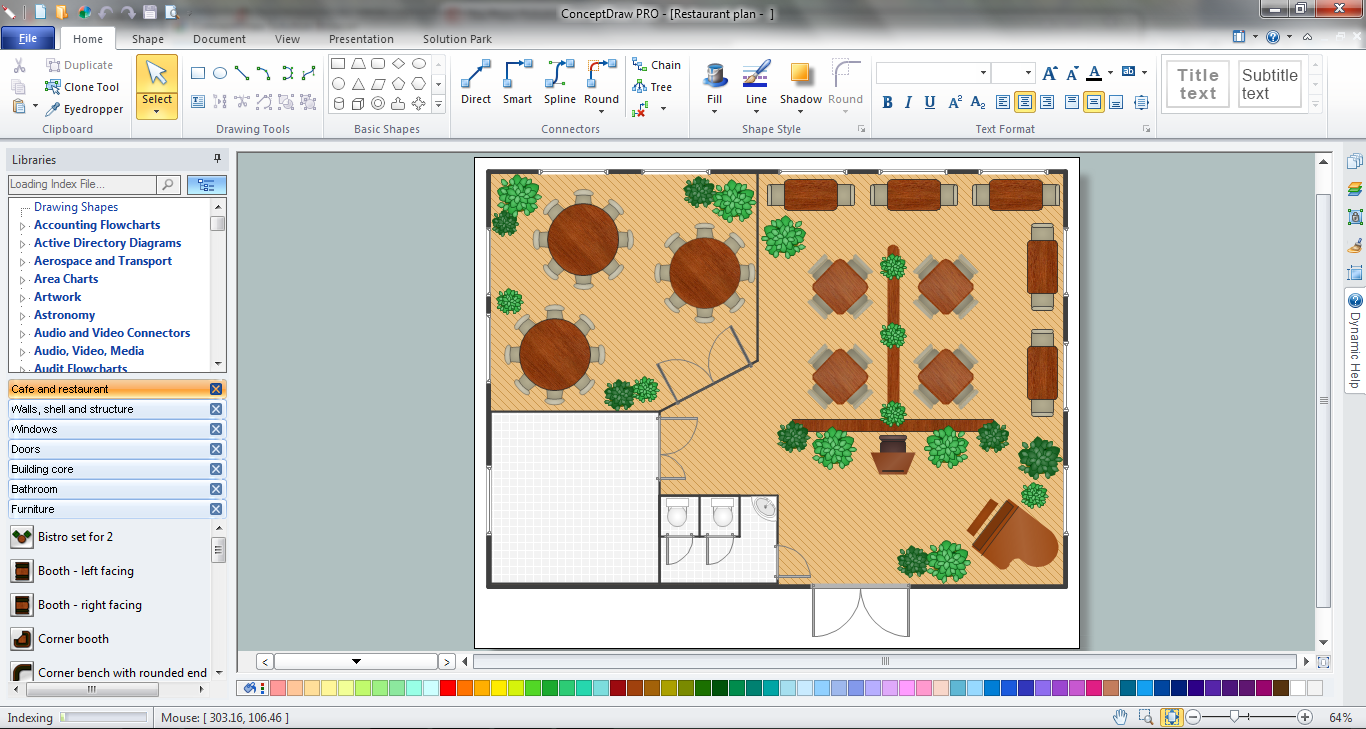
Picture: Cafe Decor
Related Solution:
Column chart examples from ConceptDraw collection can help you find the best visual depiction for you data. You can easily modify column chart examples according to data you want to visualize.
Picture: Column Chart Examples
Related Solution:
You need to draw the Bar Graph? The automated tool can be useful for you. ConceptDraw DIAGRAM diagramming and vector drawing software extended with Bar Graphs solution from Graphs and Charts area of ConceptDraw Solution Park will help you create any Bar Graph.
Picture: Bar Graph
Related Solution:
The calendars around us everywhere in the modern world. There are a lot of calendar types, each of them has its own assignment: Business calendar, Personal calendar, Economic calendar, Financial calendar, Daily calendar, Monthly calendar, and many other useful calendar types. ConceptDraw DIAGRAM offers you the possibility to make your own unique calendars on the base of the Blank Calendar Template which is included to the Calendars Solution from the Management Area.
Picture: Blank Calendar Template
Related Solution:
The Cloud Computing is the use of the software and hardware that includes the great number of computers connected over the communication network such as the Internet. The Cloud name comes from the usage the cloud symbol on the system diagrams as the abstraction for the complex network infrastructure. This term is used as a marketing metaphor for the Internet.
This example was created in ConceptDraw DIAGRAM using the Computer and Networks Area of ConceptDraw Solution Park and shows the Cloud Computing.
Picture: Cloud Computing
Related Solution:
One of the ways effectively visualize what is a Cloud computing or Cloud computing architecture, is to create the Sequence diagram for Cloud computing. The ConceptDraw DIAGRAM diagramming and vector drawing software enhanced with Cloud Computing Diagrams solution from the Computers and Network area of ConceptDraw Solution Park will help you design all desired types of diagrams related with cloud computing.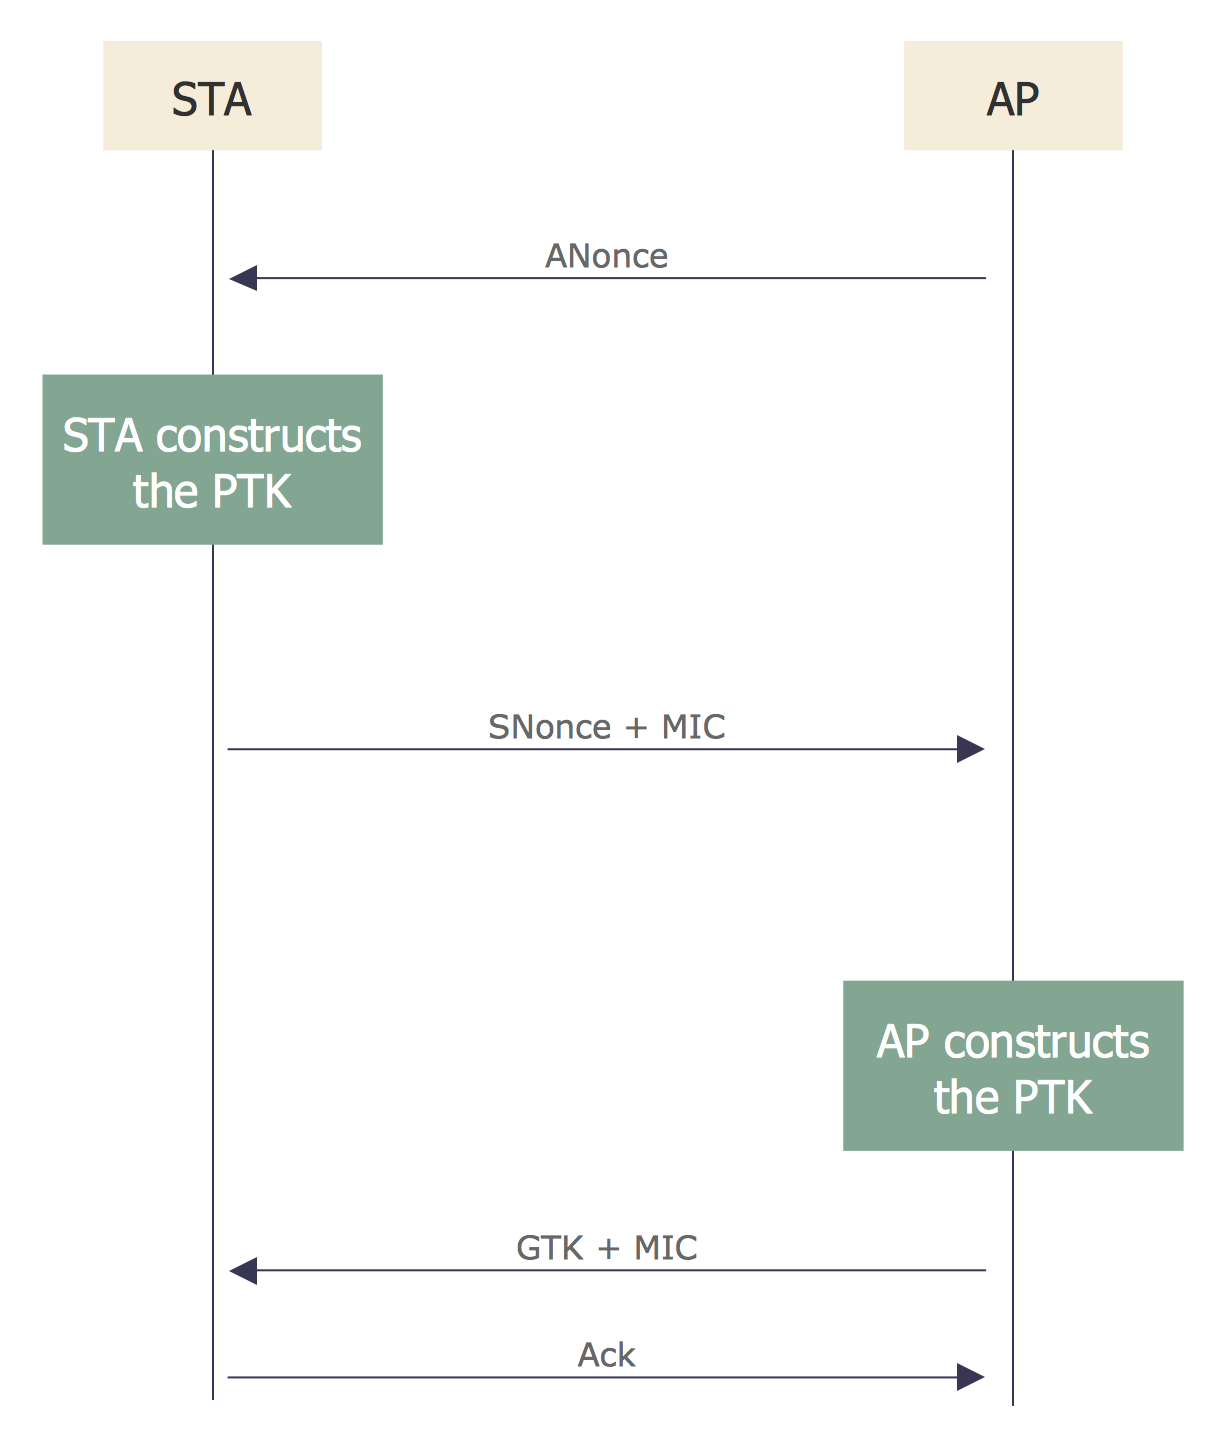
Picture: Sequence Diagram for Cloud Computing
Related Solution: