How To Implement Collaborative Project Management
Collaborative Project Management
Collaborative Project Management enables project teams to collaborate across departmental, corporate, and national boundaries and to master growing project complexity .
ConceptDraw MINDMAP is collaborative project management software witch has powerful collaborative project management tool for presenting via Skype. This allows to implement successfully project management collaboration in really short terms.

Collaborative Project Management via Skype mind map sample is created using ConceptDraw MINDMAP mind mapping software. This is the example of e-Business Strategy presentation for project team collaboration via Skype. Use this mindmap sample for implementation of Remote Presentation for Skype solution from ConceptDraw Solution Park.
See also Samples:
TEN RELATED HOW TO's:
If you have your own business, you shouldn’t be afraid to use different management techniques. It also should be mentioned that SWOT analysis tool for small business is just as useful as for an transatlantic corporation. If you want to see whether you company is able to compete on the market, SWOT analysis is a great solution.
The following drawing illustrates the simple template, created for providing SWOT analysis. You can use it for your management courses as a tutorial for SWOT analysis. The tips, added to each section of a matrix are intended to help you to fill them with the information of the strengths and weaknesses of your training case, and do not forget, at the same time, about opportunities and threats. This template is one of a set of templates of SWOT matrices that can be found in the the ConceptDraw SWOT and TOWS diagrams solution. This solution used as part of simple project management software in ConceptDraw Office as advertising agency software or marketing management software.
Picture: SWOT Analysis Tool for Small Business
Use ConceptDraw DIAGRAM diagramming and business graphics software for drawing your own PM life cycle flow charts.
Picture: Program to Make Flow Chart
Related Solution:
Starting producing workflow diagram from template you save time and avoid the blank page syndrome. At first, the workflow template is set of rules for a workflow. The workflow symbols used in the specific case are part of workflow template. This is the subset of large standard collections of workflow symbols. The first part of workflow template is identification of symbols allowed in use in your specific case. The best way would be to collect them in your customized drawing collection of workflow symbols which used in your specific cases of workflow diagrams. Another way to create business process documents is using business process flow diagram which have similar purposes and have different visual notation.
ConceptDraw DIAGRAM is professional workflow diagram software with the rich extentions from ConceptDraw Solution Park. The basic solution for workflow diagramming is Workflow Diagrams Solution. It delivers a rich set of workflow diagram templates and samples help you draw diagrams e
Picture: Workflow Diagram Template
Related Solution:
Choose the business illustration design you love best, and sign our design your own style with Business and Finance Illustrations library from ConceptDraw DIAGRAM.
The Business and Finance solution contains 12 vector clipart libraries: Advertising, Business, Business people clipart, Business people figures, Currency, Mail and post, Management, Marketing, Money, Office, Project management, Time
Picture: Business and Finance Illustrations
Related Solution:
ConceptDraw DIAGRAM is the only application on the Macintosh platform, supplied with a comprehensive Cisco icon set. For graphic solutions that support Windows, only Microsoft Visio has a library of Cisco shapes. ConceptDraw DIAGRAM is a valuable option to many network professionals that use Macintosh computers or work in a combined Mac and PC environment.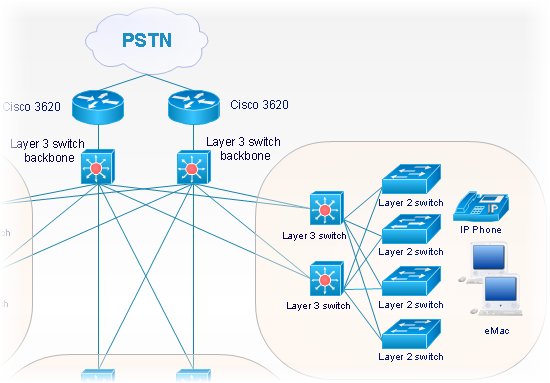
Picture: Cisco Network Objects in ConceptDraw DIAGRAM
Functional modeling allows to make complex business processes simple. One of the basic methods is IDEF0 and one of the most effective also. To create a business model, use flowchart symbols.
The IDEF0 library, supplied with ConceptDraw IDEF0 Diagrams solution contains 18 IDEF0 basic notation symbols. All symbols are the vector graphic images what means, that one can customize their size preserving the stable quality. Another library of IDEF0 symbols can be find out in the the Business Process Diagrams solution, included to the Business Processes section of ConceptDraw Solution Park. These libraries composed from just vector objects and are totally compatible. You can apply the IDEF0 symbols from both libraries at your flowcharts, if needed.
Picture: IDEF0 Flowchart Symbols
Related Solution:
Any work process visualized as a workflow diagram becomes easier-to-analyse. To visualize work processes regularly we recommend to use ConceptDraw DIAGRAM software extended with the Workflow Diagrams solution. This software contains features and technologies designed to draw workflow diagrams faster.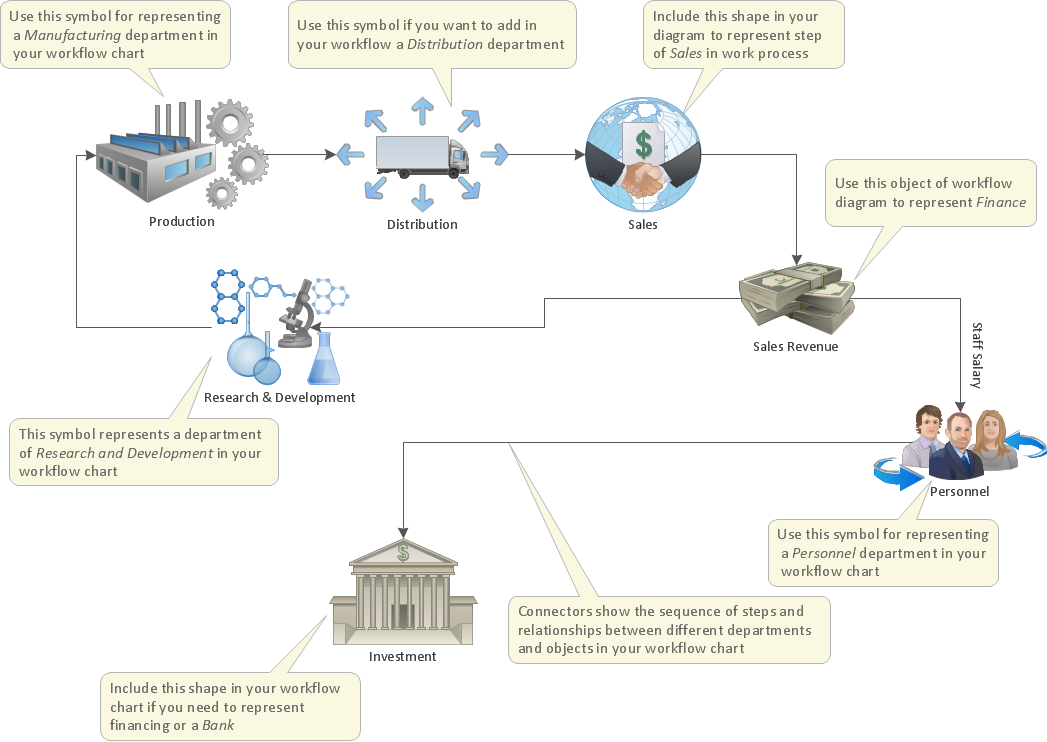
Picture: Work Process
Related Solution:
It can be tough to get straight into business papers and processes.Otherwise, you can learn how to create flowcharts for an accounting information system and visualize these documents. Accounting diagrams are clear and easy to understand for all the participants of the process.
There are symbols used for creating accounting flowcharts using ConceptDraw DIAGRAM and its Accounting Flowcharts solution. Accounting flow charts are a special kind of flow charts. Actually a variety of flowcharts are often used to facilitate many aspects of a workflow of accounting department. Accounting flowcharts are utilized to support creating accounting documentation, to depict positions responsible for fulfillment of each phase of accounting workflow.
Picture:
How to Create Flowcharts for an
Accounting Information System
Related Solution:
Computer networks nowadays are spread all across the world. The large number of parameters, such as geographic scale or communication protocols, can divide networks. One of the most common types of networks is called local area network (LAN). It convenient to represent network examples by means of diagrams.
This local area network (LAN) diagram provides an easy way to see the way the devices in a local network are interacted. The diagram uses a library containing specific symbols to represent network equipment , media and the end-user devices such as computers (PC, mac, laptop) , network printer, hubs, server and finally a modem. There are two types of network topologies: physical and logical. The current diagram represents precisely a physical type of LAN topology because it refers to the physical layout of a local network equipment.
Picture:
What is a Local Area Network?
Examples of LAN Diagrams
Related Solution:
Gant Chart is a graphical representation of tasks as segments on a time scale. It helps plan and monitor project development or resource allocation. The horizontal axis is a time scale, expressed either in absolute or relative time.
Picture: Gant Chart in Project Management
Related Solution:
ConceptDraw
MINDMAP 16