Simple Drawing Applications for Mac
Drawing Software
ConceptDraw gives the ability to draw simple diagrams:
- like flowcharts,
- block diagrams,
- bar charts,
- histograms,
- pie charts,
- divided bar diagrams,
- line graphs,
- area charts,
- scatter plots,
- circular arrows diagrams,
- Venn diagrams,
- bubble diagrams,
- concept maps,
- and others.
Basic Diagramming solution is a powerful tool for drawing business communication ideas and concepts, simple visual presentation of numerical data in the Mac environment.

Pic. 1. Drawing Applications for Mac
ConceptDraw DIAGRAM ector diagramming and business graphics software enhanced with with templates, samples and stencil libraries from ConceptDraw Solution Park helps you to easily draw flowcharts, block diagrams, bar charts, histograms, pie charts, divided bar diagrams, line graphs, area charts, scatter plots, circular arrows diagrams, Venn diagrams, bubble diagrams, concept maps, and others.

Pic. 2. Employee needs - Bubble diagram
Use ConceptDraw DIAGRAM with Solution Park to draw:
- you own diagrams,
- charts and graphs for graphic communication,
- explanation of business and personal ideas and concepts,
- simple visual presentation of numerical data,
- complex structures,
- logical relations,
- step-by-step flows of actions,
- operations or math algorithm.
NINE RELATED HOW TO's:
Working with information can be quite tedious, furthermore, some data can be quite difficult to perceive without any graphic representation. So, to facilitate your work, you can use business diagrams, such as simple flowcharts or Gantt charts for project management and orgcharts for clarifying your company structure. You can use a proper software, like ConceptDraw Pro, draw them on paper, or use whiteboards, but it is more convenient to use a digital tool.
This diagram shows a cross-functional flowchart that was made fore telecom service provider. A workflow of a common telecommunication service provider has a rather branched structure. Thus, it is useful to have a flow chart to visualize the sequences and interrelations of the work flow steps. Business process flowchart contains 17 processes and 4 decision points,that are distributed through 2 lines depicting the participants involved. Also there are connectors that show the data flow within processes. This flowchart displays a detailed model of the telecom service trading process, as well as all participants in the process and how they interact with each other.
Picture: Business diagrams & Org Charts with ConceptDraw DIAGRAM
ConceptDraw DIAGRAM diagramming and vector drawing software extended with Mathematics solution from the Science and Education area is the best for creating: mathematical diagrams, graphics, tape diagrams various mathematical illustrations of any complexity quick and easy.
Mathematics solution provides 3 libraries: Plane Geometry Library, Solid Geometry Library, Trigonometric Functions Library.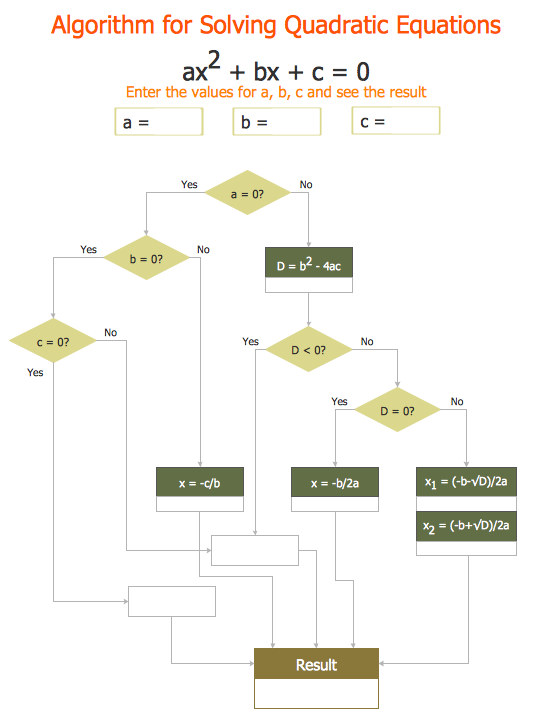
Picture: Mathematical Diagrams
Related Solution:
For database modeling, such as graph databases and/or relational databases modelling, for business rules modeling, for XML-Schemas modeling, data warehouses modeling or for web forms modeling — it does not matter what your reasons for creating the ORM diagrams are, you can always make any needed ORM-related drawings with the aid of ConceptDraw DIAGRAM and ConceptDraw STORE that can simplify your work by providing the so-called “Object-Role Modeling (ORM) solution” as a great ORM diagram drawing tool, including the ORM-related vector stencils libraries, ORM diagram samples and templates as well as learning media.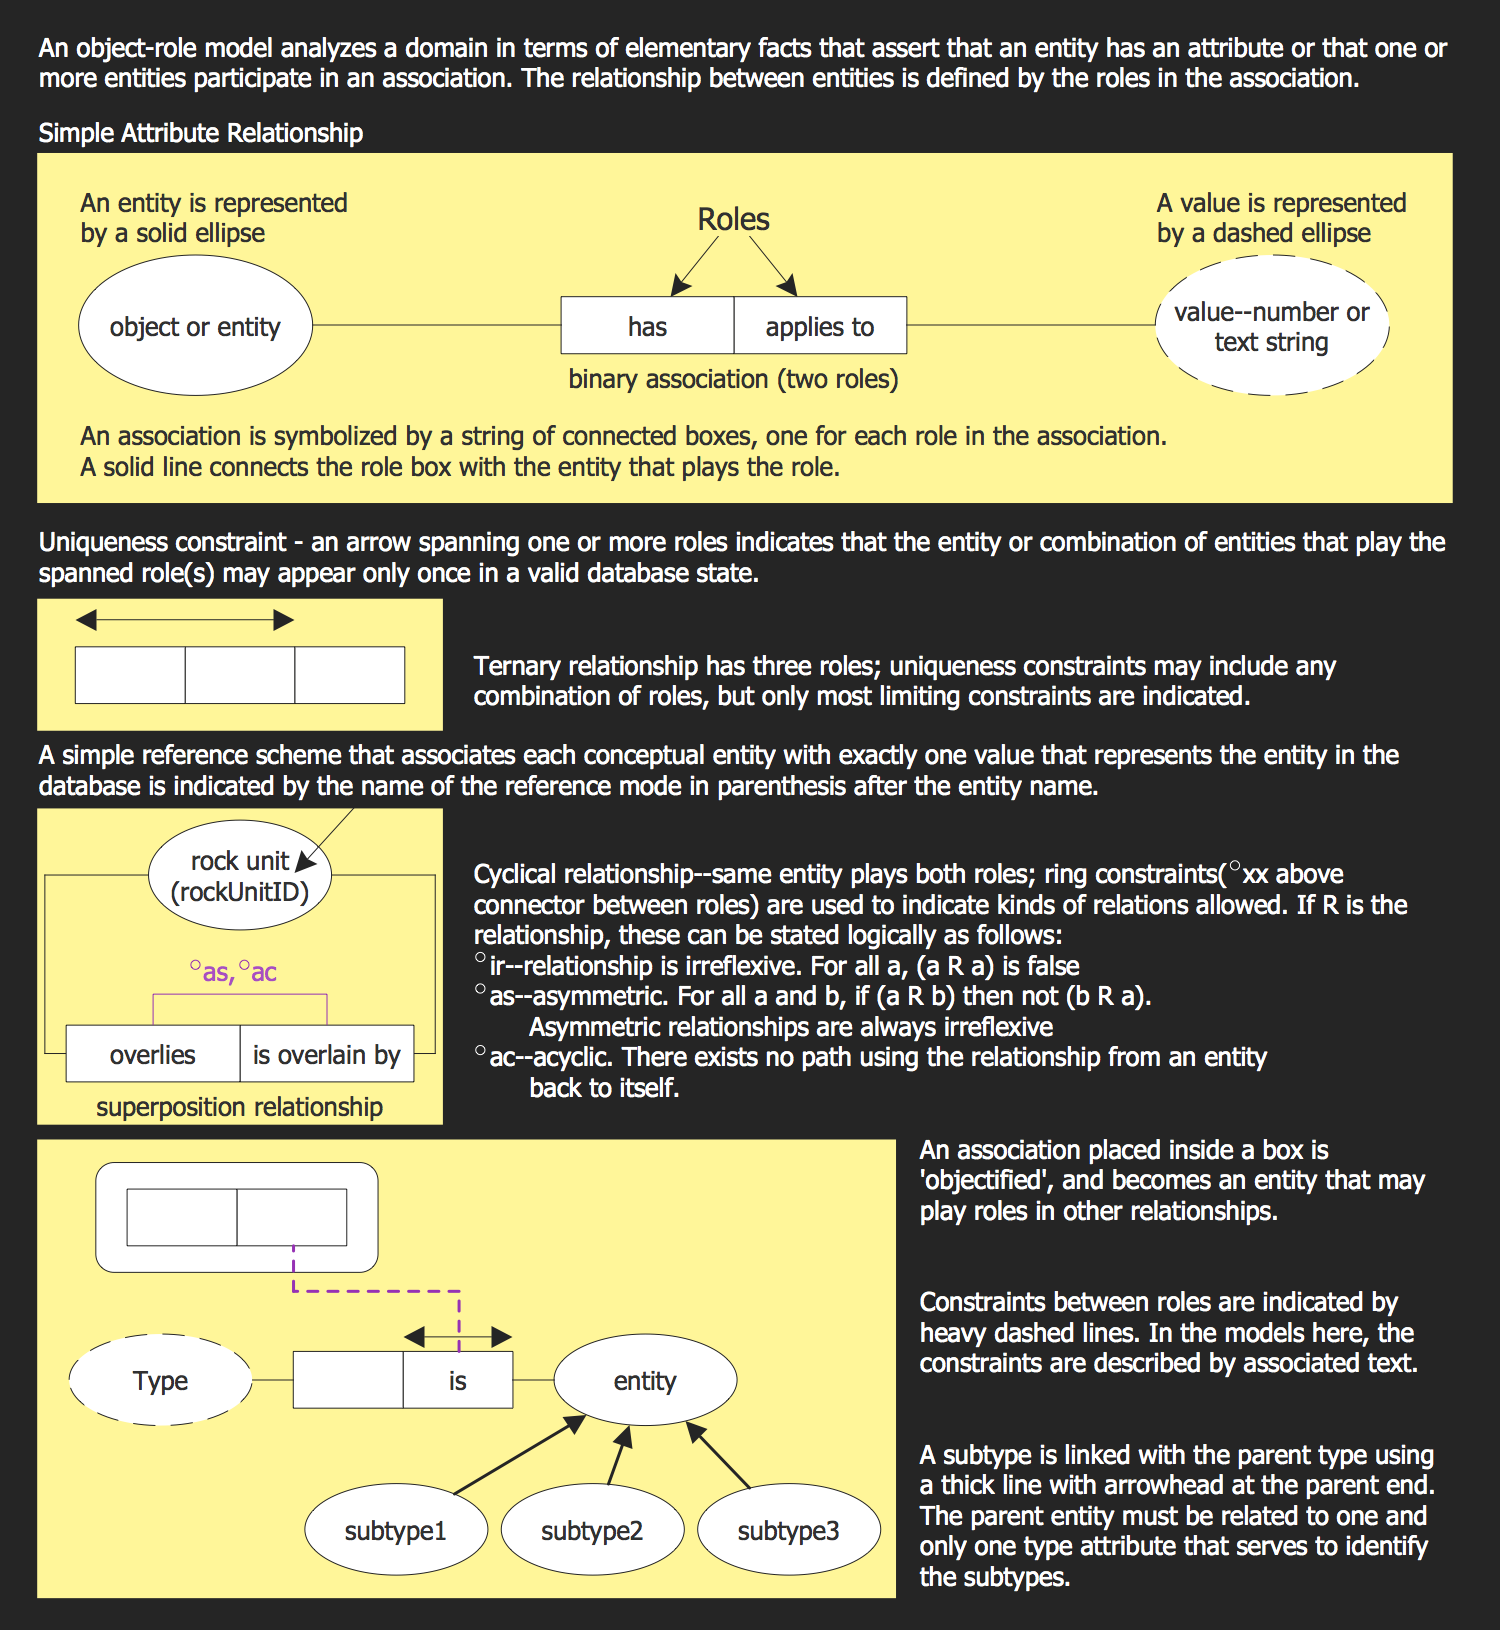
Picture: Software Engineering
Related Solution:
Use Case Diagram Taxi Service UML. This sample was created in ConceptDraw DIAGRAM diagramming and vector drawing software using the UML Use Case Diagram library of the Rapid UML Solution from the Software Development area of ConceptDraw Solution Park.
This sample shows the work of the taxi service and is used by taxi stations, by airports, in the tourism field and delivery service.
Picture: UML Block Diagram
Related Solution:
How to design a Bubble Chart? It’s very easy! All that you need is a powerful software. Never before creation of a Bubble Chart wasn’t so easy as now with tools of Business Diagrams Solution from the Management Area for ConceptDraw Solution Park.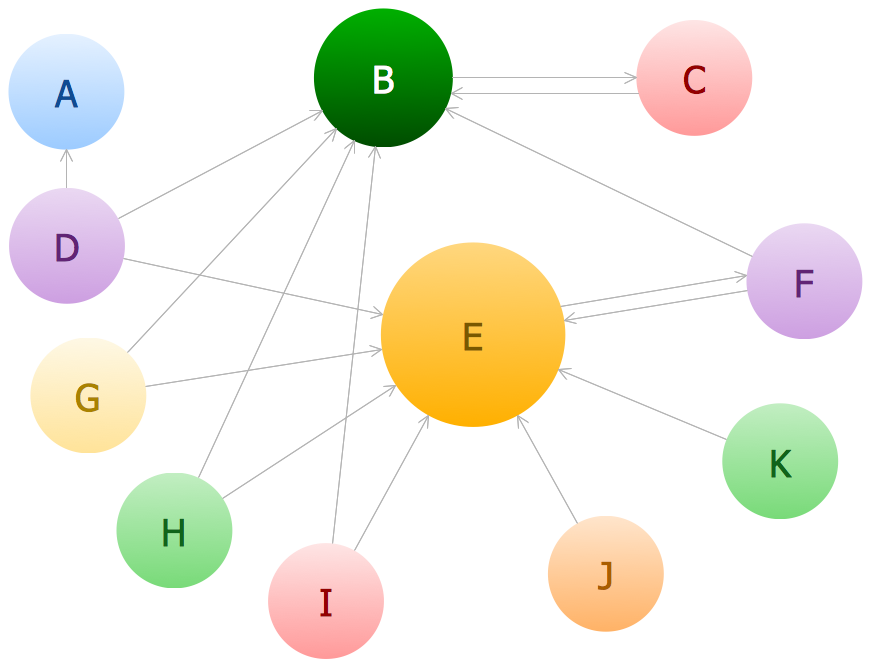
Picture: Bubble Chart
Related Solution:
A pie chart or a circle graph is a circular chart divided into sectors, illustrating numerical proportion. In a pie chart, the arc length of each sector and consequently its central angle and area, is proportional to the quantity it represents.
Pie chart examples and templates created using ConceptDraw DIAGRAM software helps you get closer with pie charts and find pie chart examples suite your needs.
Picture: Pie Chart Examples and Templates
Related Solution:
You need to draw the Circular Arrows Diagram, Segmented Diagram or Circular Flow Diagram? Any of these diagrams can be fast and easy designed in ConceptDraw DIAGRAM software, which offers the Business Diagrams Solution from the Management Area with extensive drawing tools, predesigned samples and circular flow diagram template. The use of ready template is the easiest way of drawing.
Picture: Circular Flow Diagram Template
Related Solution:
ConceptDraw DIAGRAM diagramming and vector drawing software extended with Physics solution from the Science and Education area is a powerful software for creating various physics diagrams.
Physics solution provides all tools that you can need for physics diagrams designing. It includes 3 libraries with predesigned vector physics symbols: Optics Library, Mechanics Library and Nuclear Physics Library.
Picture: Physics Symbols
Related Solution:
If you want to find a way to understand complex things in minutes, you should try to visualize data. One of the most useful tool for this is creating a flowchart, which is a diagram representing stages of some process in sequential order. There are so many possible uses of flowcharts and you can find tons of flow charts examples and predesigned templates on the Internet. Warehouse flowchart is often used for describing workflow and business process mapping. Using your imagination, you can simplify your job or daily routine with flowcharts.
Warehouse flowcharts are used to document product and information flow between sources of supply and consumers. The flowchart provides the staged guidance on how to manage each aspect of warehousing and describes such aspects as receiving of supplies; control of quality; shipment and storage and corresponding document flow. Warehouse flowchart, being actual is a good source of information. It indicates the stepwise way to complete the warehouse and inventory management process flow. Also it can be very useful for an inventory and audit procedures.
Picture: Flow Chart Example: Warehouse Flowchart
Related Solution:
