
Sample 1. Physics Symbols — Optics Library Design Elements
Mechanics Library contains 29 vector shapes of mechanics objects.

Sample 2. Physics Symbols — Mechanics Library Design Elements
Nuclear Physics Library contains 39 vector shapes of nuclear physics symbols.

Sample 3. Physics Symbols — Nuclear Physics Library Design Elements
Simply drag the physics symbols, optics or mechanics objects and symbols from the Physics solution libraries to your document, arrange objects, type the text, add colors, and make other needed changes to design your own professional looking physics diagram in minutes. Use it successfully in your education, scientific, and any other activity.

Sample 4. Physics Solution — Proton Chain Reaction
This sample was created in ConceptDraw DIAGRAM using the physics symbols from the Physics Solution and visually demonstrates Proton Chain Reaction. An experienced user spent 5 minutes creating this sample.
The physics diagrams designed with ConceptDraw DIAGRAM are vector graphic documents and are available for reviewing, modifying, converting to a variety of formats (image, HTML, PDF file, MS PowerPoint Presentation, Adobe Flash or MS Visio), printing and send via e-mail in one moment.
TEN RELATED HOW TO's:
To support you in your tasks you can use the power of ConceptDraw DIAGRAM providing
intelligent vector graphics that are useful for management diagramming and
ConceptDraw MINDMAP for key management mind maps.
Picture: Business Productivity - Management
Related Solution:
The most easier way of creating the visually engaging and informative Sales Process Flowchart is to create the new ConceptDraw document and to use the predesigned vector symbols offered in 6 libraries of the Sales Flowchart Solution. There are more than six types of sales process flow diagrams, ConceptDraw DIAGRAM software is flowchart maker which include six collections of extended flowchart symbols for effective diagramming. There are main collections of color coded flowchart symbols: Sales Department, Sales Steps, Sales Workflow, Sales Symbols and special set of Sales Arrows and Sales Flowchart.
Picture: Sales Process Flowchart Symbols
Related Solution:
Quality Control Chart Software (ISO Flowcharting) - ConceptDraw DIAGRAM extended with Total Quality Management TQM Diagrams Solution from the Quality Management Area is the best diagramming and vector drawing software that allows you to draw the quality control charts quick and easy.
The quality control chart is a graphic that illustrates the accordance of processes or products to the intended specifications and degree of differences from them. Depending on what type of data you need analyze, there are used different types of quality control charts: X-bar charts, S charts, Np charts.
Picture: Quality Control Chart Software — ISO Flowcharting
Related Solution:
What is the accounting cycle? The accounting cycle is a sequence of steps that occur in the accounting period and include the processes of identifying, collecting, analyzing documents, recording transactions, classifying, summarizing, and reporting financial information of an organization.
Picture: What is the Accounting Cycle?
Related Solution:
Create flowcharts, flow charts, and more with ConceptDraw flowchart software.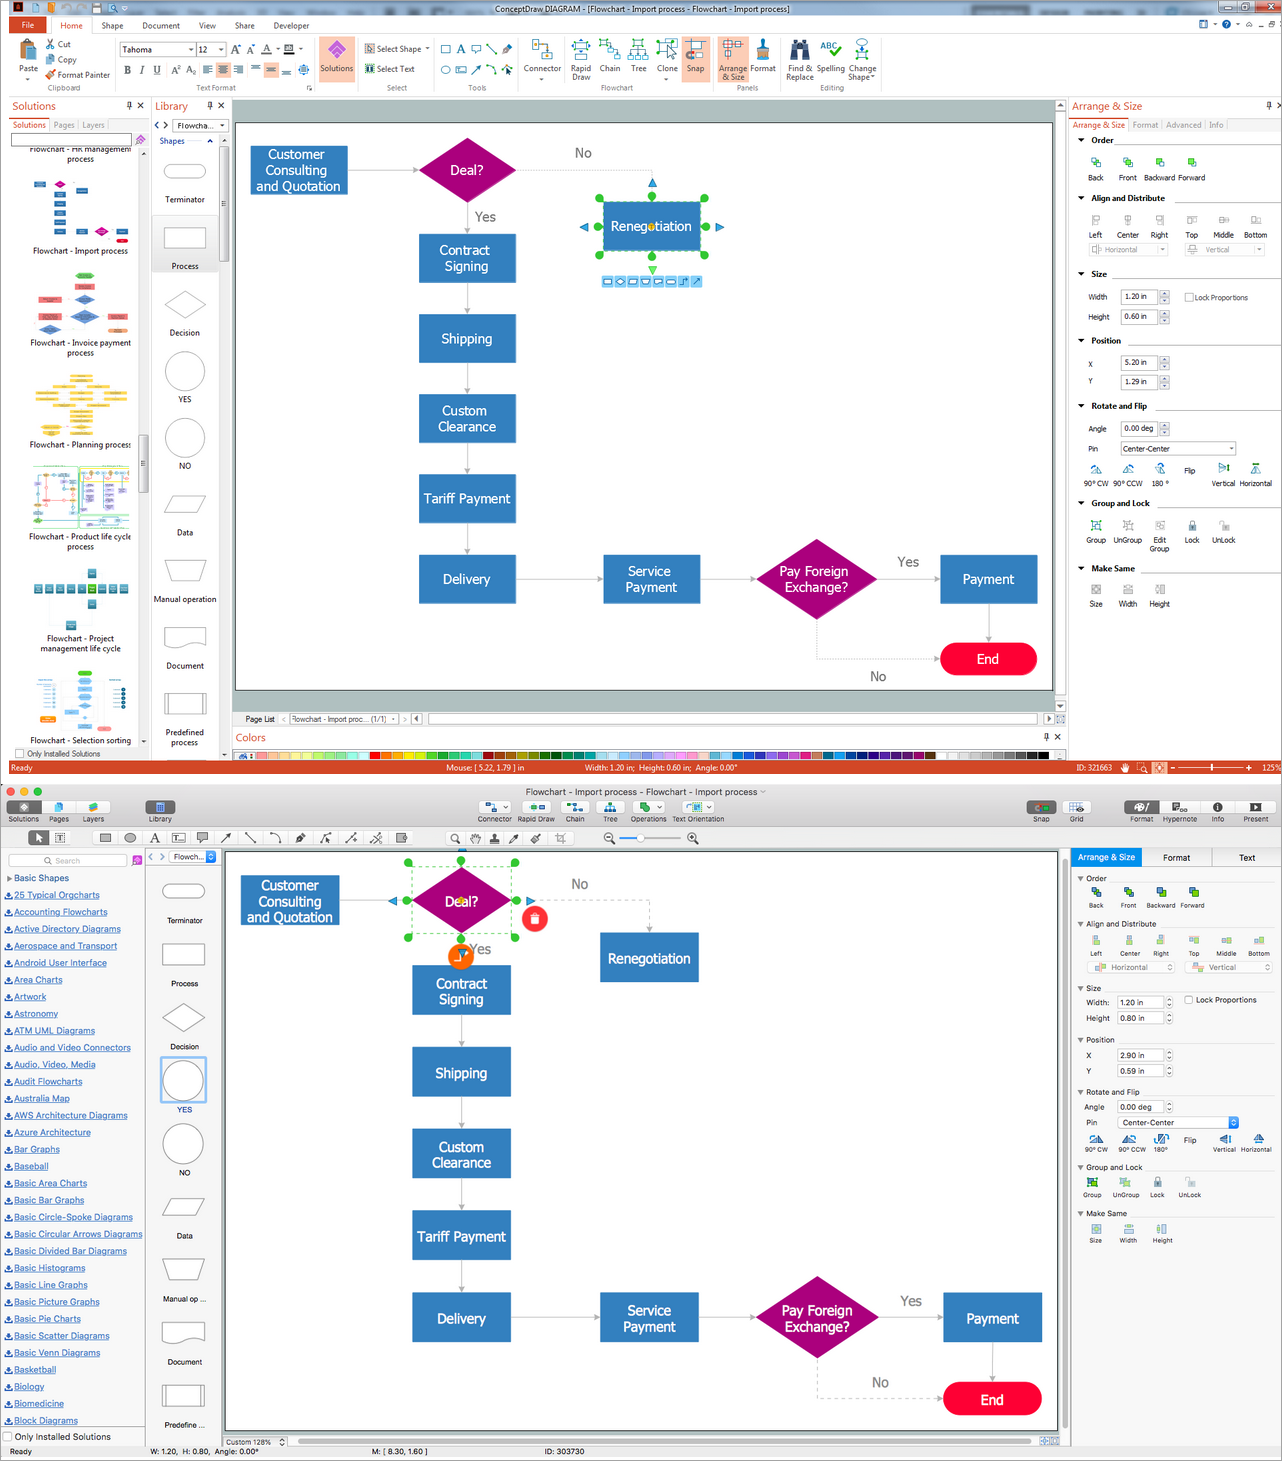
Picture: Basic Diagramming. Flowchart Software
Related Solution:
You can see that when you rotate a group, connectors change their angle, keeping their position inside of the grouped objects. If you decide to ungroup the objects, the connectors will adjust to keep lines parallel to the edges of the sheet.
The magic of ConceptDraw Arrows10’s rotating group containing connectors, makes complex diagramming simple and easy.
The way to connect objects has never been easier.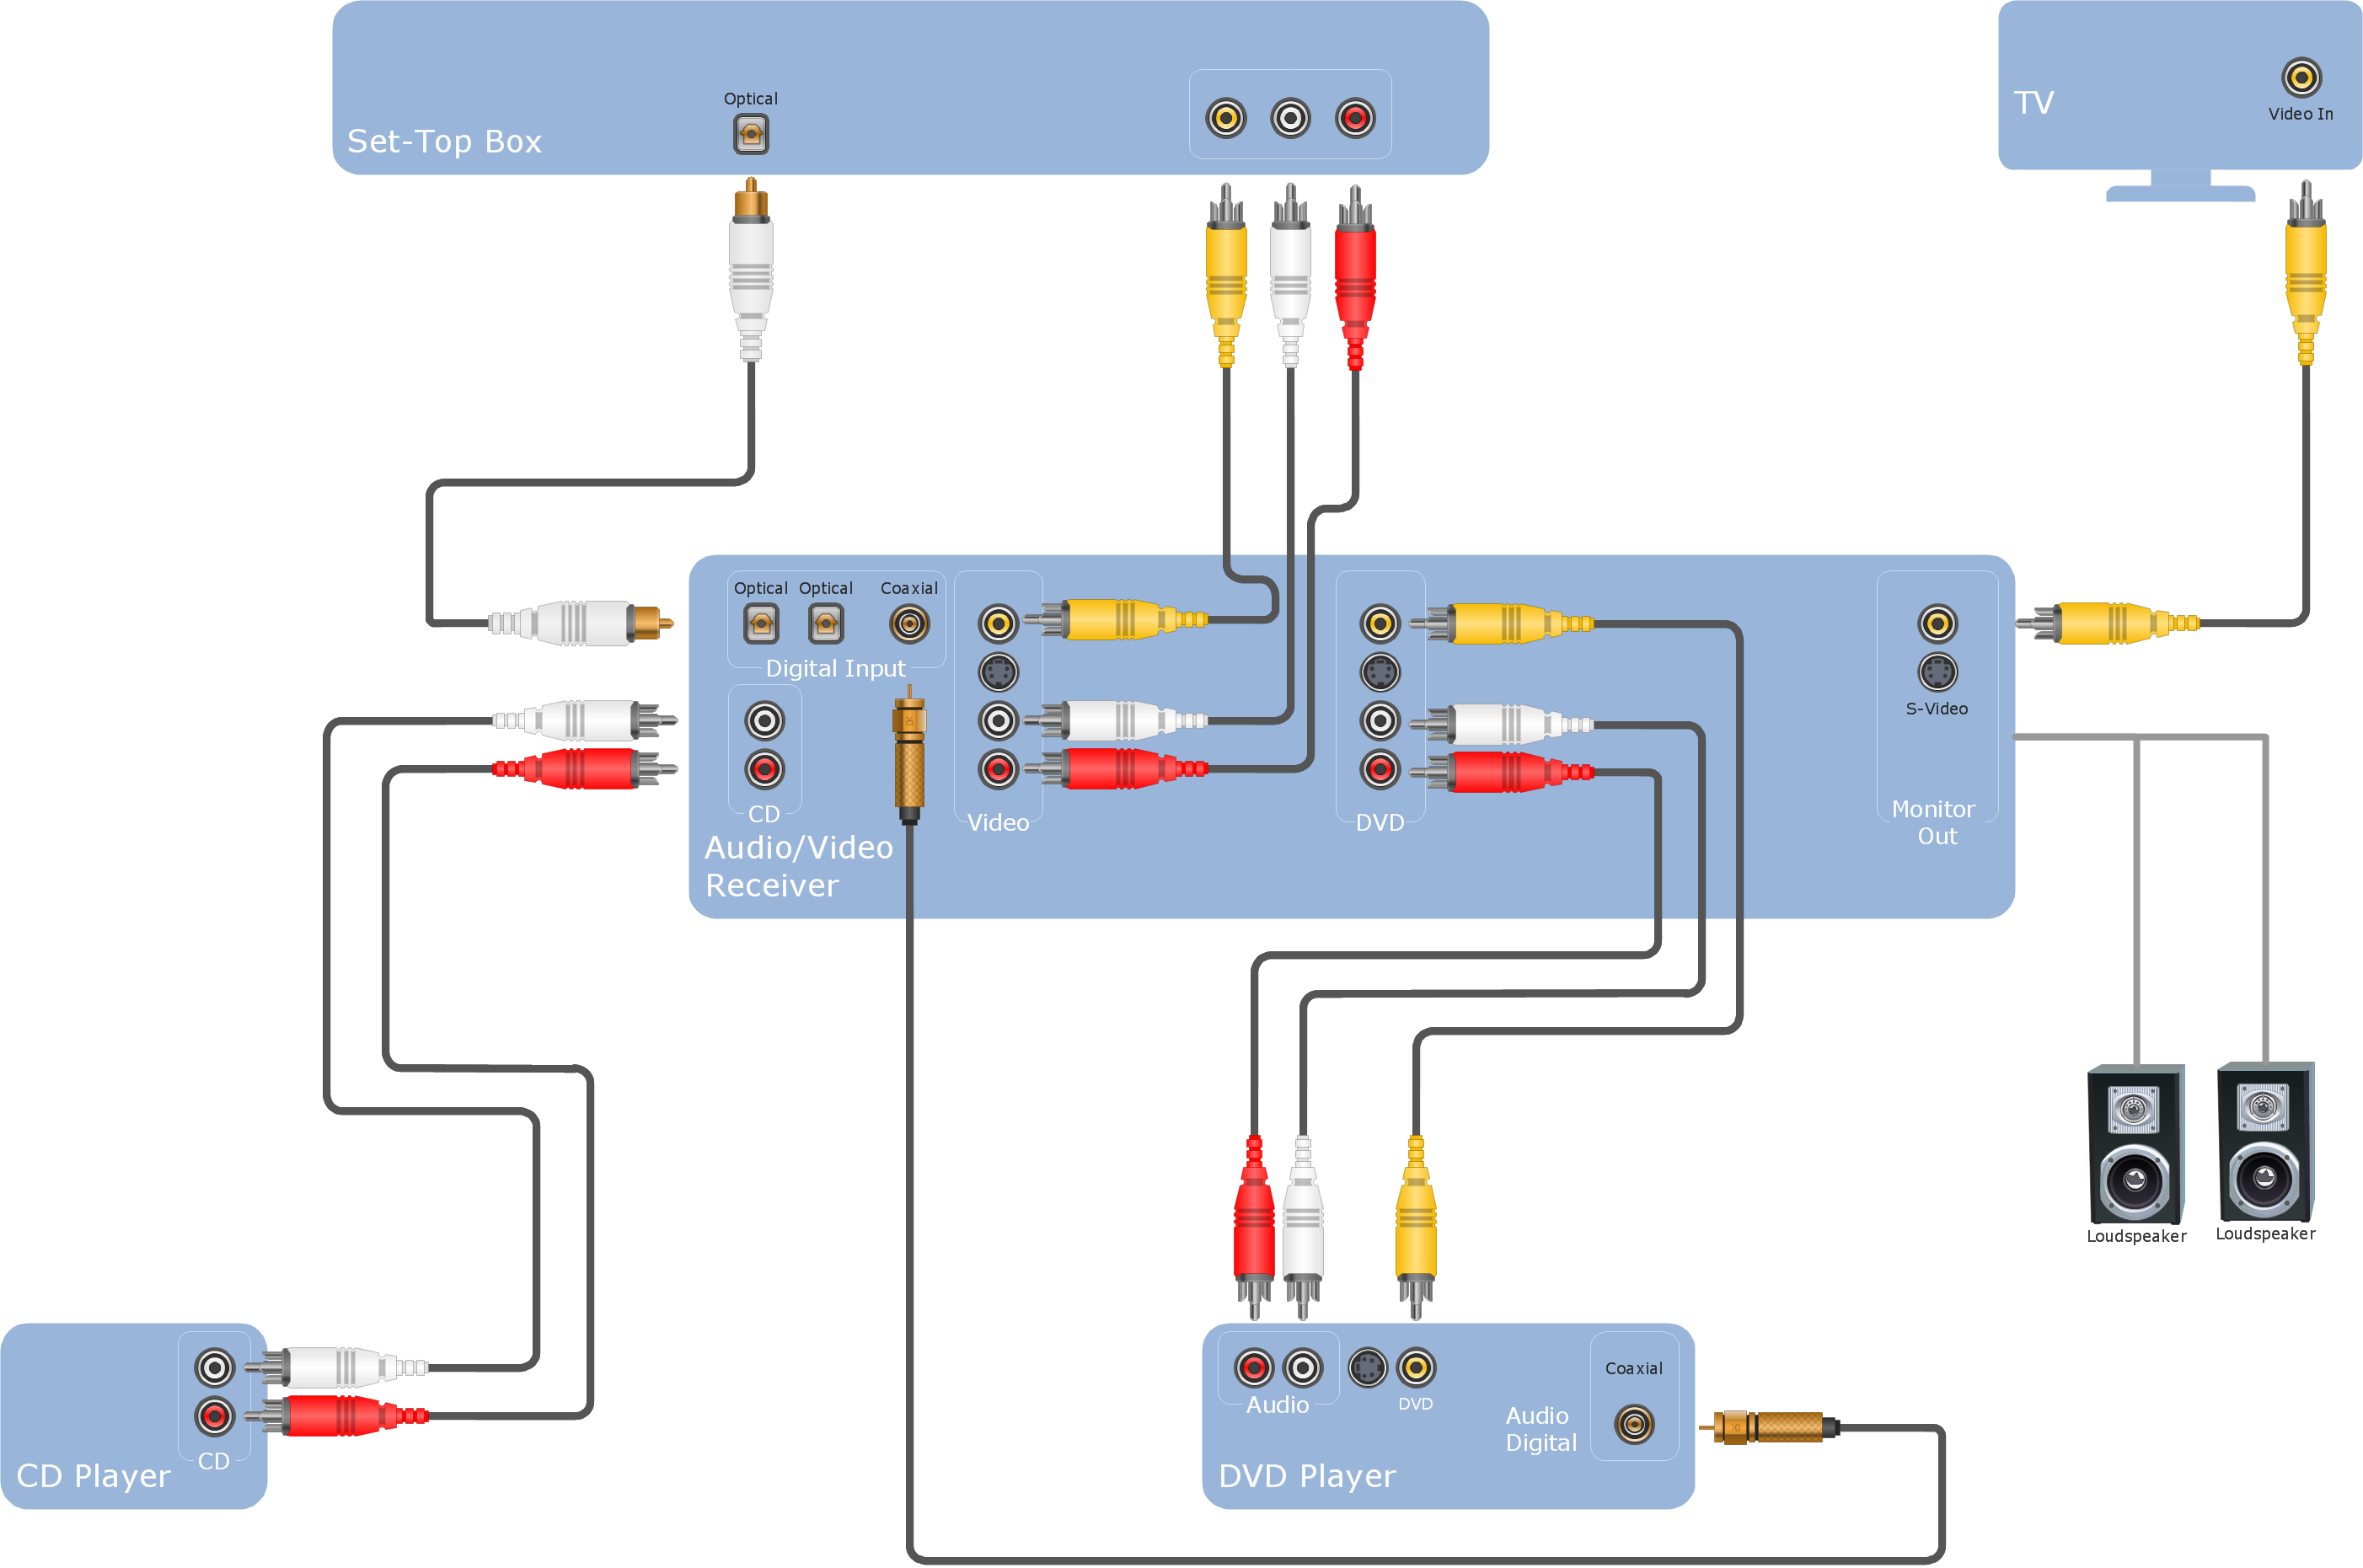
Picture: ConceptDraw Arrows10 Technology
When trying to figure out the nature of the problems occurring within a project, there are many ways to develop such understanding. One of the most common ways to document processes for further improvement is to draw a process flowchart, which depicts the activities of the process arranged in sequential order — this is business process management. ConceptDraw DIAGRAM is business process mapping software with impressive range of productivity features for business process management and classic project management. This business process management software is helpful for many purposes from different payment processes, or manufacturing processes to chemical processes. Business process mapping flowcharts helps clarify the actual workflow of different people engaged in the same process. This samples were made with ConceptDraw DIAGRAM — business process mapping software for flowcharting and used as classic visio alternative because its briefly named "visio for mac" and for windows, this sort of software named the business process management tools.
This flowchart diagram shows a process flow of project management. The diagram that is presented here depicts the project life cycle that is basic for the most of project management methods. Breaking a project into phases allows to track it in the proper manner. Through separation on phases, the total workflow of a project is divided into some foreseeable components, thus making it easier to follow the project status. A project life cycle commonly includes: initiation, definition, design, development and implementation phases. Distinguished method to show parallel and interdependent processes, as well as project life cycle relationships. A flowchart diagram is often used as visual guide to project. For instance, it used by marketing project management software for visualizing stages of marketing activities or as project management workflow tools. Created with ConceptDraw DIAGRAM — business process mapping software which is flowcharting visio alternative or shortly its visio for mac, this sort of software platform often named the business process management tools.
Picture: Process Flowchart: A Step-by-Step Comprehensive Guide
Related Solution:
These vector illustrations and cliparts are created for drawing the Project management Illustrations and contain plenty of project management design elements. The clipart library Project management includes 35 icons.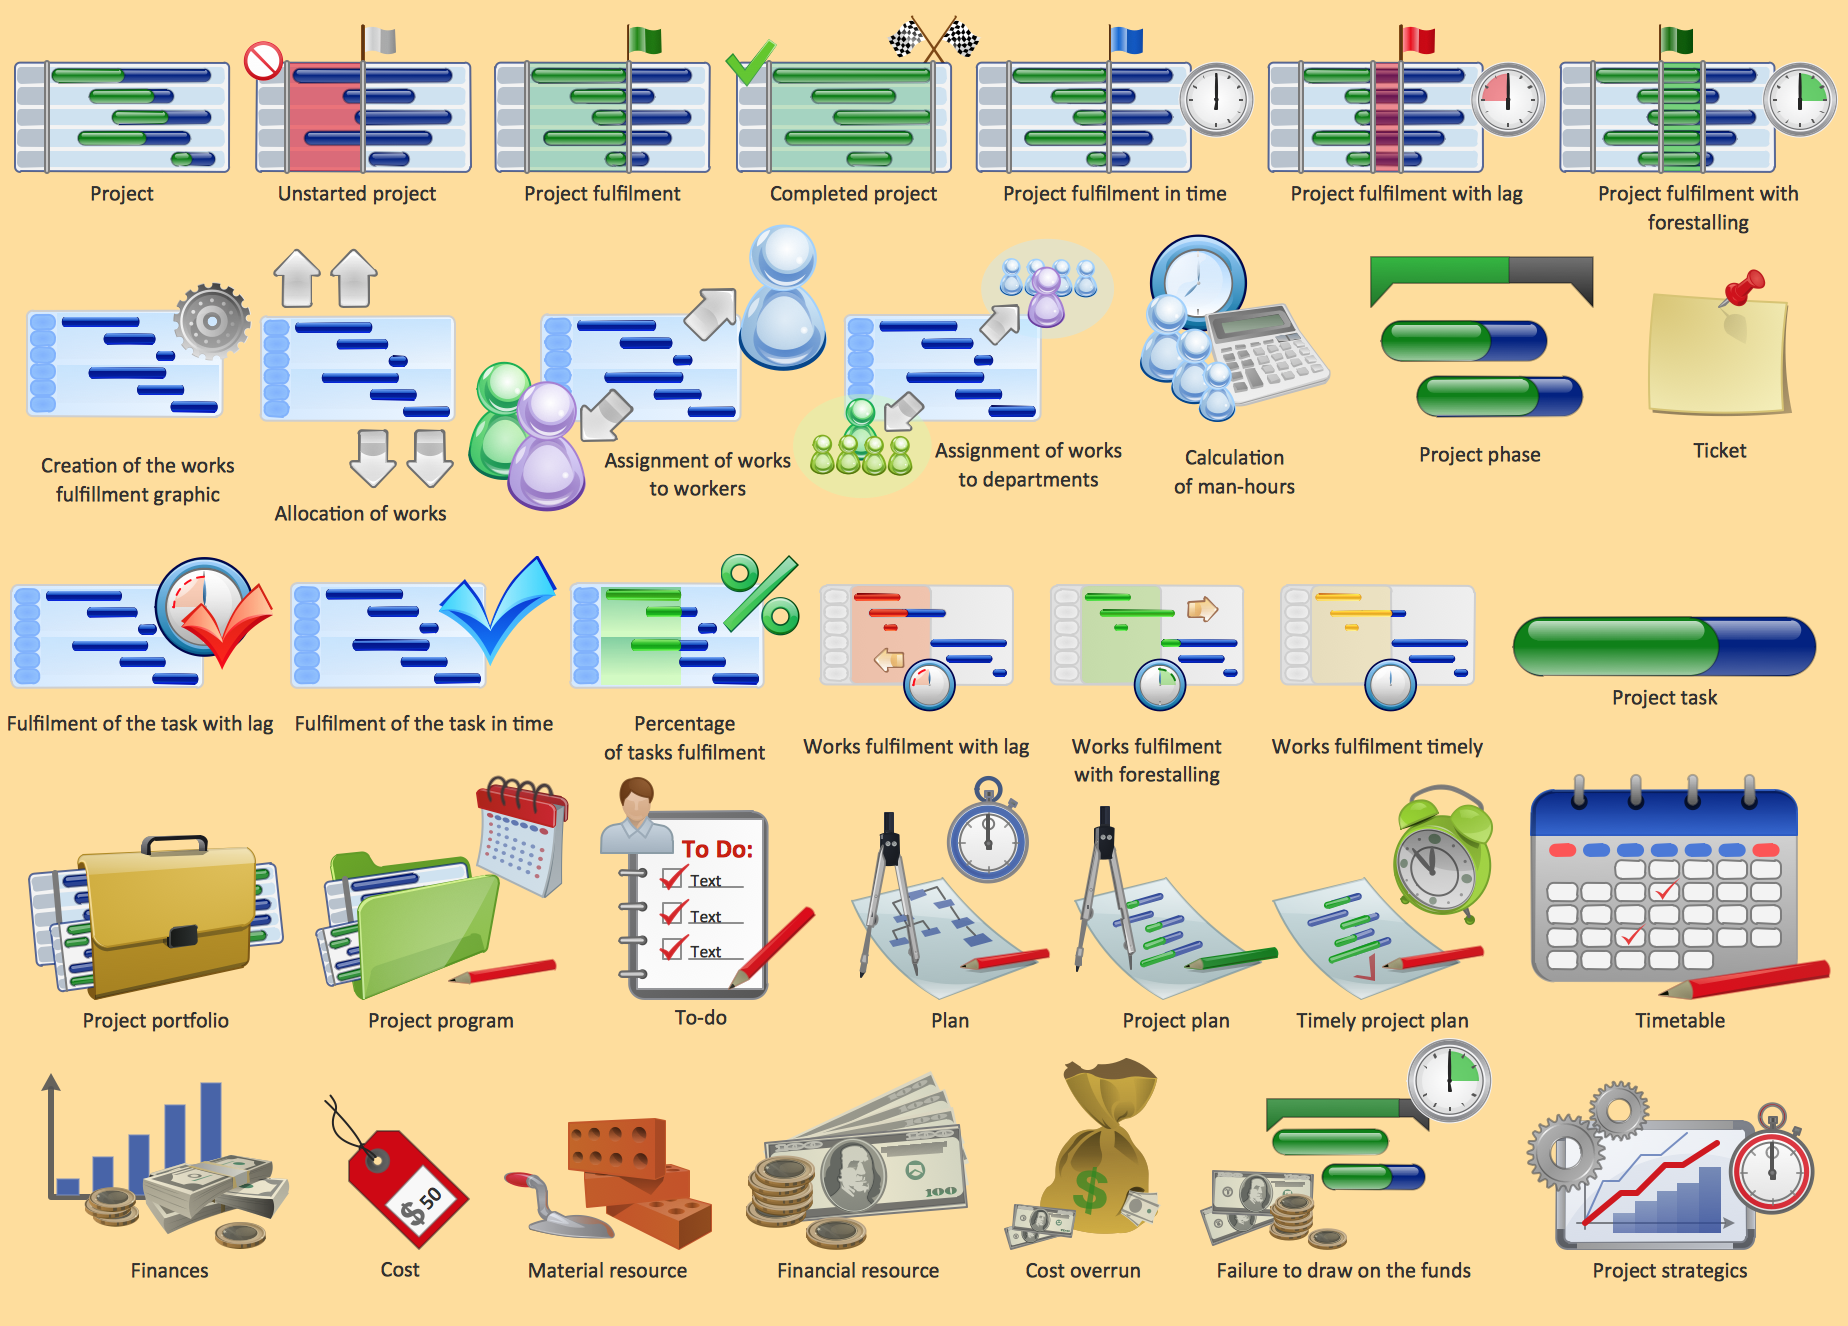
Picture: Project management - Design Elements
Related Solution:
Business People Clipart - Business and Finance solution from Illustration area of ConceptDraw Solution Park.
Use it to quick draw illustrations, diagrams and infographics for your business documents, presentations and websites.
The vector stencils library Business People Clipart includes 12 images.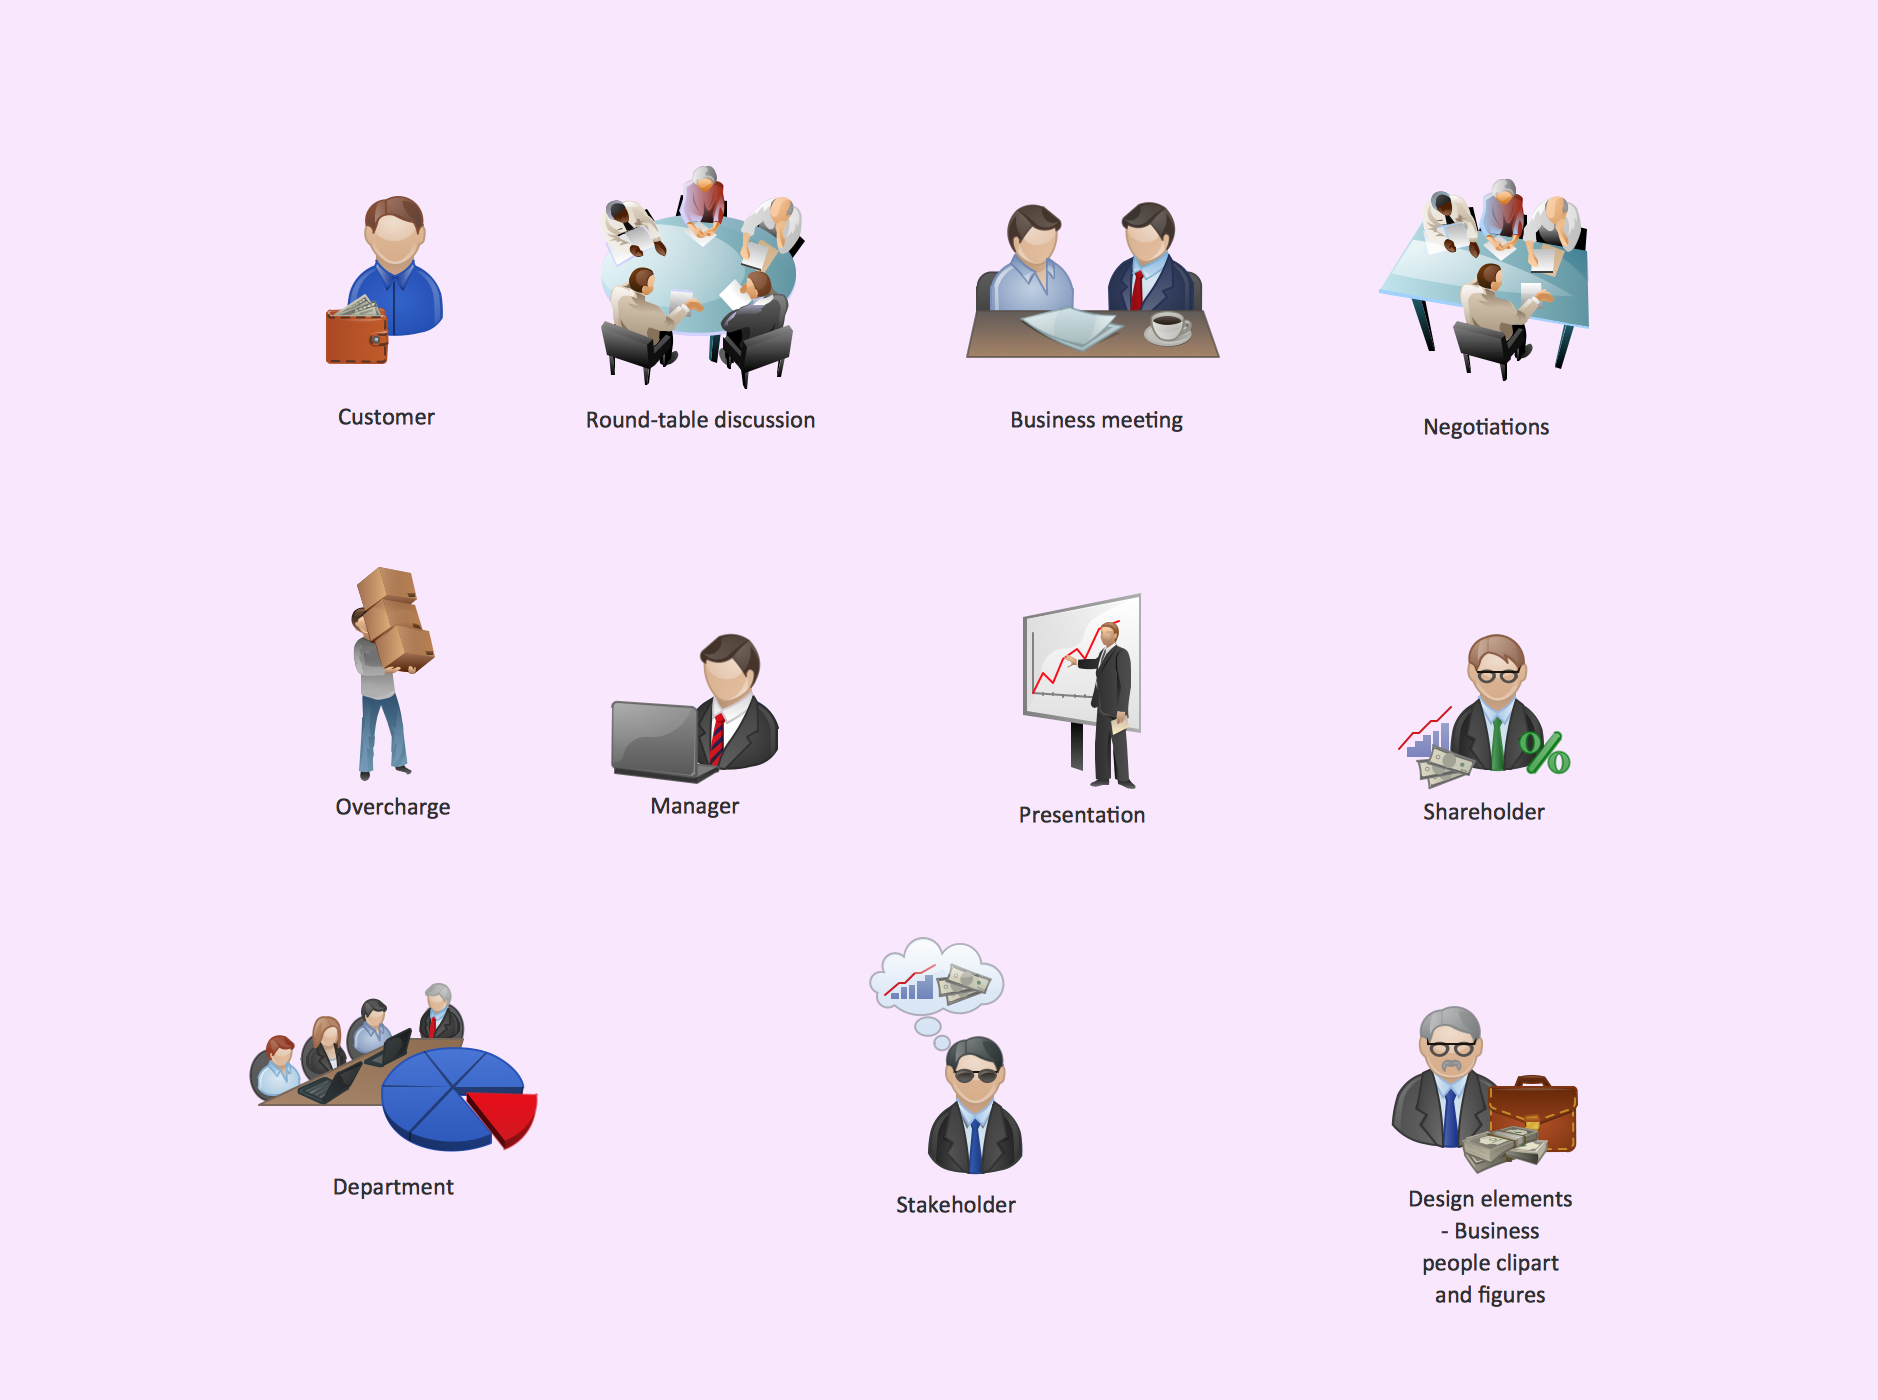
Picture: Business People Clipart
Related Solution:
Venn diagrams are illustrations used in the branch of mathematics known as set theory.
Use ConceptDraw DIAGRAM to quick and easy design your own Venn Diagram of any complexity.
Picture: Venn Diagram
Related Solution:


