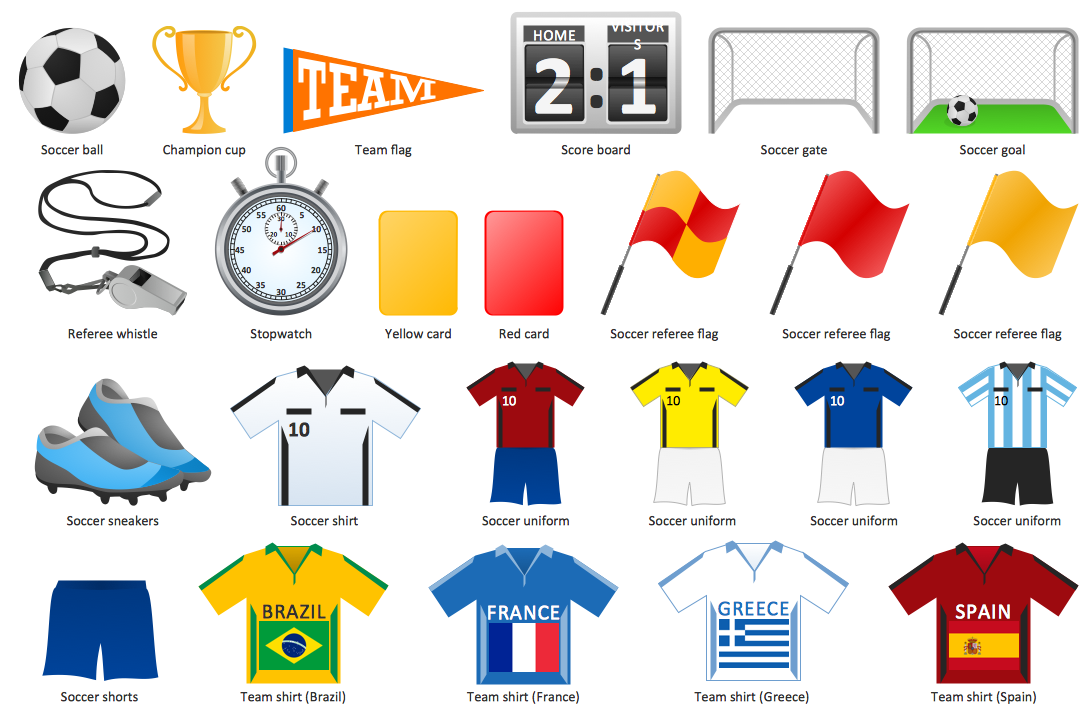
Sample 1. Soccer/Football
The Soccer (Football) Pictograms library available in the Soccer solution contains 27 vector clipart.

Sample 2. Soccer/Football Pictograms
The Soccer (Football) Silhouettes library available in the Soccer solution contains 9 vector objects.

Sample 3. Soccer/Football Silhouettes
The Soccer solution helps you quickly create your own original soccer illustrations, presentation slides, website, and blog pages using the ConceptDraw DIAGRAM diagramming and vector drawing software.
All source documents are vector graphic documents. They are available for reviewing, modifying, or converting to a variety of formats (PDF file, MS PowerPoint, MS Visio, and many other graphic formats) from the ConceptDraw STORE. The Soccer Solution is available for all ConceptDraw DIAGRAM or later users.
TEN RELATED HOW TO's:
This sample shows the Scatter Plot without missing categories. It’s very important to no miss the data, because this can have the grave negative consequences. The data on the Scatter Chart are represented as points with two values of variables in the Cartesian coordinates. This sample can be used in the engineering, business, statistics, analytics, at the creating the financial and other types of reports.
Picture: Blank Scatter Plot
Related Solution:
Electrical Engineering Solution used together with ConceptDraw DIAGRAM drawing facilities makes short a work of drawing various electrical and electronic circuit schemes. A library of vector objects composed from symbols of Analog and Digital Logic elements of electric circuit includes 40 symbolic images of logic gates, bistable switches of bi-stable electric current, circuit controllers, amplifiers, regulators, generators, etc. All of them can be applied in electronic circuit schemes for showing both analog and digital elements of the circuit.
Electrical Engineering Solution used together with ConceptDraw DIAGRAM drawing facilities makes short a work of drawing various electrical and electronic circuit schemes. A library of vector objects composed from symbols of Analog and Digital Logic elements of electric circuit includes 40 symbolic images of logic gates, bistable switches of bi-stable electric current, circuit controllers, amplifiers, regulators, generators, etc. All of them can be applied in electronic circuit schemes for showing both analog and digital elements of the circuit.
Picture:
Electrical Diagram Symbols F.A.Q.
How to Use Electrical ConceptDraw Diagram Software
Related Solution:
Have you ever created the fire plans on the base of Fire Evacuation Plan Template? It's incredibly convenient and time-saving way. Let's try to make sure this with Fire and Emergency Plans solution for ConceptDraw DIAGRAM software.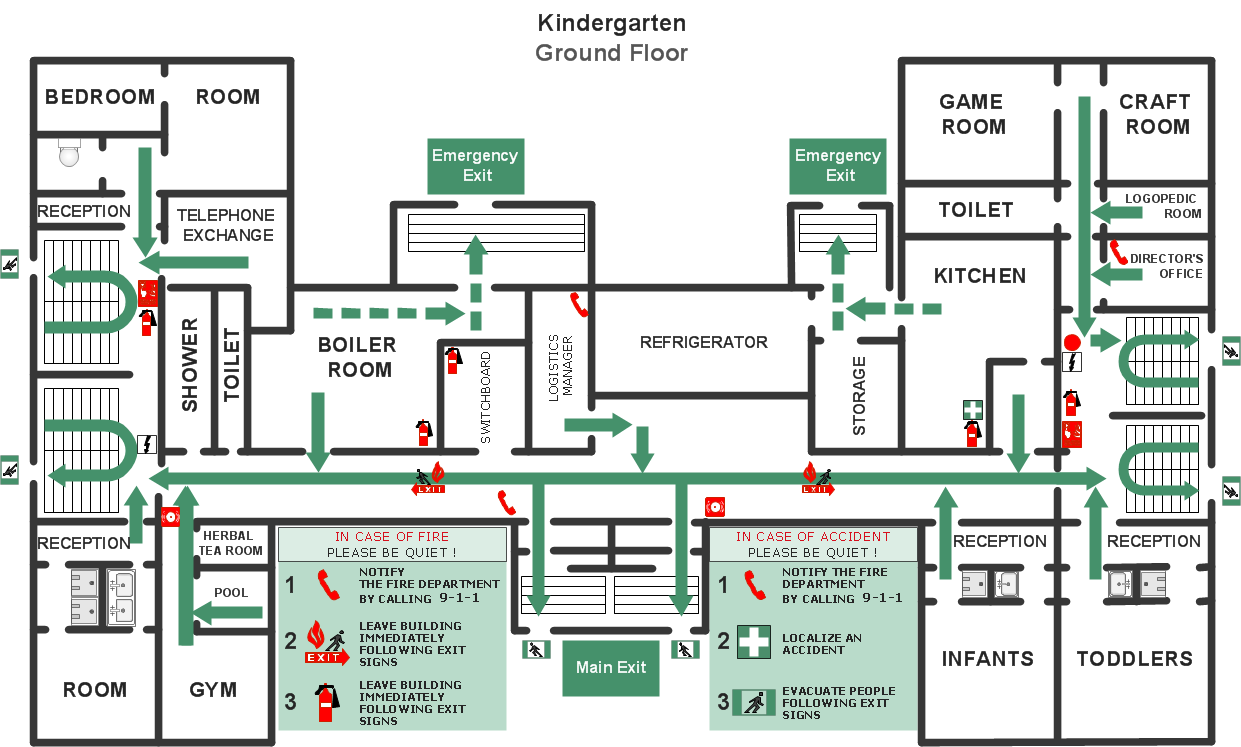
Picture: Fire Evacuation Plan Template
Related Solution:
ConceptDraw DIAGRAM software extended with the Baseball solution delivers libraries, templates and samples allowing baseball fans or specialists to draw baseball-related schemas in minutes.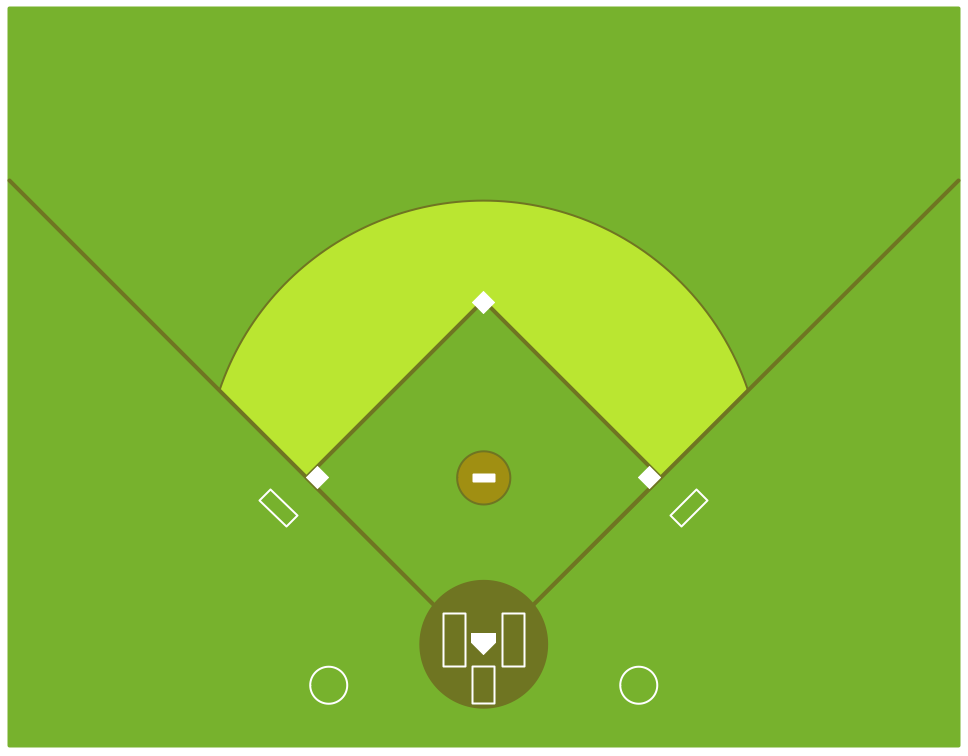
Picture: Colored Baseball Field Diagram
Related Solution:
ConceptDraw DIAGRAM software extended with the Football solution delivers a set of samples depict the most popular offenses, and libraries and templates allowing you complete this set with all offenses you know, or maybe invent a new one.A complete set of predesigned fields and positions make drawing offense diagram as quickly as with pen and paper.-Sample.png)
Picture: Pro Set Formation (Offense) Diagram
Related Solution:
Living room is the place where all family comes together, where receive guests. The interior of the living room complements the piano which helps to create a warm atmosphere. The piano is not just a musical instrument, in the room interior it becomes the most noticeable detail. The piano always organically entered in any interior.
Best Interior Design Software for Mac OS&Windows ConceptDraw DIAGRAM allows you design the interior of your dreams quick and easy.
Picture: Living Room. Piano in plan
Related Solution:
The AWS Architecture Diagrams solution includes icons, sample and templates for several Amazon Web Services products and resources, to be used when creating architecture diagrams. The icons are designed to be simple so that you can easily incorporate them in your diagrams and put them in your whitepapers, presentations, datasheets, posters or any technical material you like.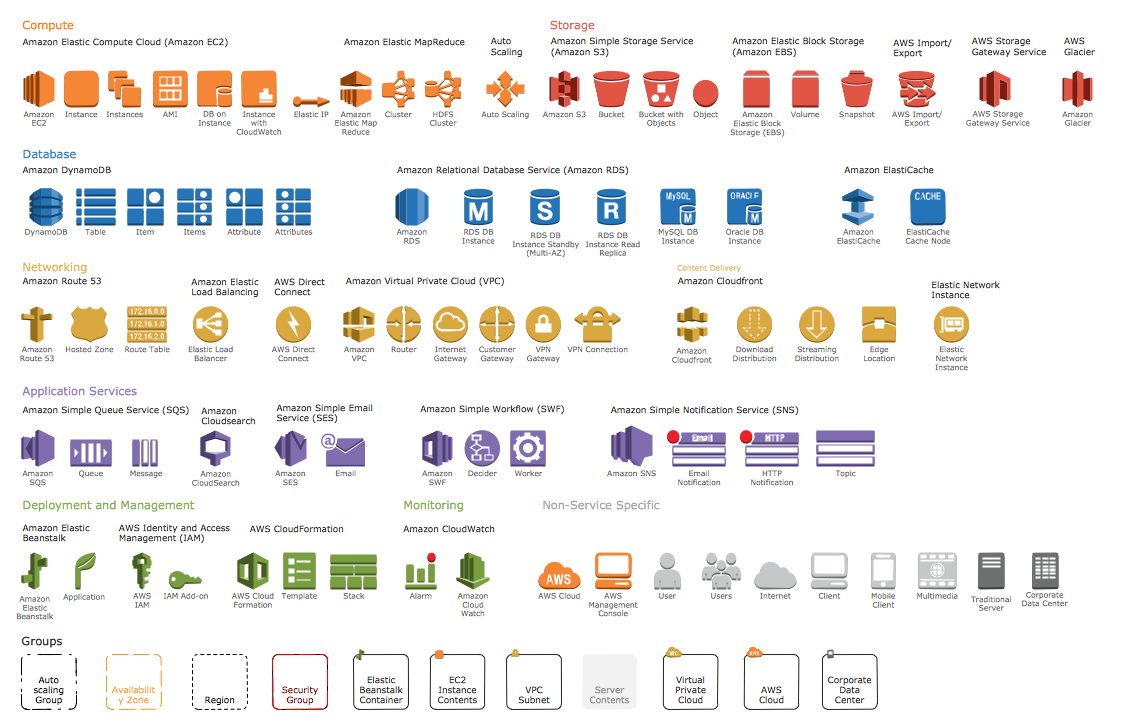
Picture: AWS Simple Icons for Architecture Diagrams
Chore chart. Draw perfect-looking chore chart. Free chore chart samples. All about chore charts.
Picture: Chore charts with ConceptDraw DIAGRAM
Usually designing of maps, including the USA Map is a quite complex, long and labour-intensive process. But now we have an excellent possibility to make it easier with ConceptDraw DIAGRAM diagramming and vector drawing software extended with powerful USA Maps Solution from the Maps Area of ConceptDraw Solution Park.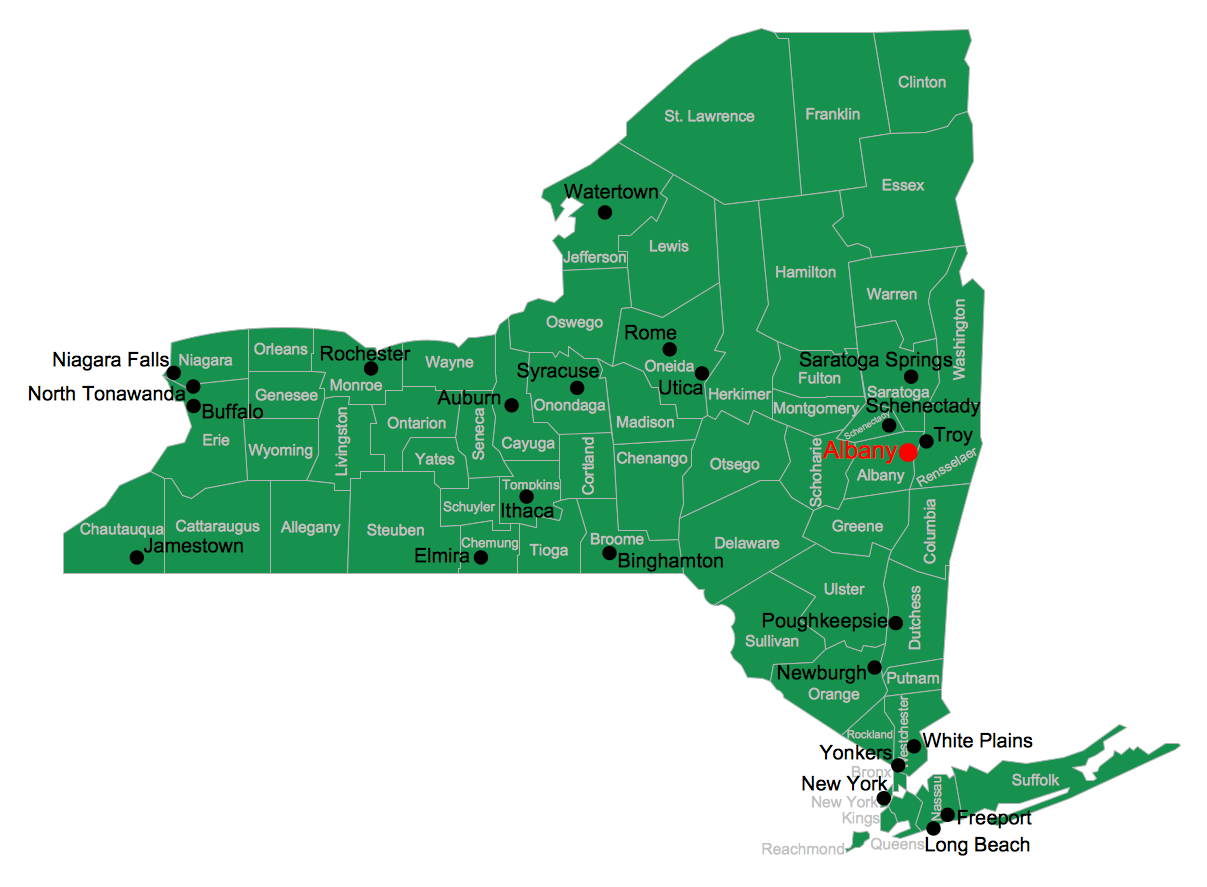
Picture: USA Map
Related Solution:
ConceptDraw Business Finance Illustration examples and libraries contain vector clip art for drawing different Business and Finance Illustrations. You may find Advertising example, Project Management example, Business Model example and many more.
Picture: Business and Finance Illustrations Example
Related Solution:

